
Abstract
Electrochemical discharge machining (ECDM) process is a recent non-traditional machining technique used for structuring insulating materials like glass and ceramic substrates. In this work, systematic experimental investigations have been carried out to study the electrical and 2-D machining characteristics of an ECDM process. The influence of various process parameters like electrolyte type, electrolytic concentration, tool travel rate (TTR) and applied voltage on the process characteristics have been studied. Two different electrolytes, i.e., KOH and NaOH with concentrations varying from 10 to 50 % have been used to study their effect on critical voltage (Vc) and critical current (Ic). A cylindrical tungsten carbide tool of diameter 0.4 mm with varying TTRs (ranging from 0.3 to 4 mm/min) and an applied voltage varying from Vc + 2 V to Vc + 5 V is used for realizing microchannels. The influence of these parameters on the quality factors such as geometric accuracy, surface smoothness and channel outlines are explored using the optical images of the machined channels. Experimental results demonstrate that precise channels with smooth surface, and regular channel edges can be obtained at an applied voltage of Vc + 4 V and TTRs between 1 and 2 mm/min.
1 Introduction
In recent years, electrochemical discharge machining (ECDM) process, is gaining research attention due to various applications like micro-machining of non-conducting materials (Fascio et al. 1999; Saranya and Ravi Sankar 2015), nano-particle synthesis (Allagui and Wuthrich 2011; Lal et al. 2008), fabrication of MEMS devices (Esashi et al. 1990; Lee et al. 2004; Ravi Sankar et al. 2011) and micro-welding (Ghosh et al. 1997). The discharge phenomenon has been addressed in the literature as the electrode effect (Wuthrich and Bleuler 2004), plasma electrolysis and glow discharge electrolysis (Kareem and Kaliani 2012) with a few theories proposed to explain the concept behind these discharges (Ghosh 1997; Wuthrich and Fascio 2005). The discharge effect was first reported (Fizeau and Focault 1844) by studying the spectra obtained by the light source between two carbon electrodes and the spectra from the sun. Even though, the effect was observed in the 19th century, it was used for structuring insulating materials (Kurafuji and Suda 1968) at a much later period around 1968. This process is called by various names like electrochemical discharge machining (ECDM) (Ghosh et al. 1997; Wuthrich and Fascio 2005), spark assisted chemical engraving (SACE) (Fascio et al. 2003; Ozhikandathil et al. 2011), electrochemical spark discharge (ECSD) (Gautam and Jain 1998) or electrochemical arc machining process (ECAM) (Crichton et al. 1981) by various researchers.
The applications of insulating substrates (Yamahata et al. 2005; Henry et al. 2007) like glass and ceramics in the field of MEMS are increasing continuously due to their unique properties like chemical, temperature and electrical inertness, corrosion resistance and biocompatibility. However, the brittle nature remains a great challenge when glass machining is concerned. With the various traditional (Iliescu et al. 2008) and non-traditional (Choi et al. 2007; Chung and Lin 2010) machining techniques having their own limitations, a new machining technique becomes a necessity for micro-structuring of insulating materials. Electrical discharge machining (EDM) and the electrochemical machining (ECM) techniques can be used for machining conducting materials alone (Almeida et al. 2008; Bhattacharyya et al. 2002), whereas, ECDM is a hybrid (ECM + EDM) technique that can be used for micro-structuring insulating substrates like glass, ceramics, quartz, etc.
The ECDM process requires an active electrode (cathode) and an ancillary electrode (anode) dipped into an electrolytic solution, separated by a distance with a DC voltage applied between them. Either the anode or the cathode can be used as the active electrode. However, the latter is more preferred as the tool wear rate is negligible and the machining accuracy is high (Jain and Adhikary 2008). The active electrode is designed to be relatively smaller than the ancillary electrode. With an increase in the applied voltage, the electrolysis process is initiated and beyond a certain voltage called the critical voltage (Vc), spark discharges are observed at the cathode (active electrode tip). An insulating substrate, placed at the close vicinity of these sparks will undergo material removal thereby resulting in microstructures on the substrates. Material removal occurs by both thermal and chemical means. The actual process involved in the material removal mechanism of an ECDM process has been explained by Mcgeough et al. (1998) and Wuthrich (2009). The electrical characteristics of an ECDM process are defined by the critical voltage and the critical current. The electrolyte type, electrolytic concentration, tool material, tool dimension and tool immersion depth are the process parameters that affect the electrical characteristics.
Microchannelling is an important application of the ECDM process. Lab-on-a-chip devices include microchannels as integral part in their device design. The quality of a microchannel is characterized by its (1) geometrical precision and (2) physical features like surface smoothness, channel profile and outline contours. The major parameters that affect the above mentioned quality factors of the fabricated microchannels are: (1) the applied voltage and (2) the tool travel rate (TTR), i.e. the speed with which the tool is moved over the substrate to fabricate the microchannel.
In this paper, a systematic study has been carried out on the electrical characteristics i.e. critical voltage and critical current of an ECDM process by considering the effects of the process parameters such as (1) electrolytes like NaOH and KOH, (2) different electrolytic concentrations, (3) diameters of active electrodes and (4) tool immersion depths. Microchannels were fabricated on glass substrates at various tool travel rates and applied voltages to study their effects on the quality factors that characterize a microchannel. The results are discussed with the help of optical images.
2 Experimental set-up and process involved
A schematic of the ECDM setup used in the present study is shown in Fig. 1. The ECDM unit provides motion along three axes i.e. the X, Y and Z coordinates. The tool electrode is held by a chuck attached to a vertical rod that can move along the Z axis with the help of a stepper motor. The tool can be positioned over the substrate immersed in a borosil®-made electrolytic cell, placed over the XY stage provided with a stepper motor each. The three stepper motors are driven by a microcontroller unit that is interfaced to a computer through a software called Multi-CNC. A platinum electrode is used as the anode and a tungsten carbide tool is used as the cathode. A 100 V–5A regulated supply unit is used as the power source.

Schematic of the custom-made ECDM setup used in the present study
According to the Arrhenius dissociation theory, when a strong base is dissolved in water, it is dissociated into ions. With this ionised solution as an electrolyte, when a DC voltage is applied between the electrodes that are dipped into it, electrolysis occurs. Electrolysis results in reduction and oxidation process at the cathode and the anode respectively.
This process obeys the Ohms law showing a linear variation of current with an increasing voltage. Due to the redox reaction, oxygen and hydrogen gas are evolved in the form of bubbles at the anode and the cathode respectively, thus disrupting the Ohm’s law behaviour of the electrolysis process. With an increasing voltage, these bubbles coalesce and form a gas film around the tool that completely isolates the tool from the electrolyte. Beyond a certain voltage called the critical voltage, this gas film breaks-off resulting in electrical discharges that aids in micro-structuring insulating substrates. The intensity of the spark can be controlled by the applied voltage. The critical voltage required for the break-down of the gas film depends on the various process parameters like electrolyte type, concentration of the electrolyte, surface roughness of the tool, tool geometry, tool dimension, tool immersion depth and tool rotation speed.
In an ECDM process material removal occurs due to the high temperature created by the discharges. The viscosity of the glass substrate is reduced by the high temperature resulting in the weakening of the silicon-oxygen bonds thus reducing the melting point of the substrate. This leads to heating, melting and vaporization of the workpiece. Similarly, the high temperature also accelerates the chemical etch rate of the substrate (Fascio et al. 1999, 2003) that contributes to material removal. If NaOH and KOH are used as electrolytes they form metal (M) oxides as given in Eq. 3.
If the silicate does not dissolve completely in the electrolyte, then it gets retained on the machined surface forming glass melts, resulting in a rough machined surface. The material removal rate (MRR) increases with the mobility of the metal ions present in the electrolyte.
3 Results and discussions
To study the effect of various process parameters, experiments were performed using tungsten carbide tools of different diameter (0.1, 0.2, 0.3 and 0.4 mm) in two different electrolytes (NaOH and KOH) at various immersion depths. The effects of these parameters on critical voltage and critical current have been discussed in Sects. 3.1 and 3.2 respectively. Microchannels of 3 mm length were fabricated at different voltages (Vc + 2 V to Vc + 5 V) and tool travel rate (0.3–4 mm/min) on the glass substrates and their effects on the channel characteristics were observed through an optical microscope and the results are discussed in Sect. 3.3.
3.1 Effect of electrolyte type and electrolytic concentration on critical voltage and critical current
In an ECDM process, the electrolytes serve two purposes: (1) to render electrical conductivity required to enable gas film formation and (2) to etch the workpiece during the machining process. Typical electrolytes used in an ECDM process include NaOH, KOH, KCl and NaCl. Due to chemical etching of the glass substrate, NaCl and KCl form heavy salt precipitates that require often replacement of the electrolytic solution. Due to this reason, NaOH and KOH are preferred as electrolytes in ECDM processes. For a fixed temperature, electrical conductivity of an electrolyte is dependent on the individual ion mobility of the ions present in the electrolyte and is given by the following expression:
where e is the amplitude of electron charge, u+ and u− are the mobility of anions and cations respectively, n+ and n− are the number of anions and cations present in the electrolytic solution per volume with charges z+ and z− respectively.
The effect of electrolyte type and electrolytic concentration on critical voltage is represented in Fig. 2. Firstly, analyzing the effect of electrolyte type, it can be observed that KOH requires a higher voltage to breakdown the gas film when compared with NaOH. When we consider two electrolytes of same concentration, their mole fraction (M) will vary. The mole fraction of a solution is given by \({\text{M}} = \left( {{\text{m}}_{ 2} /\left( {{\text{m}}_{ 1} + {\text{m}}_{ 2} } \right)} \right)\) , where m1 and m2 are the number of moles of solvent and solute respectively. When compared with KOH, NaOH has more number of moles for the same concentration and thus its conductivity is higher. Thus the current flowing in between the electrodes increase as well. Higher conductivity facilitates a rapid gas film formation at a comparatively lesser applied voltage. This results in reducing the voltage required for the gas film breakdown.

Variation of critical voltage with electrolytic concentration for two different electrolytes
It can be observed in Fig. 2 that the critical voltage required for the gas film breakdown is varying with electrolytic concentration. The number of anions and cations in the solution are dependent on the concentration of the electrolytic solution. With an increase in the concentration of the electrolyte, there are more number of individual ions and hence the conductivity of the solution is increased. Therefore, for a particular electrolyte, the electrical conductivity increases with an increase in electrolytic concentration. The increased electrical conductivity affects the bulk electrolytic resistances and enhances the rate at which the gas film is formed. The current flow between the electrodes increases with increasing conductivity. Thus, the current density is high and results in an increase in the number of bubbles, thereby reducing the mean distance between them. These bubbles coalesce when they gain mechanical contact and form a gas film at a relatively lower voltage. Thus, the critical voltage required for the gas film breakdown is reduced. Therefore, with increasing concentration, the critical voltage reduces and the critical current increases for a particular electrolyte. The increase in critical current with increasing electrolytic concentration can be observed in Fig. 3.

Variation of critical current with electrolytic concentration for two different electrolytes
The variation of critical voltage and critical current with variation in electrolyte type and electrolytic concentration are in accordance with the mathematical model proposed by Basak and Ghosh (1996):
and
where, Jc is the critical current density, M is the mole fraction of the electrolyte, A is the active area of the tool electrode, ã is the hydrogen + water vapour generation rate per unit area = 16.05 cm/s, α is the coefficient of Faradic hydrogen generation (0.23 cm3/A s), δ is the coefficient of vapour generation (0.048 cm3/W s) and K2, K3, λ2, λ3 are all constants. From pilot experiments (Basak and Ghosh 1996), the values for λ2 and λ3 were reported to be −0.5 and −1.0 for NaOH and KOH respectively, K2 = 0.15 for both NaOH and KOH, K3 = 0.03 and 0.055 for NaOH and KOH respectively. From the equation it can be observed that both Vc and Ic are proportional to the mole fraction (M) of the electrolyte that varies with electrolyte type and electrolytic concentration. The mole fraction increases with electrolytic concentration and thus reducing the critical voltage. With increasing concentration, the current flow increases and results in higher critical current. Due to relatively lesser conductivity, KOH requires higher critical voltage and lower critical current than NaOH.
3.2 Effect of tool diameter and tool immersion depth on critical voltage and critical current
Once a potential difference is applied between the electrodes, the electrolyte decomposes at a decomposition potential and clusters of bubbles are formed with a mean occupation probability (pc) (percolation threshold) on the electrode of surface area A. These bubbles grow in size to attain a maximum growth before detaching from the electrode surface. When the current density is higher, the number of bubbles increases and the mean distance between the bubbles is reduced. Thus, when the growing bubbles gain physical contact with the neighbour bubbles, they coalesce with each other forming a gas film around the tool electrode. At the critical voltage (Vc), the gas film breaks off resulting in a spark discharge. During the drilling phenomenon using the ECDM process the machining tool should be lowered into the electrolyte to achieve the required machining depth. This changes the active tool area of the electrode during machining process. This leads to variation in the critical voltage and critical current values. The active tool area is a measure of both, tool immersion depth and tool diameter. The variation of critical voltage and critical current with the tool immersion depth for different tool diameters are shown in Figs. 4 and 5. It can be observed from Fig. 4 that for tools of varying diameters the critical voltage increases with an increase in the immersion depth. Similarly, it can be observed from Fig. 5 that critical current also increases with tool immersion depth.

Variation of critical voltage with tool immersion depth for various tool diameters

Variation of critical current with tool immersion depth for various tool diameters
Likewise, the effect of tool diameter on critical voltage and critical current are shown in Figs. 6 and 7 respectively. These experimental results are in accordance with the model proposed by Wuthrich (2009):

Variation of critical voltage with tool diameter for different electrolytic concentration

Variation of critical current with tool diameter for different electrolytic concentration
where, Vd is the decomposition potential of the electrolyte, pc is the percolation threshold, A is the area of the electrode surface, R(pc) is the resistance due to the gas film, ξ is a function of wettability describing the degree of flatness of the bubble, dn is the mean distance between the bubble nucleation sites, β is the coefficient of faradic gas generation and Δtb is the time taken by the bubbles to attain the maximum diameter before detaching from the surface of the tool electrode. During the machining process, an increase in active tool area leads to an increase in the tool surface area being exposed to the electrolyte. In this case, the current flowing between the electrodes increases due to the reduction in the electrode resistance. From Eq. 7, it can be observed that critical current is proportional to the tool area and increases with tool diameter and tool immersion depth. This can be observed in Figs. 5 and 7 where, the critical current is increasing with tool immersion depth and tool diameter respectively. The applied voltage required to form a gas film around the tool will increase with an increase in the active tool area. This will result in higher critical voltage for the gas film breakdown. It is evident from Eq. 8 that the critical voltage is dependent on the tool area and this can be observed from Figs. 4 and 6.
3.3 Microchannelling using an ECDM process
From the electrical characteristics, KOH solution of 30 % concentration and a 0.4 mm tungsten carbide tool were chosen for microchannel fabrication. Generally, the quality of a microchannel is characterized by its geometrical accuracy and physical features such as surface smoothness and a regular channel outline. In the microchannel fabrication process using ECDM technique, TTR and applied voltage play an important role in determining the quality. A set of TTR and applied voltages were derived from pilot experiments for the study and the ranges were selected as follows: (1) TTR = 0.3 mm/min up to 4 mm/min (2) applied voltage = Vc + 2 V up to Vc + 5 V. For the values lesser and higher than the selected range of parameters, the quality of the microchannels was found to be poor. In general, channels fabricated at a very low TTR (0.3 mm/min) results in surface roughness due to the formation of melts and also due to the excess exposure of the substrate surface to the spark discharge. However, the microchannels fabricated at a very high tool TTR also does not provide an acceptable channel profile and results in the stick and jump effect (Jana et al. 2012). An optical image of a microchannel machined with Vc + 4 V at a high TTR (6 mm/min) is shown in Fig. 8. During the machining process, a shallow region is formed on the substrate right under the tool tip with a lump being formed around it and thus trapping the tool. Since the TTR is higher, there is no time for this material to be removed inorder to provide an even machining. Thus, tool jumps from the trapped region to the next position on the substrate resulting in a surface with a shallow hole surrounded by melts. This effect is called the stick and jump effect.

An optical image of a microchannel fabricated using a 0.4 mm tungsten carbide tool with an applied voltage of Vc + 4 V at a TTR of 6 mm/min showing stick and jump effect
At voltages less than Vc + 2 V the material removal rate is very less and is insufficient to provide a good quality channel, whereas, high voltages results in wider heat affected zones (HAZ), poor surface quality and irregular channel contours. The values of applied voltage and TTR can be distinguished into four combinations depending on the quality of the microchannel they result in during fabrication. These combinations are as follows:
-
1.
Voltage above Vc + 5 V and TTR up to 1 mm/min: This condition results in microchannels having irregular, heat affected and thermally fractured channel edges with a rough surface. An optical image of a microchannel fabricated at Vc + 7 V at a TTR of 0.3 mm/min is shown in Fig. 9. Since the channel edges are exposed to a higher voltage for a longer period of time it is observed to be fractured and affected by heat. The width of the channel shows a large variation along the length of the channel. The inset in Fig. 9 shows the optical image of the channel with its surface being focussed. The surface is observed to have a very rough surface with severe cracks due to the effect of the intense heat caused by the higher range of applied voltage for a prolonged time.
Fig. 9 
An optical image of a microchannel fabricated using a 0.4 mm tungsten carbide tool with an applied voltage of Vc + 7 V at a TTR of 0.3 mm/min. The inset shows the focussed view of the channel surface
-
2.
Voltage above Vc + 5 V and TTR between 1 and 3 mm/min: This machining condition results in microchannels with irregular and heat affected outline edges but with a better channel surface. Figure 10 shows an optical image of a microchannel fabricated at Vc + 7 V and with a TTR of 2 mm/min. The channel edges are heat affected due to the high applied voltage. However, there are no thermal fractures due to the relatively higher TTR compared to the previous condition. This also provides a channel with less surface roughness devoid of any cracks. The optical image focussing the surface of the channel fabricated is shown in the inset in Fig. 10. The channel width is reduced when compared with the previous condition. This is due to the increase in TTR that reduces the exposure time of the substrate to the discharges. Also, the variation in width along the length of the channel is reduced.
Fig. 10 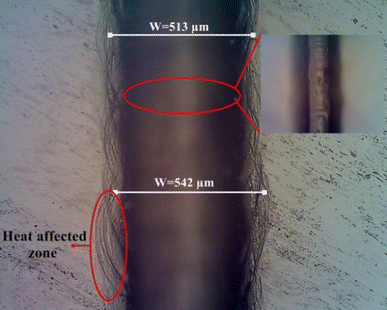
An optical image of a microchannel fabricated using a 0.4 mm tungsten carbide tool with an applied voltage of Vc + 7 V at a TTR of 2 mm/min. The inset shows the focussed view of the channel surface
-
3.
Voltage up to Vc + 4 V and TTR lesser than 1 mm/min: An optical image of a microchannel fabricated with Vc + 4 V at TTR of 0.5 mm/min is shown in Fig. 11. The microchannel is observed to have a smooth surface without any glass melts due to the optimum voltage and TTR. However, the edges are not linear throughout the channel, thereby resulting in non-uniform width. This is attributed to the dispersion of the discharges in the selected TTR range which is on the higher side than required. Also, the channel width is reduced due to the reduction in the applied voltage.
Fig. 11 
An optical image of a microchannel fabricated using a 0.4 mm tungsten carbide tool with an applied voltage of Vc + 4 V at a TTR of 2 mm/min. The inset shows the focussed view of the channel surface
-
4.
Voltage up to Vc + 4 V and TTR between 1 and 2 mm/min: Microchannels fabricated within this range were observed to have a smooth machined surface with well-defined, linear and uniform edges devoid of HAZ. Figure 12 shows an optical image of a well-defined microchannel fabricated with Vc + 2 V at a TTR of 1 mm/min. The inset shows the smooth surface of the channel. The channel width shows negligible variation along the channel length and also the machining precision is increased by the reduced channel width.
Fig. 12 
An optical image of a microchannel fabricated using a 0.4 mm tungsten carbide tool with an applied voltage of Vc + 2 V at a TTR of 1 mm/min. The inset shows the focussed view of the channel surface


This section summarises the quality of the microchannels obtained for the various combinations of applied voltage and TTR. Applied voltages up to Vc + 4 V provides an acceptable microchannel quality. Microchanelling at TTRs between 1 and 2 mm/min with applied voltages up to Vc + 4 V provides a good quality microchannel with smooth surface and a linear channel outline.
4 Conclusion
In this paper the effects of the various process parameters such as electrolyte type, electrolytic concentration, tool diameter and tool immersion depth on the electrical characteristics of an ECDM process were studied experimentally. It was observed that KOH requires a higher critical voltage than NaOH solution due to its relatively lesser conductivity. For a particular electrolyte, critical voltage and critical current decreases and increases respectively with an increase in electrolytic concentration. Further, the critical voltage and critical current were observed to increase for an increase in tool immersion depth and tool diameter. The quality of the microchannels, being influenced by the TTR and applied voltage, a set of values were selected from pilot experiments and the channel characteristics were studied for various ranges of TTRs (0.3 mm/min to 4 mm/min) and applied voltages (Vc + 2 V to Vc + 5 V). It was observed that for a range of applied voltage lesser than Vc + 4 V with TTR ranging from 1 to 2 mm/min, the fabricated microchannels have the least width with a smooth channel surface and linear outline edges.
References
Allagui A, Wuthrich R (2011) The electrochemical discharges for the synthesis of nickel oxide nanoparticles: characterization and mechanism. Electrochimic Acta 58:12–18
Almeida FA, Sacramento J, Oliveira FJ, Silva RF (2008) Micro- and nano-crystalline CVD diamond coated tools in the turning of EDM graphite. Surf Coat Tech 203:271–276
Basak I, Ghosh A (1996) Mechanism of spark generation during electrochemical discharge machining: a theoretical model and experimental verification. J Mater Process Tech 62:46–53
Bhattacharyya B, Mitra S, Boro AK (2002) Electrochemical machining: new possibilities for micromachining. Robot Comput Integr Manuf 18:283–289
Choi JP, Jeon BH, Kim BH (2007) Chemical-assisted ultrasonic machining of glass. J Mater Process Technol 191:153–156
Chung CK, Lin SL (2010) CO2 laser micro-machined crackles through holes of Pyrex 7740 glass. Int J Mach Tool Manuf 50:961–968
Crichton IM, Mcgeough JA, Munro W, White C (1981) Comparative studies of ECM, EDM and ECAM. Precis Eng 3:155–160
Esashi M, Matsumoto Y, Shoji S (1990) Absolute pressure sensors by air-tight electrical feedthrough structure. Sensor Actuat A21-A23:1048–1052
Fascio V, Wuthrich R, Viquerat D, Langen H (1999) 3D microstructuring of glass using electrochemical discharge machining (ECDM). Proc Int Symp Micromec Hum Sci. doi:10.1109/MHS.1999.820003
Fascio V, Langen HH, Bleuler H, Comninellis Ch (2003) Investigations of the spark assisted chemical engraving. Electrochem Comm 5:203–207
Fizeau H, Focault L (1844) Research on the intensity of light emitted by carbon on the experience of Davy. Ann Chim Phys 11:370–383
Gautam N, Jain VK (1998) Experimental investigations into ECSD process using various tool kinematics. Int J Mach Tool Manuf 38:15–27
Ghosh A (1997) Ectrochemical discharge machining: principle and possibilities. Sadhana 22:435–447
Ghosh A, Krishna M, Muju T, Parija S, Kanjrathinkal A (1997) Microwelding using electrochemical discharge. Int J Mach Tool Manuf 37:1303–1312
Henry FO, Hoettges KF, Reddy SM, Hughes MP (2007) An integrated dielectrophoretic quartz crystal microbalance (DEP-QCM) device for rapid biosensing applications. Biosens Bioelectron 23:225–232
Iliescu C, Chen B, Miao J (2008) On the wet etching of Pyrex glass. Sensor Actuat A 143:154–161
Jain VK, Adhikary S (2008) On the mechanism of material removal in electrochemical spark machining of quartz under different polarity conditions. J Mater Process Technol 200:40–470
Jana DAZ, Didar TH, Wuthrich R (2012) Micro-texturing channel surfaces on glass with spark assisted chemical engraving. Int J Mach Tool Manuf 57:66–72
Kareem TA, Kaliani A (2012) Glow discharge plasma electrolysis for nanoparticles synthesis. Ionics 18:315–327
Kurafuji H, Suda K (1968) Electrical discharge drilling of glass. Annals CIRP 16:415–419
Lal A, Bleuler H, Wuthrich R (2008) Fabrication of metallic nanoparticles by electrochemical discharges. Electrochem Commun 10:488–491
Lee ES, Howard D, Liang E, Collins SD, Smith RL (2004) Removable tubing interconnects for glass-based micro-fluidic systems made using ECDM. J Micromech Microeng 14:535–541
Mcgeough JA, Khayry ABM, Munro W, Crook (1998) Theoretical and experimental investigation of the relative effects of spark erosion and electrochemical dissolution in electrochemical arc machining. Ann CIRP 32:113–118
Ozhikandathil J, Morrison A, Packirisamy M, Wuthrich R (2011) Low resistive silicon substrate as etch-stop layer for drilling thick SiO2 by spark assisted chemical engraving (SACE). Microsyst Technol 17:373–380
Ravi Sankar A, Bindu VSS, Das S (2011) Coupled effects of gold electroplating and electrochemical discharge machining processes on the performance improvement of a capacitive accelerometer. Microsyst Technol 17(10–11):1661–1670
Saranya S, Ravi Sankar A (2015) Effect of tool shape and tool feed rate on the machined profile of a quartz substrate using an electrochemical discharge machining process. 2nd International Symposium on Physics and Technology of Sensors (ISPTS) doi: 10.1109/ISPTS.2015.7220137
Wuthrich R (2009) Micromacining using electrochemical discharge phenomenon-fundamentals and applications of spark assisted chemical engraving. Elsevier, New York
Wuthrich R, Bleuler H (2004) A model for electrode effects using percolation theory. Electrochim Acta 49:1547–1554
Wuthrich R, Fascio V (2005) Machining of non-conducting materials using electrochemical discharge phenomenon—an overview. Int J Mach Tool Manuf 45:1095–1108
Yamahata C, Lacharme F, Burri Y, Martin AMG (2005) A ball valve micropump in glass fabricated by powder blasting. Sensor Actuat B 110:1–7
Author information
Authors and Affiliations
Corresponding author
Rights and permissions
About this article

Cite this article
Saranya, S., Nair, A. & Ravi Sankar, A. Experimental investigations on the electrical and 2D-machining characteristics of an electrochemical discharge machining (ECDM) process. Microsyst Technol 23, 1453–1461 (2017). https://doi.org/10.1007/s00542-016-3027-8
Received:
Accepted:
Published:
Issue Date:
DOI: https://doi.org/10.1007/s00542-016-3027-8