
Abstract
The sports decision-making system is affected by many factors, and the sports decision-making system itself is a complex decision-making system, including multiple micro-systems. In order to construct a more scientific sports decision-making model, this paper builds a sports decision-making model based on data mining and neural network based on data mining technology and neural network algorithms. Moreover, based on the analysis of system theory, stakeholder theory and multi-objective decision-making theory, this paper provides a theoretical basis for the study of multi-objective decision-making problems in sports events. In addition, this paper discusses the starting point of decision-making and the scope of research from the basic concepts of sports decision-making and analyzes the multi-objective decision-making system of sports decision-making. At the same time, on this basis, this paper designs a multi-objective decision-making model for sports events, and finally conducts empirical research based on the designed model. Through empirical analysis and simulation research, it can be known that the combined model constructed in this paper performs well and has certain practical effects.
1 Introduction
Decision-making is a science, and it is a comprehensive science that spans natural sciences, social sciences, and thinking sciences, and involves society, politics, economy, and people's daily lives. It is produced with the emergence of mankind, and develops with the development of mankind. In ancient times, there were a group of staff around the ruling class, who made suggestions for them. In today's modern society, decision-making is more direct and important to the rise and fall of the country and the success or failure of the cause. It can be said that a correct decision is half the battle. Education is the key to the rise and fall of a country. Educational decision-making is the key to the development of education [1]. No matter what correct educational thought or theory is, if it is not transformed into educational decision-making, it will be difficult to enter educational activities and become the actual dominating force of educational behavior. Therefore, education decisions should also be paid attention to. The success of educational decision-making depends to a large extent on the scientificity of educational decision-making. The scientific decision-making of education is a key factor and important guarantee for the success of educational activities. At present, there are many researches on educational decision-making, but most of them are on the theoretical level. These studies have improved people's understanding of decision-making in the educational field and provided theoretical support for future research on specific operational levels. The research on university management decision-making is mainly focused on the scientific and democratic research of decision-making. These studies reflect that scholars should diversify decision-making subjects and that decision-making methods should shift from experience to scientific thinking, and provide suggestions for management decision-making in universities. By analyzing these research results, we can find that many scholars still focus on theoretical research. For this reason, on the basis of researching the basic theory of management decision-making, this paper deeply investigates the current situation of management decision-making of Shandong Province Sports Department. Moreover, on this basis, this paper constructs a management decision-making model for college physical education departments and proposes a research on the planning and design of decision support systems. The in-depth investigation of the current decision-making status of the Shandong Provincial Physical Education Department can increase the importance of the colleges and universities on the decision-making, and can improve the accuracy of the decision-making. At the same time, the planning of the decision support system can improve the scientificity and efficiency of decision-making, and provide effective theory and method guidance for the scientific management of college physical education departments [2].
With the continuous improvement of the level of competitive sports in my country and the continuous development of sports cognitive psychology, the sports field has paid more and more attention to decision-making. There are a lot of decision-making phenomena in sports. Whether it is a complex collective sports event or a simple individual sports event, the decision-making level of an athlete is a key factor affecting his technical level and athletic performance. It can be said that sports decision-making issues occupies a pivotal position in sports. The understanding of sports decision-making will greatly improve the quality of sports training and the performance of sports competitions, which has very practical significance [3].
2 Related work
The literature [4] showed that sports decision-making occupies a very important position in ball games. The literature [5] pointed out that the best basketball player does not necessarily have the best action, the fastest speed or the highest shooting accuracy, and does not necessarily have the strongest information processing ability or the best spatial vision, but he should have a superior ability to select, process and extract situational information than the average player. Psychological and thinking activities are accompanied by all technical and tactical actions of basketball players. What high-level basketball players consider in the game is not how to pass, break and shoot, but when to pass, break and shoot. Therefore, in high-level competitions, the primary factor for winning is the thinking and decision-making ability of basketball players. Moreover, the intense and intense basketball game contains a lot of decision-making behaviors. In recent years, more and more researchers have begun to pay attention to the influence of emotional factors in human decision-making behavior. In daily life, each individual will inevitably be affected by emotions when making choices. Moreover, individual emotions play an important role in behavioral decision-making, interpersonal communication and mental health. In addition, positive and negative emotions are the core process of a person's psychology, and they both explain a large proportion of the variation in a person's psychological sadness and happiness level. In the field of sports, emotion is also an important factor that affects athletes' decision-making and thus the final result of the game. If the athlete's emotional regulation is not good, they will often miss the gold medal. Moreover, athletes who can win and win gold medals must be masters of emotions. Many scholars regard self-esteem as an important factor affecting mental health, which plays a regulatory role in the relationship between people and the social environment, and through experiments found that it is negatively correlated with negative emotions such as depression and anxiety [6]. By studying the cognitive behaviors of individuals with different levels of self-esteem, it is found that individuals with high levels of self-esteem tend to actively process information and show more optimism, self-confidence and expectation of success. However, individuals with low self-esteem are more associated with negative emotions and behaviors [7]. Self-esteem is the core factor that affects the individual's social adaptability. It can determine the individual's expectations, maintain the stability and continuity of personality development, and promote the healthy development of personality.
The literature [8] described the internal process of sports decision-making: Firstly, the information in the environment is perceived by the subject and stored in short-term memory, and then compared with the information stored in long-term memory; finally, based on the comparative answer, the exercise behavior is selected. The literature [9] put forward a more comprehensive description of this: Exercise decision-making is the process of obtaining information, storing and analyzing the information, and then selecting a behavioral plan during exercise. It is different from the decision-making behavior in the general situation because of the tight time in the intense sports situation, the difficulty in obtaining information, and the unknowable result. Based on this, the sports decision-making can be defined as follows: Sports decision-making is a cognitive process, it exists in the intense sports environment, the goal is to obtain victory, and choose which sports behavior to adopt. Decision-making in sports can be divided into cognitive decision-making and intuitive decision-making. The former is guided by rational logical thinking, its decision-making speed is slow, the demand for information is large, and it is similar to general decision-making activities and has certain reliability. However, the latter mostly occurs in intense sports. In these sports, less information is available and individuals need to respond quickly. The literature [10] investigated the decision-making behaviors of table tennis and rock climbing, and found that there are different decision-making processes in these two sports. The former is mostly intuitive decision-making, which emphasizes rapid decision under time constraints, and the latter is mostly cognitive decision-making, which emphasizes the correctness of decision-making. The literature [11] put forward the concept of "perceptual prediction", he pointed out that sometimes the acquisition and processing of insufficient information will affect the performance of sports. For example, in order to prevent an ice hockey puck from flying, an ice hockey goalkeeper needs to analyze and estimate the position of the opponent's players by using information in the environment. In this process, the athlete's ability to predict perception is reflected. The literature [12] studied the visual search characteristics of basketball experts and novices. The results of the study found that experts watch less frequently than novices, and have shorter decision-making reaction times; experts look more at offensive-defensive players, while novices only focus on teammates in the same group; experts are good at selecting certain information when conducting visual search, and take action immediately once they have the corresponding information. The literature [13] found through studying the eye movements of boxers that the eye movement pattern of the expert group was circular, while the gaze pattern of the novice group was linear. Based on previous studies, it can be seen that elite athletes have the ability to process incomplete information in advance to achieve perceptual prediction. The literature [14] pointed out that experts have more experience and technology about sports, which makes the structure and sequence of variables in the information processing process more organized. In this regard, the literature [15] proposed three possible explanations: One is that the expert has more blocks to process information; the other is that the expert does not need certain information processing procedures; the third is that the experts do not need to prove their predictive ability in freeze-frame experiments.
The literature [16] selected fencing athletes as research participants, and used dynamic game images as experimental materials to investigate the impact of cognitive methods and information on decision-making. The results show that the decision-making speed of the elite group of foil and epee athletes was significantly faster than that of the average and high level athletes. The literature [17] found that the factors that affect intuitive sports decision-making in badminton competition scenarios include knowledge representation, exercise level and age. The literature [18] found through research that novices have fewer concepts than experts in problem representation. Moreover, it found that experts and novices also shows significant differences in processing methods, and experts tends to perform "top-down" processing. The literature [19] confirmed that when dealing with information in sports situations, high-level athletes show more attention to and search capabilities for key information than low-level athletes. The literature [20] used the expert-novice paradigm to discuss the differences in sports situations of table tennis players at different levels, and concluded that athletes’ perception of sports information is similar to pattern recognition, and feature matching plays a certain role in it.
3 Multi-objective decision method
According to the characteristics of the problem, multi-objective decision-making problems are divided into multi-objective optimization decision-making and multi-objective attribute decision-making. The first type of problem is characterized by the continuity (infinity) of the decision-making plan, and the basic solution idea is to solve the problem through mathematical programming. The second type of problem is characterized by the finite number of solutions, and the basic solution idea is to sort a limited number of solutions, and then select the solutions according to established rules.
The typical solution to the first type of problem is the target planning model. Multi-objective planning model (MPO) is to obtain multiple objective functions to achieve a better state at the same time under given constraints. Moreover, the model consists of two parts: objective function set and constraint condition set, and its mathematical expression is as follows [21].
Among them: \(f\left( x \right)\)—represents the objective function group, \(x \in R^{n}\)—represents the decision variable, \(g_{i} \left( x \right)\)—represents the inequality constraint condition, \(h_{j} \left( x \right)\)—represents the constraint condition of the equation form, I—represents the constraint condition of the equation form, Z—represents the constraint index set of the equation.
The most widely used method is to convert multiple objectives into a single objective for solution. The basic method is that if a certain objective function value in the objective function set can determine a range, then this objective function is transformed into a constraint condition and enters the constraint condition set. After transforming into a single target, the model is [22]:
\(G\left( {x_{i} } \right)\)—is the constraint function group.
The interval \(\left[ {a,b} \right]\) is the value range of the constraint function group, and the other symbols have the same meaning as above.
In addition to turning multi-objective problems into single-objective problems, other solutions include weighted sum method, goal programming method, sequence optimization method, etc.
The basic solution idea is to sort and select schemes according to certain rules. Therefore, there are three key issues, one is the preprocessing of the decision matrix data, the second is the determination of the target weight, and the third is the ordering of the plan.
-
(1)
Preprocessing of decision matrix data
The preprocessing of decision matrix data is to solve the characteristic problem of target incommensurability in multi-objective decision-making. The preprocessing methods of matrix data mainly include: vector normalization, linear transformation, standard 0–1 transformation, and standard sample transformation [23].
We assume that there are m plans, n indicators, and X is the decision matrix:
$$ X = \left[ {\begin{array}{*{20}c} {x_{11} } & {x_{12} } & \cdots & {x_{1n} } \\ {x_{21} } & {x_{22} } & \cdots & {x_{2n} } \\ \cdots & \cdots & \cdots & \cdots \\ {x_{m1} } & {x_{m2} } & \cdots & {x_{mn} } \\ \end{array} } \right] $$(3)The vector normalization processing method is:
$$ y_{ij} = \frac{{x_{ij} }}{{\sqrt {\sum\nolimits_{i = 1}^{m} {x_{ij}^{2} } } }}\left( {1 \le i \le m,1 \le j \le m} \right) $$(4)The linear change processing method is:
For benefit indicators:
$$ y_{ij} = \frac{{x_{ij} }}{{x_{j} \left( {\max } \right)}} $$(5)For cost indicators:
$$ y_{ij} = \frac{{\left( {1 - x_{ij} } \right)}}{{x_{j} \left( {\max } \right)}} $$(6)The standard 0–1 conversion processing method is:
For benefit indicators:
$$ y_{ij} = \frac{{x_{ij} - x_{j} \left( {\min } \right)}}{{x_{j} \left( {\max } \right) - x_{j} \left( {\min } \right)}} $$(7)For cost indicators:
$$ y_{ij} = \frac{{x_{j} \left( {\max } \right) - x_{ij} }}{{x_{j} \left( {\max } \right) - x_{j} \left( {\min } \right)}} $$(8)The standard sample transformation processing method is:
$$ y_{ij} = \frac{{x_{ij} - \overline{x}_{j} }}{{s_{j} }} $$(9)Among them, \(\overline{x}_{j} = \frac{1}{m}\sum\nolimits_{i = 1}^{m} {x_{ij} }\) represents the sample mean and \(s_{j} = \sqrt {\frac{1}{m}\sum\nolimits_{i = 1}^{m} {\left( {x_{ij} - \overline{x}_{j} } \right)^{2} } }\) represents the sample mean square error.
-
(2)
Weight
The basic methods of weight determination include relative comparison method, expert consultation method and entropy method. The expert consultation method (Delphi method) is to average the weight values assigned by different experts to a certain indicator.
Relative comparison method and expert consultation method are subjective weighting method, and entropy method is an objective weighting method. This study uses a comprehensive weighting method to combine entropy with the subjective weighting of decision makers.
-
(3)
Scheme sorting
The decision-making problem in multi-objective decision-making generally has two or more goals, and the goals contradict each other. Moreover, the constituent elements of a multi-objective decision-making problem include five parts: decision maker, decision-making environment, evaluation index system, attribute set, and decision rule. The multi-objective decision-making framework is shown in Fig. 1 [24].
Fig. 1 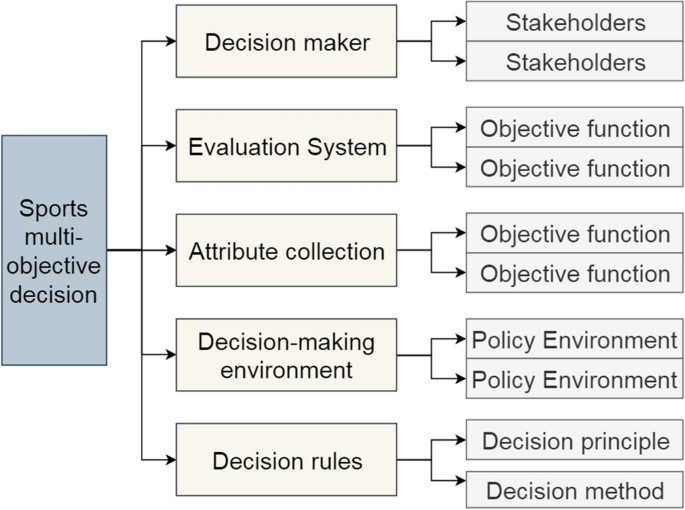
Multi-objective decision-making framework

4 Subject objective function construction
On the basis of learning from these four indicators, this study will make appropriate revisions according to the different research purposes to form social capital decision-making target indicators. To maximize its own profits, social capital must first realize the economic benefits of the project, that is, the requirements for the cash flow of the project. According to general project financial analysis, its objective function can be expressed as the value \(P_{{{\text{value}}}}\) obtained during the period [25]:
Among them, T represents the franchise period, \({\text{FCF}}_{t}\)—represents the net cash flow in year t, \({\text{WACC}}\)—represents the average cost of capital of the project.
The net cash flow \({\text{FCF}}_{t}\) in year t consists of cash inflows and cash outflows. The specific expression is:
In sports events, cash inflow \({\text{CI}}_{t}\) mainly includes consumer expenditure \(P \times Q\) and government subsidies W, Q represents consumption, and P represents the price actually paid by consumers. Cash outflow \({\text{CO}}_{t}\) includes construction and installation engineering costs, operation and maintenance costs, interest and other expenses.
The average cost of capital WACC is a comprehensive reflection of the cost of equity capital and the cost of debt capital, and its calculation formula is:
Among them: \(W_{e}\)—represents equity capital ratio, \(W_{d}\)—represents debt to capital ratio, \(r_{e}\)—represents the cost of capital of equity funds. The value of \(r_{e}\) is generally related to industry conditions, and it can be determined through empirical value or capital asset pricing models. \(r_{d}\)—represents the capital cost of debt capital, which is determined according to the source of debt capital. \(r_{{{\text{tax}}}}\)—represents the capital cost of debt capital, which is determined according to the source of debt capital.
According to the objective function, the index refinement is carried out, which mainly starts from the three aspects of the project's operating efficiency, financial risk, and profitability.
(1) The capital cost of the project.
(2) From the perspective of project financial analysis indicators, DOL (Degree of Operating Leverage) is generally used to express the project's operating risk.
Among them, \(C_{v}\) and \(C_{f}\) represent variable cost and fixed cost, respectively. The total income of the project minus variable costs and fixed costs is equal to the profit before interest and taxes. The above formula can also be expressed as its derivation:
The greater the operating leverage coefficient, the greater the risk. Among them, \({\text{EBIT}}_{n}\) is the profit before interest and taxes in the nth year. Its application conditions are that the business profit of the enterprise is greater than zero, and the price, cost and other factors are basically determined.
(3) In order to ensure long-term realization of greater economic benefits, social capital needs to control the financial risk of the project in real time. The financial leverage factor DFL (Degree of Financial Leverage) is used to express the financial risk of the project.
\(I_{n}\) is the current year's interest. The greater the financial leverage, the greater the financial risk. The conditions for the application of the financial leverage coefficient are: the after-interest and tax profit of the enterprise is greater than zero, and the capital scale, capital structure, debt interest rate and other factors are basically determined.
(4) For social capital, the internal rate of return of social capital investment is generally used to investigate profitability. The internal rate of return of social capital is expressed by P-IRR, which is the value of IRR when the following formula is established.
Among them, \({\text{CI}}\) and \({\text{CO}}\) are the cash inflow and outflow in the social capital investment cash flow statement. P-IRR is the discount rate when the net present value of the investment cash flow statement of the social capital party is zero, which represents the internal rate of return of the social capital party [26].
If the economic benefits of sports events are better, the government will provide less subsidies for sports events, and the more taxes the government will receive through sports events. On the one hand, it is to reduce costs, and on the other hand, it is to increase efficiency. This is manifested in the improvement of economic efficiency. Therefore, one of the objective functions of improving economic benefits can be expressed as the improvement of project profitability. From the perspective of cash flow, project net present value is generally used to express project profitability.
\(F_{{{\text{value}}}}\) represents the net present value of the project's entire life cycle from construction to handover. Among them, \({\text{CI}}\) and \({\text{CO}}\) are cash inflows and outflows in the cash flow statement of all investments in the project, and r is the average capital cost of the project.
The second objective function of the government is the realization of social benefits, which is discussed from the perspective of social welfare. In welfare economics, social welfare is generally equal to consumer surplus plus producer surplus, and for industries, the social welfare of the industry is equal to the difference between total consumption utility and production cost. Based on this, from the perspective of social welfare, the social welfare objective function of the BOT project is expressed as:
The above-mentioned social welfare objective function consists of three items, in order, the price that social users are willing to pay for the service, the price that users actually pay in the project, and the actual construction and operation cost of the BOT project. In the BOT project research, it is pointed out that the government's benefits include not only the concession period, but also the value obtained by the government from operating activities after the project is handed over. Combining the above two studies and considering the value after the project handover in the selection of the capital structure of the sports project, the social benefit function of the sports project is defined as follows:
The last item in the above formula is the value of the project after the transfer. The first item is the total social cost during the life of the project, the second item is the actual cost paid by consumers during the concession period, and the third item is the total cost of the project's construction and operation input by the project sponsor during the concession period.
We assume that sports events do not produce negative externalities. Based on the above three studies, considering the project's life cycle, the government objective function, the second social benefit objective function, is expressed as:
In the above formula, T represents the concession period, and \(T_{{{\text{life}}}}\) represents the entire life span of the government-operated time after the project is handed over. The first item in the objective function is the product of the demand during the concession period and the price \(\left( {P_{t}^{^{\prime}} } \right)\) that the public is willing to pay, that is, the price that consumers are willing to pay.
The second item is the product of the actual demand during the concession period and the price \(\left( {P_{t} } \right)\) actually paid by the public, that is, the price actually paid by consumers.
The third item is the producer surplus of the social capital as the investor in the sports project. Among them, producer surplus is the economic profit earned by the producer in the project, that is, the profit earned by the social capital during the concession period. \(E_{t}\) represents the income obtained as a producer's social capital during the concession period, and \(C_{t}\) represents input.
The fourth item is the income obtained by the government after the project is transferred to the government, which is represented by \(T_{{{\text{value}}}}\). Among them, \(CI_{t}\) and \(CO_{t}\) represent the cash inflow and outflow after the handover.
For public facilities, the price consumers are willing to pay is greater than the price actually paid. The concept of consumer surplus first appeared in Marshall's Principles of Economics. Consumer surplus is the difference between the price that consumers are willing to pay for a certain number of products and the price that consumers actually pay. Consumer surplus is shown in Fig. 2.

Consumer surplus
The curve in the above figure represents the demand curve \(p = f\left( q \right)\), which is the trend of changes in the price P that consumers are willing to pay as Q increases. Willingness to pay follows the marginal utility theory, so the curve is also equivalent to the marginal utility curve.
It can be seen that the marginal utility obtained by the user when purchasing the first product is the largest. After that, as the number increases, the marginal utility gradually decreases. The area of the curved triangle \(ABP_{1}\) in the shaded part in the figure above is the consumer surplus. The consumer surplus in sports events is the accumulation of the marginal utility corresponding to the total consumption of the public during the franchise period, expressed as:
In some scholars' research on the shadow price of public goods, the price they are willing to pay is used to represent the shadow price. The shadow price also comes from the marginal utility theory. Therefore, based on the above-mentioned understanding of the meaning of willingness to pay, in this stadium research, this paper uses the true value of a unit quantity of products to express the willingness to pay. Therefore, there is the following formula:
\(P^{\prime}\) represents the price willing to pay, \(C \times \beta\) represents the real cost of the stadium, Q represents the actual cost, \(\beta\) is the shadow price adjustment coefficient, and Q is the service volume.
According to the customer satisfaction index in ACSI to investigate the public satisfaction of sports events, we can regard customer satisfaction as the target variable, and perceived value, customer expectations and perceived quality as the cause variables. The relationship between them can be represented by the ACSI structure model, as shown in Fig. 3. The positive sign in the figure represents the promotion effect, and the negative sign represents the inhibition effect (Fig. 4).

ASCI structure model

The quantified index system for multi-objective decision-making in sports events
The customer expectation is the customer's estimate of the quality of the product through the information obtained before the purchase. The perceived quality is the customer's perception of the actual quality of the product through the consumption of the product. The perceived value refers to the comparison between the price paid by customers in the process of consuming the product and the actual experience obtained. The higher the perceived value, the higher the customer satisfaction. It can be seen from the ACSI structure model that customer expectations will affect the perceived quality, and the perceived quality will affect the perceived value. Therefore, the objective function of public satisfaction customer satisfaction M can be expressed as:
Among them, \(y_{1} ,y_{2} ,y_{3}\), respectively, represents three cause variables of perceived value, perceived quality, and customer expectations. According to the relationship between these three factors, the objective function can be simplified to \(M = f\left( {y_{1} } \right)\). Therefore, the index of public satisfaction can be expressed by perceived value.
The public’s perceived value of stadiums is mainly manifested in two aspects: one is the perception of quality at the price paid, namely \({C \mathord{\left/ {\vphantom {C P}} \right. \kern-\nulldelimiterspace} P}\), where the cost of sports items C is used to represent the experience of quality, and P is the price actually paid by the user; the second is the perception of price under a given quality, that is, \({P \mathord{\left/ {\vphantom {P C}} \right. \kern-\nulldelimiterspace} C}\), and its sign has the same meaning. Therefore, from the perspective of quantitative analysis, these two indicators have the same contribution to decision-making, so we can choose one in the specific application.
Through the above analysis of government, social capital and public objective functions and key indicators in sports events, this paper constructs a multi-objective decision-making quantitative index system for stadiums and sports events as shown in the figure below.
5 Multi-objective decision model designs
In information theory, information entropy is a measure of the order of the system. The larger the information, the higher the order of the system and the smaller the information entropy. However, the more disordered the system, the greater the information entropy. Therefore, information entropy can be used to calculate the amount of information contained in the index data in the evaluation index system, so as to calculate the weight to help make decisions. Information entropy inherits the three characteristics of thermodynamic entropy: additivity of entropy, non-negativity and extreme value of entropy. The entropy of the entire system is equal to the sum of the entropy of each state. Moreover, as the degree of disorder in the system increases, the value of entropy gradually increases. Shannon uses the function \(H\left( x \right) = H\left( {p_{1} ,p_{2} , \ldots ,p_{n} } \right) = - K\sum {_{i = 1}^{n} p_{i} } \log p_{i}\) to represent information entropy, which represents a measure of the uncertainty of random experiment X. Among them, \(p_{i}\) represents the probability of a random event, and K is a constant greater than zero.
Entropy method is based on objective index values. Compared with AHP, its advantage lies in the subjective judgment of the decision-making basis of AHP. Therefore, the entropy weight-ideal point method is based on objective index data, and its decision-making results are more objective and reliable.
The basic steps and calculation methods of using entropy-TOPSIS for multi-objective decision-making are as follows:
(1) On the basis of clarifying the decision-making problem, the algorithm determines the evaluation index system and calculates the attribute value of the index corresponding to each plan. We assume that there are n alternatives, m control indicators, and the value of the index j corresponding to the i-th option is \(a_{ij}\), thus forming an initial matrix \(A_{m \times n}\) of \(m \times n\).
(2) The algorithm standardizes the indicators in the initial matrix \(E_{m \times n}\), and standardizes the indicators according to the difference between the positive (the larger the value, the better) and the negative (the smaller the value, the better) of the indicator. When the indicator is a positive indicator,
When the indicator is a negative indicator,
After the initial matrix \(A_{m \times n}\) is standardized, the new target matrix \(H_{m \times n}\) is obtained:
(3) The algorithm calculates the entropy \(r_{i}\) of index i according to the target matrix \(H_{m \times n}\):
Among them, k is Boltzmann's constant, and its value is \({1 \mathord{\left/ {\vphantom {1 {Inn}}} \right. \kern-\nulldelimiterspace} {Inn}}\), and \(f_{ij} = \frac{{h_{ij} }}{{\sum {_{j = 1}^{n} h_{ij} } }}\). It can be seen from the above definition of entropy that the smaller the entropy value, the greater the difference between indicators.
(4) The algorithm calculates the entropy weight \(x_{i}\) of index i according to the entropy value.
(5) According to the entropy weight \(x_{i}\) calculated in the previous step, the subjective weight \(y_{i} \left( {i = 1,2, \ldots ,m} \right)\) assigned to each index subjectively by the decision maker based on the objective conditions of the decision-making purpose, project characteristics and other objective conditions. The comprehensive entropy weight \(x_{i}\) and weight \(y_{i}\) obtain the comprehensive weight \(c_{i}\) of index i.
According to the analysis of multi-objective decision-making related theories, the multi-objective decision-making process of sports events includes clarification of problems, system analysis, establishment of index systems, formulation of alternatives, program selection, decision implementation, and real-time control and adjustment, as shown in Fig. 5.

Multi-objective decision-making process of sports events
The detailed process of multi-objective decision-making for sports events is as follows:
-
(1)
The model first clarifies the issues that require decision-making, such as price selection or franchise period selection.
-
(2)
On the basis of determining the specific issues that require decision-making, the model regards the researched issues as a system, analyzes the system structure, identifies the system goals and analyzes the influencing factors of the goals.
-
(3)
The model analyzes the overall goals, subsystem goals, and various objective functions of the system and establishes a decision-making index system on this basis.
-
(4)
According to the characteristics and actual conditions of the decision-making problem, the model draws up preliminary alternatives.
-
(5)
The model conducts preliminary screening of schemes according to the attribute values of each index in the scheme index system, and eliminates schemes whose indexes obviously do not meet the requirements, and forms alternative schemes.
-
(6)
The model uses entropy weight-TOPSIS to make multi-objective decision-making for the alternatives, selects the final plan, and implements the plan.
-
(7)
PPP projects have a long cooperation period and there are many uncertain factors. Therefore, real-time control and adjustment are required during the implementation process.
6 Model performance analysis
This research model is mainly divided into two parts: the economic decision-making of sports events and the decision-making of athletes in sports scene. First, this paper analyzes the performance of the economic decision-making part of sports events. The relationship between the government, social capital, and the public in the price selection of sports items can be described as Fig. 6. Among them, A represents the price preference attitude of social capital, B represents the government's price neutral attitude, C represents the public's price aversion attitude, and D represents the reasonable price range satisfied by all three parties.

Price relationship diagram of decision-making entities
This paper uses the ticket prices of the tourist attractions around the National Stadium as a reference and uses the actual prices of the tickets to visit the National Stadium as the basis to propose 6 preliminary proposals, as shown in Table 1 and Fig. 7.

Statistical diagram of preliminary proposal for price selection
Based on the financial analysis of the project, this paper calculates the objective function and index value of the government, social capital (CITIC Consortium), and the public. The results are shown in Table 2 and Figs. 8, 9 and 10 below.

Leverage factor

Present value of capital

Quality-price ratio
Judging from the calculation results of the attribute values of the above indicators, the index values of the six preliminary schemes are all within a reasonable range, so there is no need to eliminate any schemes in the preliminary screening, and all six schemes are included in the alternative scheme. From the perspective of changes in attribute values, from Plan A to Plan F, with the increase in ticket prices, the operating and financial risks that social capital pays attention to decrease, and the rate of return for social capital increases. At the same time, the net present value of the economic benefit index item that the government is concerned about has increased, but the life-time value of the social benefit index has gradually decreased. In addition, the public satisfaction index represented by the satisfaction of quality at a certain price, which is an indicator of public concern, decreases. It can be seen that as the price increases, public satisfaction decreases with the same quality. The above results are consistent with the actual situation, so it proves that the model in this paper has a certain effect in the analysis of sports events.
Next, this paper analyzes the decision-making situation of this research model in sports athletes' behavior. This study constructs a total of 100 athletes' sports action response strategies in emergency situations, and scores the decision-making behaviors made by machines. The decision-making system of this paper is based on the combined model of data mining and neural network. Therefore, the combined model of this paper is compared with the data mining and neural network model. The results are shown in Table 3 and Fig. 11.

Statistical diagram of the results of sports decision-makin
From Table 3 and Fig. 11, we can see that the accuracy of the combined model's motion decision-making in this paper has obvious advantages compared with the single model. The accuracy of the combined model's motion decision-making is mostly above 90%, which can meet actual needs.
Next, this paper studies the decision-making effect of the model in sports training strategies and rehabilitation training. This paper sets up 60 sets of data for research, and scores these decisions with experts. Similarly, the combined model constructed in this paper is compared with data mining and neural network models, and the results are shown in Table 4 and Fig. 12.

Statistical diagram of training strategy score
It can be seen from Table 4 and Fig. 12 that the performance of the model constructed in this paper is good, and the training strategy scores are basically distributed between [80,90]. However, the scoring results of a single decision model have large fluctuations, and the highest score does not exceed 80 points. Therefore, the performance of the combined model constructed in this paper is good.
7 Conclusion
Decisions in competitive sports often face time constraints from both rules and opponent pressure, which force decision makers to make decisions within a certain time frame. Therefore, time pressure has become an important factor that athletes have to face when making decisions. The multi-objective decision-making system for sports events is a complex system composed of three parts: system boundary, system environment and system elements. Among them, the system elements include partnership system, project composition system and sports decision-making system. Moreover, this system has the characteristics of target diversity and dynamics. In addition, the sports decision-making system itself is a complex system, and its decision-making should proceed from the perspective of the system, and comprehensively consider the influence of the human, event, and material elements in the system on the decision. The sports decision-making system implemented in this paper fully caters to the requirements of improving the sports quality of college students, and it also changes the artificial decision-making mode of the sports decision-making system. Moreover, the use of neural network for verification can improve the accuracy, rationality and efficiency of decision-making, and can give students personalized training and diagnostic programs, so that students can exercise targeted and scientifically improve their physical fitness.
References
Keating XD (2017) Research on preservice physical education teachers’ and preservice elementary teachers’ physical education identities: a systematic review. J Teach Phys Educ 36(2):1–29
Yli-Piipari S (2014) Physical education curriculum reform in Finland. Quest Ill Natl Assoc Phys Educ Higher Educ 66(4):468–484
Landi D, Fitzpatrick K, Mcglashan H (2016) Models based practices in physical education: a sociocritical reflection. J Teach Phys Educ 35(4):400–411
Erfle SE, Gamble A (2015) Effects of daily physical education on physical fitness and weight status in middle school adolescents. J Sch Health 85(1):27–35
Cheon SH, Reeve J, Yu TH et al (2014) The teacher benefits from giving autonomy support during physical education instruction. J Sport Exerc Psychol 36(4):331–346
Bendiksen M, Williams CA, Hornstrup T et al (2014) Heart rate response and fitness effects of various types of physical education for 8- to 9-year-old schoolchildren. Eur J Sport Sci 14(8):861–869
Hollis JL, Williams AJ, Sutherland R et al (2015) A systematic review and meta-analysis of moderate-to-vigorous physical activity levels in elementary school physical education lessons. Prev Med 86(1):34–54
Wang JCK, Morin AJS, Ryan RM et al (2016) Students’ motivational profiles in the physical education context. J Sport Exerc Psychol 38(6):612–630
Fletcher T, Casey A (2014) The challenges of models-based practice in physical education teacher education: a collaborative self-study. J Teach Phys Educ 33(3):403–421
Oudah A (2014) The nature of personal characteristics of the teaching faculties of physical education in the southern region from the view of their students. Phys D-Nonlinear Phenom 26(1–3):181–192
Aelterman N, Vansteenkiste M, Lynn VDB et al (2014) Fostering a need-supportive teaching style: intervention effects on physical education teachers’ beliefs and teaching behaviors. J Sport Exerc Psychol 36(6):595–609
Goossens L, Verrelst R, Cardon G et al (2014) Sports injuries in physical education teacher education students. Scand J Med Sci Sports 24(4):683–691
Lander N, Eather N, Morgan PJ et al (2017) Characteristics of teacher training in school-based physical education interventions to improve fundamental movement skills and/or physical activity: a systematic review. Sports Med 47(1):135–161
Sun H, Li W, Shen B (2017) Learning in physical education: a self-determination theory perspective. J Teach Phys Educ 36(3):277–291
Lewis K (2014) Pupils’ and teachers’ experiences of school-based physical education: a qualitative study. Bmj Open 4(9):e005277–e005277
Viciana J, Mayorga-Vega D (2016) Innovative teaching units applied to physical education—Changing the curriculum management for authentic outcomes. Kinesiology 48(1):142–152
Scrabis-Fletcher K, Rasmussen J, Silverman S (2016) The relationship of practice, attitude, and perception of competence in middle school physical education. J Teach Phys Educ 35(3):241–250
Hastie PA, Wallhead T (2016) Models-based practice in physical education: the case for sport education. J Teach Phys Educ 35(4):390–399
Glazier PS, Mehdizadeh S (2019) Challenging conventional paradigms in applied sports biomechanics research. Sports Med 49(2):171–176
Mullen T, Highton J, Twist C (2015) The internal and external responses to a forward-specific rugby league simulation protocol performed with and without physical contact. Int J Sports Physiol Perform 10(6):746–753
Appelbaum LG, Erickson G (2018) Sports vision training: a review of the state-of-the-art in digital training techniques. Int Rev Sport Exerc Psychol 11(1):160–189
Rein R, Memmert D (2016) Big data and tactical analysis in elite soccer: future challenges and opportunities for sports science. SpringerPlus 5(1):1–13
Ridderinkhof KR, Brass M (2015) How kinesthetic motor imagery works: a predictive-processing theory of visualization in sports and motor expertise. J Physiol Paris 109(1–3):53–63
Mulligan D, Lohse KR, Hodges NJ (2016) An action-incongruent secondary task modulates prediction accuracy in experienced performers: evidence for motor simulation. Psychol Res 80(4):496–509
Tivener KA, Gloe DS (2015) The effect of high-fidelity cardiopulmonary resuscitation (CPR) simulation on athletic training student knowledge, confidence, emotions, and experiences. Athl Train Educ J 10(2):103–112
Ivashchenko OV, Kapkan OO (2015) Simulation of process of 14–15 years old girls’ training of light athletic and gymnastic exercises. Pedagog Psychol Med Biol Probl Phys Train Sports 8:32–40
Acknowledgements
This research was supported by National Social Science Fund of China (Grant Number17CTY005).
Author information
Authors and Affiliations
Corresponding author
Ethics declarations
Conflict of interest
The authors declared that they have no conflicts of interest to this work. We declare that we do not have any commercial or associative interest that represents a conflict of interest in connection with the work submitted.
Additional information
Publisher's Note
Springer Nature remains neutral with regard to jurisdictional claims in published maps and institutional affiliations.
Rights and permissions
About this article

Cite this article
Yuan, C., Yang, Y. & Liu, Y. Sports decision-making model based on data mining and neural network. Neural Comput & Applic 33, 3911–3924 (2021). https://doi.org/10.1007/s00521-020-05445-x
Received:
Accepted:
Published:
Issue Date:
DOI: https://doi.org/10.1007/s00521-020-05445-x