
Abstract
Purpose
Our purpose was to explore pupil light response (PLR) with respect to the change in sensitivity of photoreceptors during various dark adaptation phases and to determine the optimal duration of dark adaptation time before the PLR.
Methods
The PLR was recorded in 15 healthy subjects and three patients with neural or retinal vision loss after 1-sec blue and red light stimuli of 1, 10, and 100 cd/m2. The PLR was repeated nine times at different checkpoints during the 40-minute dark adaptation. The transient contraction amplitude, sustained contraction amplitude, and relative sustained contraction ratio of the PLR were analyzed.
Results
The increase in the transient contraction amplitude during the entire dark adaptation process was significant (changing up to 45.1 %) in the initial phase of dark adaptation under different stimulus conditions. The changes in the sustained contraction amplitude and the relative sustained contraction ratio were substantial (changing up to 71.0 % and 37.2 % from 1 to 20 minutes of dark adaptation, respectively) under high-intensity blue illumination. The inflection point of the contraction curves in the dark adaptation was 15 or 20 minutes. The patients’ PLR results changed in a similar manner.
Conclusions
The changes in the sensitivity of different photoreceptors occurred at different rates, and the contraction amplitude of the PLR was significantly affected by the dark adaptation duration. So 20 minutes of dark adaptation before PLR testing was suggested to achieve a consistent and stable pupil response. The dark adaptation effect should be put into consideration when comparing the results from different phases of the PLR test.
Introduction
The pupil movement in the pupil light reflex is affected by the intensity, wavelength, and duration of the illumination [1]. The rod, cone, and intrinsically photosensitive retinal ganglion cell (ipRGC) photoreceptors and their reflex pathways, known as non-image functions, are involved in this process [2–4]. Many stimulus protocols have been established and demonstrated to be effective for inducing separate PLR and detecting various retinal diseases [5–7]. Because of the advantages of noninvasion, objectivity, and quantitation of the PLR test, it can give clinicians much information about the visual function, nerve system, and psychological states in a convenient and efficient way [8, 9]. So it has been used in the fields of ophthalmology, neurology, pharmacology, and psychology, etc. [10, 11]. Kardon established a stimulus protocol of PLR and detected the obvious change and evaluated the visual function in RP patients [12]. Lorenz used another stimulus protocol of PLR by dissecting three different light-sensitive retinal cell populations with RPE65 deficiency [5]. Even the subclinical autonomic neuropathy of diabetes could be detected using PLR in the early stage [13]. Besides, the autonomic nerve system function was correlated with pupillary movement, and the complication could be predicted by the PLR in the long run studies [14, 15]. The PLR is a promising technique in clinical use because of its advantages of noninvasion, objectivity, and informativity.
Due to the physiological characteristics of the PLR, the test is usually performed in the dark [16]. A period of dark-adaptation is required before the test [17]. However, little attention has been paid to the changes in the photoreceptor sensitivity of the dark adaptation and the effect of dark adaptation duration on the PLR. Previous studies that used PLR as a tool did not include a universal standard for the dark adaptation duration, which has a large range from 10 seconds to 30 minutes [5, 8, 16, 18–21]. It has been proven that the sensitivities of the rods and cones vary widely when exposed to darkness or illumination [22–24]. It has also been demonstrated that the sensitivity of ipRGCs changes under different light adaptation or dark adaptation conditions [25]. However, there has been little study of the effect of photoreceptor sensitivity on the PLR during the dark adaptation process. In practical use, the PLR usually includes a series of stimuli. Without enough dark adaptation time, before the sensitivity of the photoreceptor reaches a stable status, the results in different courses of the test would mingle some to confusing effect. So the effect of dark adaption time on the PLR needs to be studied.
In this study, we used specific stimuli to activate different photosensitive cells and investigated the PLR dominated by one of these stimuli during the dark adaptation process. The PLR was repeatedly recorded in different phases. We found that the photoreceptor sensitivity changed and affected the PLR based on different dark adaptation duration. The changes in the PLR dominated by rods, cones, or ipRGCs reflected their unique characteristics during the adaptation. Eventually, an optimal dark adaptation duration point was selected for the PLR test based on the results.
Methods
Subjects
A total of 15 healthy subjects without histories of ocular disease that affected pupillary movement were tested. All of the subjects exhibited normal ophthalmologic examinations. The exclusion criterion was a lack of ability to control blinking during light flashes. Informed consent was obtained from all the subjects after a sufficient explanation of the test procedure and the possible consequences of the study. The experimental protocols complied with the tenets of the Declaration of Helsinki and were approved by the institutional human experimentation committee.
Light stimulus
A full-field color Ganzfeld (Gotec, Gotec LLC, Chongqing, China) was chosen because the wide distribution of ipRGCs and rods throughout the retina produces spatial summation over the entire retina [6, 26]. The wavelengths of the illumination were 620 ± 10 nm (red) and 465 ± 10 nm (blue). The illumination intensity was calibrated before the test.
Stimulus protocol
As previously reported, stimuli with different wavelengths and intensities can activate transient or sustained contraction mediated by rods, cones, and ipRGCs [6]. In our protocol, we modified a previously published protocol [6]. The duration of 13 seconds was reduced to 1 second to minimize the discomfort experienced by our participant, and to decrease the difficulties in measurement because of excessive blinking [5]. Three intensities of blue or red stimuli of 1 second, low, medium, and high (1, 10, and 100 cd/m2, respectively), as one circle, were applied to the tested eye from low to high intensity to relieve the subject’s discomfort. An approximately 20-second interval between two stimuli was established to allow the pupil to return to baseline size. The total testing time for one circle (including the 1, 10, and 100 cd/m2 stimuli) lasted approximately 1 minute. To minimize the discomfort induced by the light stimulus and the disturbance on the dark adaptation, the test was arranged on two separate days for the red and blue stimuli, respectively. All of the experiments were completed in the dark at a similar time of the day.
The stimulus protocol was as follows. Each test began with a 10-minute 30 cd/m2 white illumination as referred to by the international society for clinical electrophysiology of vision (ISCEV) standard for bright adaptation [27], which was mainly used to standardize the environmental illumination before the dark adaptation. We did not use total bleaching because none of the patients would be totally bleached before the PLR test. This was closer to practical use. In the following 40-minute dark adaptation, nine stimulus circles in total were presented at the checkpoints (1, 5, 10, 15, 20, 25, 30, 35, and 40 min of the dark adaptation).
Recording and analysis
The untested eye was occluded with an opaque eye patch, whereas the tested eye was simultaneously stimulated and monitored. The camera (850 nm, 470 lines, Sony, Japan) was installed in the Ganzfeld and recorded the movement of the pupil. The recording lasted from 3 seconds before the stimulus to 15 seconds after the stimulus. In the first 3 seconds, the baseline pupil size was acquired and marked as 100 %. All of the resultant pupil sizes were divided by the baseline pupil size, and the values are expressed as percentages, which could eliminate individual variations of initial pupil size [6].
The following three parameters were calculated: (1) the transient contraction was defined as the maximal contraction amplitude (the proportion of the baseline pupil size) that occurred within 300–600 ms after the onset of stimulus; and (2) the sustained contraction amplitude was defined as the contraction amplitude (proportion of the baseline pupil size) in the 6th second after the offset of the stimulus, when the post illumination pupil response (PIPR) mediated by the ipRGCs was most clearly observed [7, 21, 22], and (3) relative sustained contraction was defined as the “(transient contraction – sustained contraction)/ transient contraction.” This calculation eliminates the effect of different transient contraction amplitudes, which affect the dilation or sustained contraction.
SPSS 16.0 (SPSS Inc., Chicago, IL) was used for the statistical analysis.
Results
The transient contraction amplitude increased with the intensity scale as expected. The amplitudes in response to the blue stimulus were always larger than those to the red stimulus of matched intensity (Fig. 1). As the duration of dark adaptation increased, the contraction amplitude increased significantly, exhibiting a rapid increase that gradually slowed with increasing dark adaptation duration. However, the change in the rate of increase varied under different stimulus conditions (Fig. 1). We analyzed the transient contraction amplitude of the different checkpoints to determine the inflection point. The 15-minute timepoint of dark adaptation was selected as the inflection point at which the transient contraction amplitude significantly differed from the previous one but did not significantly differ from the subsequent one. The results of different checkpoints were analyzed with repeated measure MANOVA, and the LSD-t test was employed to analyze the checkpoint results to estimate the turning points of the contraction curve during dark adaptation. The data below was analyzed with the same method to estimate the inflection point.

Transient contraction amplitude change during the dark adaptation process. The increasing trend was most obvious under low-intensity stimuli, especially under low-blue intensity. The higher the intensity was, the smaller was the difference value of transient contraction amplitude between matched blue and red illumination . As the intensity increased, the rate of increase slowed and the curve flattened, converging to a steady state in the late stage under all the stimulus conditions (P < 0.0001, <0.001, = 0.049 under low-, medium- and high-intensity red stimuli, respectively; P < 0.0001, <0.0001, = 0.003 under low-, medium- and high-intensity blue stimuli, respectively). The timepoint of 15 minutes was selected as the inflection point. The increment from 1 min to 15 min was 45.1 %, 16.6 %, 5.6 % in blue and 36.7 %, 9.7 %, 3.1 % in red under low-, median-, and high-intensity illumination, respectively. Standard deviation were shown with error bars
A sustained contraction amplitude was clearly observed only in response to high-intensity blue stimulus (Figs. 2c and 3). In the medium-intensity blue condition, the sustained contraction amplitude was not as obvious as that of the high-intensity blue condition but was more obvious than that of the low-intensity condition (Figs. 2 and 3). No obvious sustained contraction was observed in response to any intensities of the red stimulus. The changes in the amplitude in response to all the red stimului were small, and the curves were flat (Fig. 2). The relative sustained contraction ratio was high and did not change much, either (Fig. 3). Pupil escape of different extents was observed in all conditions except for the high blue condition. The sustained contraction amplitude increased significantly with increasing duration of dark adaptation, especially in the initial phase of dark adaptation.

Sustained contraction amplitude change during the dark adaptation process. The contraction amplitude at the 6 seconds after the offset of stimulus (sustained contraction) was used as the marker of PIPR. As the intensity increased, the difference value of sustained contraction amplitude between matched red and blue illumination became larger and larger. Obvious PIRP was observed as the intensity of blue illumination increased. The incremental trend was most obvious under the high-intensity blue stimulus (C), whereas no change was observed under red illumination (P = 0.510, 0.576, and 0.503 under low-, medium- and high-intensity red stimuli, respectively; P < 0.0001 under all three blue stimulus intensities). The 20-minute timepoint for dark adaptation was selected as the inflection point with the same method described above. The increment from 1 min to 20 min was 121.3 %, 61.9 %, and 71.0 % in blue and 40.0 %, 12.3 %, and 9.0 % in red under low-, median-, and high-intensity illumination, respectively. Standard deviations are shown with error bars

The change in the relative sustained contraction ratio under various stimuli. An obvious trend was observed in response to the high-intensity blue stimulus only, and a small one to the medium-intensity blue stimuli, but not so robust under the low-intensity blue stimuli (P = 0.014, <0.001, and <0.0001 under low-, medium- and high-intensity blue stimuli, respectively). No change was observed in response to any of the red stimuli (P = 0.667, 0.810, and 0.473 under low-, medium- and high-intensity red stimuli, respectively). Standard deviations are shown with error bars
Different transient amplitudes affected sequential dilation or sustained contraction. The transient and sustained contraction amplitude were both higher and higher as the illumination intensity increased (Fig. 2). The correlation between the transient and sustained contraction amplitude was significant both in the red and blue stimulus conditions (r = 0.662, P < 0.0001; r = 0.599, P < 0.0001, respectively). Therefore, we measured PIPR by the following ratio except for the sustained contraction amplitude: (transient contraction amplitude – sustained contraction amplitude)/transient contraction amplitude. Higher ratios reflected increased pupil escape. This ratio, the relative sustained contraction ratio, may reflect the PIPR without the consideration of transient contraction and indicates the participation of the ipRGCs.
To confirm and better understand the changing tendency of different photoreceptors under pathological conditions, we tested the PLR in patients with photoreceptor dysfunction using the same protocol.
-
Patient 1
A 59-year-old woman was diagnosed with a macular hole of the left eye and presented with a one-month history of blurred vision. Examination revealed acuity of 3/20 and an eye pressure of 13 mmHg. An obvious macular hole was observed in the left eye on optical coherence tomography (OCT), and the electrophysiological examination revealed macular dysfunction. The patient’s PLR result also revealed an increasing trend according to the transient contraction amplitude in response to all of the stimuli (Fig. 4). However, unlike the normal response, the changing range of the transient amplitude curve was small, especially in response to the high red stimuli (Fig. 4c). The change curve of transient and sustained contraction attained a steady status after about 20-minute dark adaptation. The transient contraction deviated from the normal further and further as the intensities of illumination increased both in red and blue illumination (Fig. 4). This is probably because the cone dysfunction affected the transient contraction more obviously under brighter illumination, which was mainly dominated by cones . The sustained contraction was also reduced probably due to less input from the dysfunctional cone.
Fig. 4 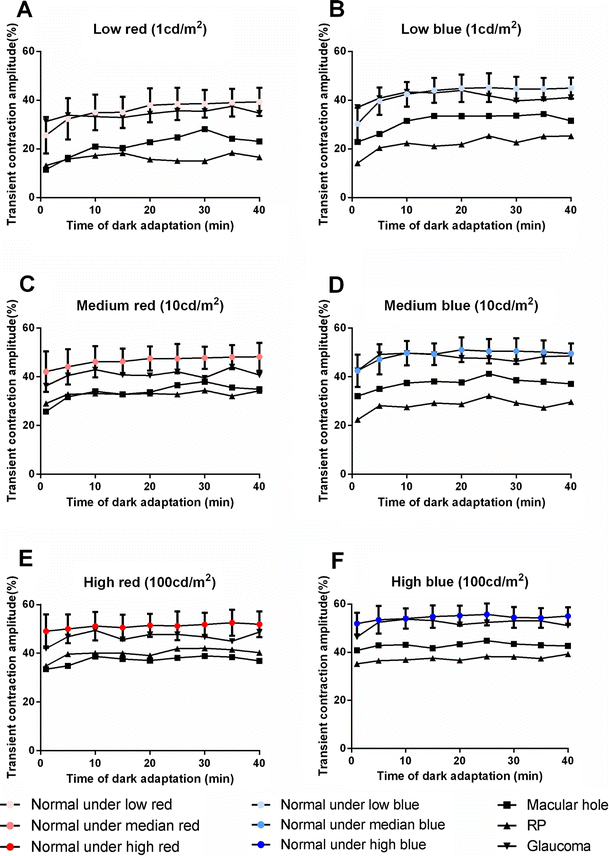
Transient contraction amplitude change during the dark adaptation, patients vs normal. The macular hole decreased most of the responses to the high-intensity red stimulus. Retinal pigmentosa decreased most of the responses to the blue stimuli of different intensities, especially the low-intensity blue stimulus. Though glaucoma seemed not to decrease any of the responses, the amplitude was close to the bottom of the error bars. The transient contraction amplitude reached to a relatively steady value at about 20 minutes of dark adaptation. The patients’ changing curves share similar trends with the normal, though the amplitude was much smaller. Standard deviations are shown with error bars
-
Patient 2
A 45-year-old female was diagnosed with retinal pigmentosa and had a history of reduced visual acuity in the dark since her twenties. Visual acuity of the morbid eye was 12/20. Perimetry revealed a defect of the peripheral visual field. The electroretinogram showed decreased function of the outer layer of the retina and a largely reduced Arden ratio compared with normal values. Based on her PLR result, there was still some change of the trend in the process of dark adaptation. However, the changing range was much smaller than that of the normal subjects, especially in response to the low-intensity blue stimulus (Fig. 4a), consistent with the loss of rod function. The sustained contraction amplitude was much smaller than the normal under blue illumination (Fig. 5), probably because of the reduced rod signaling [5, 28]. The trend achieved a relatively steady state at 15 minutes, with less change of range, probably because of the dysfunction of rod and limited photosensitivity.
Fig. 5 
Sustained contraction amplitude change during the dark adaptation, patients vs normal. The glaucoma’s sustained contraction amplitude did not obviously increase with the intensity and dark adaptation , especially under high-intensity blue stimulus, which made the curve flat compared with the normal and other patients. Although the macular hole and retinal pigmentosa decreased the responses to all of the stimuli, there were no special changes in response to any specific stimuli. Under the median- and high-intensity blue stimuli, the changing rate of different patients differed a great amount. The sustained contraction amplitude of patients reached a steady plateau at about 20 minutes of dark adaptation. Standard deviations are shown with error bars
-
Patient 3
A 42-year-old man was diagnosed with glaucoma. His visual acuity was 20/20, and his eye pressure was 24 mmHg, with a C/D ratio of OD 0.9. Ultrasound revealed excavation of the optic disk. Ultrasound biomicroscopy (UBM) showed that the chamber angle was open. The electrophysiological examination revealed an abnormality of the visual conducting pathway in visual evoked potentials (VEP) and reduced retinal function on the electroretinography (ERG).The transient and sustained contraction amplitude of PLR results are presented in Figs. 4 and 5. The patient’s PLR result revealed an increasing trend of transient contraction amplitude. The trend achieved a relatively steady state after 15 minutes based on the amplitude curves (Fig. 4). Though the transient contraction amplitude is in the normal range, it was close to the bottom of the range. Another obvious difference from the normal was the reduced sustained contraction probably due to the dysfunction of RGC, especially under the high-intensity stimulus condition (Fig. 5). The changing trend of the sustained contraction in glaucoma was not obvious as the normal, which turned out to be a relatively flat curve. That is to say, the sustained contraction did not increase with the dark adaptation.


Discussion
The work presented here used chromatic stimuli to evoke the PLR mediated by rods, cones, and ipRGCs to reveal the sensitivity of these photoreceptors and their effect on the PLR during the process of dark adaptation. The sensitivity of the cones, rods, and ipRGCs changed at different rates, and the PLR mediated by these cells was affected to different degrees. The difference between chronological phases of dark adaptation suggested that 20 minutes of dark adaptation should be proper before the test to obtain consistent and stable PLR results. Also, the results demonstrated that the sensitivity of the ipRGCs was vulnerable during the light exposure and exhibited slow recovery during the dark adaptation.
According to a previous study on the specific stimulus condition and the corresponding activated photoreceptors, the activation of ipRGC could be judged by an obvious PIPR. The difference of the transient contraction amplitude between intensity-matched red and blue stimulus could show the relative activation of cone and rod. Under the high-intensity (100 cd/m2) blue condition, the PLR was mostly activated by cones and ipRGCs [6, 29, 30]. Under the high-intensity (100 cd/m2) red condition, the PLR was mostly activated by the cone cells [5, 6]. Under the low-intensity (1 cd/m2) blue condition, rods had more domination, though some cones were involved [31]. Under the low-intensity (1 cd/m2) red illumination, the PLR was probably dominated by cones. Under the medium-intensity stimuli (red 10 cd/m2 and blue 10 cd/m2), the PLR was likely activated by a mixture of rods, cones and ipRGC. Due to the differentiated sensitivity recovery of different photoreceptors, the contraction amplitude changed in varieties of velocities and ranges in the process of dark adaption (Figs. 2 and 3). Because of the sensitive spectrum and sensitive intensity range of different photoreceptors, the illumination with specific combinations of wavelength and intensity could induce pupil responses driven by different photoreceptors. So the PLR of patients with different damaged visual functions behaved separately in specific stimulus conditions.
The changing trend in the contraction differed under different stimulus conditions, especially between the first and the second half of the adaptation. These changing tendencies in transient and sustained contraction suggested the sensitivity of the rod, cone, and ipRGC recovered gradually during dark adaptation [32, 33]. Because of the sensitivity of different photoreceptors, they changing in varieties of velocities and ranges. So the transient contraction amplitude driven by cone changed fast, which appeared to be a relatively flat curve during the process of dark adaption (Fig. 1c) [34]. The transient contraction amplitude driven by rods increased in a large range gradually probably because the sensitivity of rods increased slowly (Fig. 1a) [35]. So the curve of high-intensity red stimulus tend to be more flat and changed in a smaller range than that of the low-intensity blue. The reflection points of the transient contraction curve during the dark adaption was 15 minutes, not so fast as for the cones, which was consistent with the slow changes of the sensitivity of rods [35]. The sustained contraction amplitude changed slowly probably reflecting the slow recovery of ipRGC sensitivity (Fig. 2c), which was consistent with the sensitivity of the ipRGCs reported in other studies and the vulnerability of melanopsin. Wong previously demonstrated that the sensitivity of ipRGCs was reduced in bright light and recovered progressively with increasing dark adaptation based on electrophysiological results [25]. The significant separation between red and blue high-intensity-light sustained contraction amplitude was due to whether the ipRGC was involved or not. The relative sustained contraction showed the PIPR obviously, which was the activation of ipRGC (Fig. 3), and the reflection point of 20 minutes in the sustained contraction curve was consistent with the report on slow recovery of ipRGC sensitivity [25].
The trend changed at various rates after different periods of adaptation, indicating that the dark adaptation of the PLR should be standardized such that PLR values in different tests using identical stimuli can be compared. According to the curves, longer periods of dark adaptation were correlated with more consistent and stable PLR results. Therefore, an appropriate dark adaptation time should be established based on the stability, accuracy, and efficiency of PLR measurements. This was because the inflection timepoint in transient and sustained contraction curves of the dark adaptation was 15 and 20 minutes, respectively. But in practical use, the transient and sustained contraction were usually evaluated together. Though the optimal timepoints for the PLR test differed under different stimuli, 20 minutes was sufficient for all of the curves to reach to a relatively steady state under different illumination.
In the normal, the inflection point was 15–20 minutes. While in the patients with photoreceptor disfunction, the contraction amplitude curves during the whole dark adaption had the similar trend as the normal, though the values was much smaller than the normals. Most of curves in the patients reached a relative plateau around 15–20 minutes in the dark adaption, which was consistent with the changes in the normal.
In a previous study, Kardon demonstrated in detail that a series of stimuli of 13 seconds could be used to test different photosensitive cells in PLR [6]. With a similar stimuli, we evoked the PLR mediated by rods, cones, and ipRGCs or the mixture of them and revealed the changing tendency of the PLR during the process of dark adaptation under these stimulus conditions. However, it should be noted that no PLR was mediated by purely one type of photoreceptor. There is always some participation from other photoreceptors, although a single kind of specific photoreceptor tends to dominate a PLR-induced specific stimulus.
In the test, the dark adaptation is likely to be disrupted by intermittent stimuli. In consideration of this problem, we used an interval of 20 seconds between the two stimuli to make the pupil recover to the baseline pupil size, which could minimize the effect of the previous stimulus. This approach is also a common measure to solving this problem in many other PLR studies involving continuous light exposure [5, 7]. In a published study [21], the adjacent PLRs were almost the same even when a less than one second interval was inserted between two identical stimuli. It indicated that the effect of previous stimulus on dark adaptation could be small if the illumination duration was short. Another previous study used only an 8-second interval, which did not exhibit any effect on the adjacent stimulus results, either [8]. In our study, the analysis of the initial pupil sizes of different timepoints revealed no significant difference between all timepoints (P > 0.1 in all stimulus conditions).
It may be argued that the short dark adaptation duration, usually 10 minutes, did not differ too much from results with a 20-minute adaptation [7]. But both in the curves of transient and sustained contraction amplitude, the difference between results of 10 and 20 minutes still had statistical significance. Especially under the high blue illumination, the sustained contraction increased by 14.1 % from 10 minutes to 20 minutes. Under other illumination, the transient and sustained contraction amplitude increased by different extents from 10 minutes to 20 minutes .
In the testing protocol, the interval between these testing timepoints were somewhat wide (4 or 5 minutes), and some small details may not be revealed at these timepoints. This may be especially in the initial period of dark adaptation, during which the tendency changed quickly due to the fast recovery of some photosensitive cells sensitivity. The pupil requires some time to recover and some changes in sensitivity will occur in the fast recovery even in one recording. For another reason, it was difficult to record the PLR at the very beginning of the dark adaptation because it needed some time for the pupil to the dilated to the stable baseline when the environment illumination turned to darkness. Therefore, a compromise between more extensive testing and the physiological characteristics of the pupil light reflex was required. We choose 1 minute as the first checkpoint.
The protocol, 1,10,100 cd/m2 of 1-sec duration, did not follow the published protocol [6] with the same intensity but a longer duration. We modified the duration of 13 seconds to 1 seconds. That was because the long duration of stimuli may affect the dark adaptation a great deal. As to another published protocol [5] with a short-duration stimulus but long-duration background illumination, we did not follow it in consideration of the same reason. For another reason, in Kardon’s study, there was a distance of 75 mm from the front of the eye to the opening of the Ganzfeld bowl, and the horizontal radius of the viewing angle was 45 degrees [6],while in our study, the viewing angle was full field. Lei’s study [1] demonstrated that the PIPR would increase with the intensity, duration, and viewing angle. A full field stimulus with short duration could induce a similar PIPR as a small viewing angle stimulus with long duration. Park’s study [26] also proved the spatial summation effect in rods and RGC caused by different viewing angles of the stimulus. So we modified the Kardon’s protocol to be the same intensities with a shorter duration but full field stimuli. Our results of transient contraction amplitude at the same dark adaptation level seemed to be consistent with Kardon’s [6], though the duration of stimuli was different from each other.
The results demonstrated that the dark adaptation process of patients were different from the normal, both in the changing range and the absolute value of the curve. But they also reached to a relatively steady status at about 15–20 minutes of dark adaptation. In practical use, the PLR results of some patients would be unclear without a dark adaptation of an appropriate duration. Without substantial dark adaptation time, the results from different phases of the test would mingle with some dark-adaptation time effect because of photoreceptor sensitivity was still changing during the process of dark adaptation. In patients with photoreceptive diseases, whose photoreceptive function were damaged, the remaining function could not drive effective and saturated PLR without enough dark adaption time. Therefore, it was necessary to go through enough time of dark adaptation in order to obtain consistent and pure PLR results. With enough dark adaption time before the PLR test, the sensitivity of photoreceptors could reach a stable state. The PLR would be saturately driven by fully sensitive photoreceptors. With an identical dark adaption standard, the results of PLR would be compared. The time effect of dark adaption could be standardized with the same and sufficient dark adaption preparation.
Although much has been known about the dark adaptation of rod and cone cells, their activities in patients’ PLR during the course of dark adaptation have not been investigated. The participation of ipRGC and the change of melanopsin during the adaption complicated the PLR. More specific and further study on this topic is needed. This is because the dark adaptation was an inevitable preparation before the PLR test.
In summary, we revealed the effect of the change in the sensitivity of photoreceptors on the PLR results during the course of dark adaption. The PLR induced by different photoreceptors changed by different rates during the dark adaptation. Therefore, 20 minutes of dark adaptation before the PLR test was proposed to obtain consistent and pure results. The dark adaptation effect was suggested to be considered when comparing the results from different phases of the PLR test.
References
Lei SB, Goltz HC, Chandrakumar M, Wong AMF (2014) Full-field Chromatic Pupillometry for the Assessment of the Postillumination Pupil Response Driven by Melanopsin-Containing Retinal Ganglion Cells. Invest Ophthalmol Vis Sci 55:4496–4503. doi:10.1167/iovs.14-14103
McDougal DH, Gamlin PD (2010) The influence of intrinsically-photosensitive retinal ganglion cells on the spectral sensitivity and response dynamics of the human pupillary light reflex. Vision Res 50:72–87. doi:10.1016/j.visres.2009.10.012
Tsujimura S, Ukai K, Ohama D, Nuruki A, Yunokuchi K (2010) Contribution of human melanopsin retinal ganglion cells to steady-state pupil responses. Proc Royal Soc B-Biol Sci 277:2485–2492. doi:10.1098/rspb.2010.0330
Guler AD, Ecker JL, Lall GS, Haq S, Altimus CM, Liao HW, Barnard AR, Cahill H, Badea TC, Zhao H, Hankins MW, Berson DM, Lucas RJ, Yau KW, Hattar S (2008) Melanopsin cells are the principal conduits for rod-cone input to non-image-forming vision. Nature 453:102–105. doi:10.1038/nature06829
Lorenz B, Strohmayr E, Zahn S, Friedburg C, Kramer M, Preising M, Stieger K (2012) Chromatic pupillometry dissects function of the three different light-sensitive retinal cell populations in RPE65 deficiency. Invest Ophthalmol Vis Sci 53:5641–5652. doi:10.1167/iovs.12-9974
Kardon R, Anderson SC, Damarjian TG, Grace EM, Stone E, Kawasaki A (2009) Chromatic pupil responses: preferential activation of the melanopsin-mediated versus outer photoreceptor-mediated pupil light reflex. Ophthalmology 116:1564–1573. doi:10.1016/j.ophtha.2009.02.007
Park JC, Moura AL, Raza AS, Rhee DW, Kardon RH, Hood DC (2011) Toward a clinical protocol for assessing rod, cone, and melanopsin contributions to the human pupil response. Invest Ophthalmol Vis Sci 52:6624–6635. doi:10.1167/iovs.11-7586
Bremner FD (2012) Pupillometric evaluation of the dynamics of the pupillary response to a brief light stimulus in healthy subjects. Invest Ophthalmol Vis Sci 4:7343–7347. doi:10.1167/iovs.12-10881
Girkin CA (2003) Evaluation of the pupillary light response as an objective measure of visual function. Ophthalmol Clin N Am 16:143–153
Wilhelm H, Wilhelm B (2003) Clinical Applications of Pupillography. J Neuroophthalmol 23:42–49. doi:10.1097/00041327-200303000-00010
Kjesbu SS, Moksnes K, Klepstad P, Knobel H, Kaasa S, Dale O (2005) Application of pupillometry and pupillary reactions in medical research. Tidsskrift for den Norske laegeforening: tidsskrift for praktisk medicin, ny raekke 125:29–32
Kardon R, Anderson SC, Damarjian TG, Grace EM, Stone E, Kawasaki A (2011) Chromatic pupillometry in patients with retinitis pigmentosa. Ophthalmology 118:376–381. doi:10.1016/j.ophtha.2010.06.033
Karachaliou F, Karavanaki K, Greenwood R, Baum JD (1997) Consistency of pupillary abnormality in children and adolescents with diabetes. Diabet Med 14:849–853. doi:10.1002/(sici)1096-9136(199710)14:10<849::aid-dia470>3.0.co;2-w
Thamotharampillai K, Chan AK, Bennetts B, Craig ME, Cusumano J, Silink M, Oates PJ, Donaghue KC (2006) Decline in neurophysiological function after 7 years in an adolescent diabetic cohort and the role of aldose reductase gene polymorphisms. Diabetes Care 29:2053–2057. doi:10.2337/dc06-0678
Maguire AM, Craig ME, Craighead A, Chan AKF, Cusumano JM, Hing SJ, Silink M, Howard NJ, Donaghue KC (2007) Autonomic nerve testing predicts the development of complications - A 12-year follow-up study. Diabetes Care 30:77–82. doi:10.2337/dc06-0793
Hachol A, Szczepanowska-Nowak W, Kasprzak H, Zawojska I, Dudzinski A, Kinasz R, Wygledowska-Promienska D (2007) Measurement of pupil reactivity using fast pupillometry. Physiol Meas 28:61–72. doi:10.1088/0967-3334/28/1/006
Yu M, Kautz MA, Thomas ML, Johnson D, Hotchkiss ER, Russo MB (2007) Operational implications of varying ambient light levels and time-of-day effects on saccadic velocity and pupillary light reflex. Ophthal Physiol Opt: J Br Coll Ophthalmic Opticians 27:130–141. doi:10.1111/j.1475-1313.2006.00450.x
Bradley JC, Bentley KC, Mughal AI, Bodhireddy H, Young RS, Brown SM (2010) The effect of gender and iris color on the dark-adapted pupil diameter. J Ocul Pharmacol Ther 26:335–340. doi:10.1089/jop.2010.0061
Schnitzler E-M, Baumeister M, Kohnen T (2000) Scotopic measurement of normal pupils: Colvard versus Video Vision Analyzer infrared pupillometer. J Cataract Refract Surg 26:859–866. doi:10.1016/S0886-3350(00)00486-7
Nissen C, Sander B, Lund-Andersen H (2011) The effect of pupil size on stimulation of the melanopsin containing retinal ganglion cells, as evaluated by monochromatic pupillometry. Front Neurol 2:92–96. doi:10.3389/fneur.2011.00092
Fotiou F, Fountoulakis KN, Goulas A, Alexopoulos L, Palikaras A (2000) Automated standardized pupillometry with optical method for purposes of clinical practice and research. Clin Physiol 20:336–347. doi:10.1046/j.1365-2281.2000.00259.x
Wang JS, Kefalov VJ (2011) The Cone-specific visual cycle. Prog Retin Eye Res 30:115–128. doi:10.1016/j.preteyeres.2010.11.001
Nordby K, Stabell B, Stabell U (1984) Dark-adaptation of the human rod system. Vis Res 24:841–849. doi:10.1016/0042-6989(84)90156-1
Lamb TD, Pugh EN Jr (2004) Dark adaptation and the retinoid cycle of vision. Prog Retin Eye Res 23:307–380. doi:10.1016/j.preteyeres.2004.03.001
Wong KY, Dunn FA, Berson DM (2005) Photoreceptor adaptation in intrinsically photosensitive retinal ganglion cells. Neuron 48:1001–1010. doi:10.1016/j.neuron.2005.11.016
Park JC, McAnany JJ (2013) Spatial summation characteristics of the pupillary light reflex differ under rod-, cone- and melanopsin-mediated conditions. J Vis 13:P3. doi:10.1167/13.15.38
Marmor MF, Fulton AB, Holder GE, Miyake Y, Brigell M, Bach M (2009) ISCEV Standard for full-field clinical electroretinography (2008 update). Doc Ophthalmol 118:69–77. doi:10.1007/s10633-008-9155-4
Lall GS, Revell VL, Momiji H, Al Enezi J, Altimus CM, Güler AD, Aguilar C, Cameron MA, Allender S, Hankins MW, Lucas RJ (2010) Distinct Contributions of Rod, Cone, and Melanopsin Photoreceptors to Encoding Irradiance. Neuron 66:417–428. doi:10.1016/j.neuron.2010.04.037
Feigl B, Zele AJ, Fader SM, Howes AN, Hughes CE, Jones KA, Jones R (2012) The post-illumination pupil response of melanopsin-expressing intrinsically photosensitive retinal ganglion cells in diabetes. Acta Ophthalmol (Copenh) 90:e230–e234. doi:10.1111/j.1755-3768.2011.02226.x
Roecklein K, Wong P, Ernecoff N, Miller M, Donofry S, Kamarck M, Wood-Vasey WM, Franzen P (2013) The post illumination pupil response is reduced in seasonal affective disorder. Psychiatry Res 210:150–158. doi:10.1016/j.psychres.2013.05.023
Dacey DM, Liao HW, Peterson BB, Robinson FR, Smith VC, Pokorny J, Yau KW, Gamlin PD (2005) Melanopsin-expressing ganglion cells in primate retina signal colour and irradiance and project to the LGN. Nature 433:749–754. doi:10.1038/nature03387
Dowling JE (1987) The retina: an approachable part of the brain. Harvard University Press
Rodieck RW, Rodieck RW (1998) The first steps in seeing. Sinauer Associates Sunderland, MA
Gaffney AJ, Binns AM, Margrain TH (2012) Aging and cone dark adaptation. Optom Vision Sci: Off Publ Am Acad Optom 89:1219–1224. doi:10.1097/OPX.0b013e318263c6b1
Thomas MM, Lamb TD (1999) Light adaptation and dark adaptation of human rod photoreceptors measured from the a-wave of the electroretinogram. J Physiol 518(Pt 2):479–496. doi:10.1111/j.1469-7793.1999.0479p.x
Conflict of interest statement
We declare that we have no financial and personal relationships with other people or organizations that can inappropriately influence our work; there is no professional or other personal interest of any nature or kind in any product, service, and/or company that could be construed as influencing the position presented in, or the review of, the manuscript .
Author information
Authors and Affiliations
Corresponding author
Rights and permissions
About this article

Cite this article
Wang, B., Shen, C., Zhang, L. et al. Dark adaptation-induced changes in rod, cone and intrinsically photosensitive retinal ganglion cell (ipRGC) sensitivity differentially affect the pupil light response (PLR). Graefes Arch Clin Exp Ophthalmol 253, 1997–2005 (2015). https://doi.org/10.1007/s00417-015-3137-5
Received:
Revised:
Accepted:
Published:
Issue Date:
DOI: https://doi.org/10.1007/s00417-015-3137-5