
Abstract
Residential apartment buildings are widely implemented in Sri Lanka due to rapid urbanization and land scarcity. The confined spaces and controlled ventilation in such apartments could result in adverse health effects, including Sick Building Syndrome (SBS). Because of the usage of chemical products such as incense sticks in such compact spaces for religious activities in South Asia, SBS can occur. This study is one of the first field studies to establish a connotation between the indoor air quality of apartment buildings in Colombo, Sri Lanka, with various chemicals, including incense products and SBS. Measurements were taken from multiple locations in 50 apartments of various indoor environment parameters. Significant Total Volatile Organic Compound (TVOC) concentrations (up to 4.500 ppm) were associated with the use of chemicals, particularly cube-type incense products. Higher CO2 concentrations were associated with migraine and headaches. The relationship between chemical and incense products with higher levels of TVOC and SBS symptoms calls for urgent attention of the key urban planning stakeholders in Sri Lanka to improve ventilation and avoid using such products indoors.
Access provided by Autonomous University of Puebla. Download conference paper PDF
Keywords
1 Introduction
Residing in apartments has become popular recently since it solves the accommodation issue due to urbanization, and gives easy accessibility to basic amenities, including workplaces and schools [11, 44]. Modern working patterns, effective land-use policies, and the adoption of contemporary technology motivated many citizens to invest in apartments and use urban living styles. However, various health consequences have been noted due to the building materials’ quality, ventilation standards, lighting, and air quality. One common health outcome of living in apartments is Sick Building Syndrome. The prevalence of symptoms of SBS can be due to various building defects such as poor indoor air quality [4, 41, 52], poor outdoor air quality [37], low ventilation rate [39], thermal discomfort [27], and also psychosocial factors [14, 16, 17].
Furthermore, the consumer products, household items, and chemical substances that the occupants use for their day-to-day activities may pollute the indoor environment. This in turn may eventually lead to building-related sicknesses such as Sick Building Syndrome (SBS) among residents [21, 50]. For example, using incense products for fragrance has been a common practice, especially in Asia, including Sri Lanka, since ancient times [36]. Some incense products create undesirable indoor environmental conditions by emitting many Volatile Organic Compounds (VOC) such as toluene, styrene, and formaldehyde [34].
Although several studies have been conducted worldwide on SBS, minimal research has been conducted on these uniquely created atmospheric conditions in South Asia. Therefore, the current study was carried out in the city of Colombo, Sri Lanka to explore the magnitude of SBS and associated factors for its development in these uniquely created urban apartment environment conditions.
2 Sick Building Syndrome (SBS)
Sick Building Syndrome (SBS) is a term that refers to a collection of symptoms that affect some occupants of a building during the time they spend in the building and diminish or go away during periods when they leave the building [45]. In other words, SBS is an example of a “disease that cannot be clinically identified as building-related illnesses, although that can be associated with buildings” [26]. SBS usually starts with respiratory symptoms and moves on to dermatological and even neurological symptoms [19]. Fig. 1 highlights some of the SBS symptoms identified in previous researches.

SBS symptoms
Evidence suggests that SBS symptoms were associated with unsatisfactory indoor environmental factors such as elevated concentrations of Volatile Organic Compounds (VOC), CO2, temperature, humidity, noise, and vibration [20, 23, 32]. In addition, low humidity levels were also found to be associated with SBS symptoms, based on past studies conducted worldwide. Table 1 summarizes several of the most prominent parameters that affect IEQ and their impact on health.
3 Methodology
A field study was conducted in selected settings in Colombo District, Sri Lanka. Data collection was carried out over three months, from June 2020 to September 2020. The field study consisted of an inspection of apartments and measurements of environmental parameters such as TVOC concentration, CO2 concentration, temperature, relative humidity, and noise levels. In addition, an interviewer-administered questionnaire was used to gather information about the occupants’ building characteristics, chemical usage, and SBS symptoms. Visits to the selected apartments were made between 10 am and 5 pm, and the sample size was limited to fifty (50) apartments.
3.1 Sampling Technique
The targeted population of the research was residents in high-rise apartment complexes in the Colombo district, Sri Lanka. The clustered sampling technique was used to list the urban areas such as Colombo Municipal Council, Kotte, Dehiwala/Mt Lavinia, Moratuwa, Maharagama, Kolonnawa, Seethawakapura, Kesbewa, Borelesgamuwa, and Kaduwela to shortlist out of the entire Colombo district. Finally, 50 apartments were selected with a simple random sampling method.
3.2 Questionnaire Survey
The questionnaire included three main sections: Building characteristics, chemical usage inside the apartment, and SBS symptoms of the occupants, as indicated in Fig. 2. Items of the questionnaire were selected based on questionnaires used in similar past epidemiological studies in workplaces, homes, schools, and day-care centers [8, 22, 40]. Serious sicknesses (Sinus infection, Asthma, Migraine, Eczema, Hay fever, and Allergy to dust) were selected and collected on a binary scale depending on a previous diagnosis by a physician. The presence of acute SBS symptoms (Irritation in eyes, runny nose, dry throat, cough, dry face/hands, lethargy/drowsiness/tiredness, and headache) were selected and collected on a 5-point Likert scale and changed to a binary scale (positive and negative) by assuming at least 3 as positive.

Components of the field study
3.3 IEQ Measurement
A set of field measurements were taken to assess the indoor air quality of the selected apartments. The measurements included TVOC concentration, CO2 concentration, Relative Humidity, Temperature, and Noise level. Fig. 3 illustrates the eight locations where the measurements were taken inside an apartment. These included the four corners of the living room, the center of the living room, the center of bedroom 1, the center of bedroom two, and a location on the veranda to measure the outdoor air quality. Each measurement was taken at a height of 1.2 m above floor level. The ability for cross ventilation was also noted during the measurements. The average values of the first 7 points were considered as the indoor measurement, and the final veranda reading was considered as the outdoor measurement.

Locations within an apartment where IEQ parameters were measured
3.4 Experimental Equipment
Indoor TVOC measurements were measured with a handheld Omega HHAQ-107 data logging VOC meter. Sper scientific data logging IAQ meter was used to measure the CO2 concentration, temperature, and relative humidity. The indoor noise level was measured using an android application named Sound Meter-Decibel Meter, which was validated at a laboratory facility.
3.5 Data Analysis
Initially, the prevalence of SBS symptoms and building characteristics were analyzed with measured IEQ parameters to find magnitude, extent, and correlations. Afterward, the measured IEQ parameters were compared with indoor chemical usage to find the effect of incense products on the environment. Finally, logistic regression models were used to evaluate the associations of SBS symptoms with indoor air pollutants. The P-value < 0.05 was considered statistically significant.
4 Results and Analysis
Results of the field study, including questionnaire survey data and measurements, were analyzed and summarized according to the prevalence of SBS symptoms, chemical usage inside apartments, and IEQ measurements under Section 4.1–4.3. Possible associations were developed between data collected through the questionnaire and the measured IEQ parameters. Subsection 4.4 and 4.6 describe the possible associations between building characteristics, incense product usage, and the association of SBS with indoor air quality measurements, respectively.
4.1 Magnitude/prevalence of SBS Symptoms
The frequency distribution of the presence of SBS symptoms is indicated in Table 2. Allergy to dust and Sinus infection were found to be the most common SBS sickness prevalent in 55.8% and 46.5% of the measured apartments, respectively. Runny nose and migraine were also prevalent in 39.5% of occupants of the measured apartments. When considering at least one symptom in each category, it was visible that 86% had at least one respiratory or mucous membrane symptom, 65.1% had at least one general and neurological symptom, and 30.2% had at least one dermatological symptom.
4.2 Use of Chemicals Inside the Apartments
Since indoor TVOC concentrations can be altered since they are due to incense products and chemicals inside the apartments [34, 47], the occupants were asked to indicate relevant chemical usage information in the questionnaire. Table 3 demonstrates the summary of chemical usage inside the apartment, including the type of incense products used and the frequency.
4.3 Measurement of Indoor Air parameters
Only 43 apartments were occupied at the time of the study. Therefore, only those apartments were considered in the analysis of SBS symptoms. Hence, the descriptive analysis was carried out only for measured IEQ parameters for those 43 occupied apartments. Table 4 presents a descriptive analysis of the indoor and outdoor air quality measurements of the occupied apartments, including the mean, maximum, median, percentiles, and standard deviation.
4.4 Potential Correlations between Building Characteristics and Indoor Air Quality Measurements
The following potential relationships have been identified between building characteristics and indoor environmental quality:
-
(a)
The outdoor TVOC concentration was reported to be decreasing with the height of the building, as illustrated in Fig. 4. For the buildings below 4 m in height, the average TVOC was 0.36 ppm. However, when the height from ground level to the apartment increased to 4–8 m, the average dropped to 0.22 ppm. Further, when it was above 12 m, the average dropped to 0.03 ppm.
Fig. 4 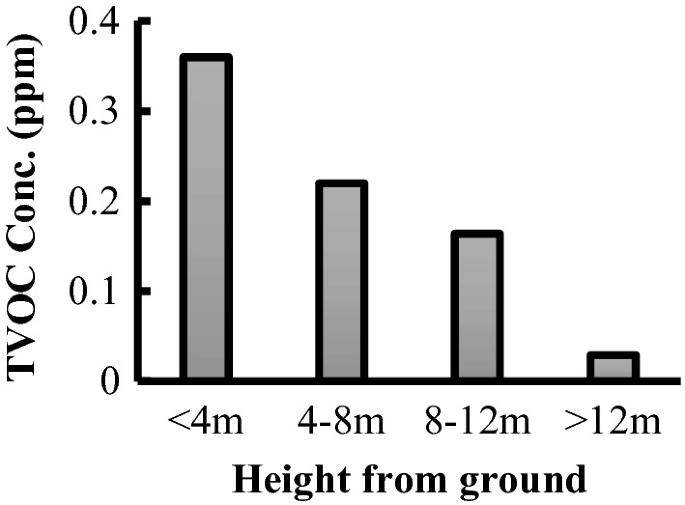
Average outdoor TVOC concentration with apartment height
-
(b)
The ability for cross ventilation showed a clear relationship with indoor TVOC concentration. As shown in Fig. 5, apartments with no cross ventilation had the highest average TVOC concentration of 0.76 ppm, while those with cross ventilation provided in the living room had an average of 0.56 ppm. Moreover, those with cross ventilation in both living and bedrooms had the lowest average of 0.06 ppm TVOC.
Fig. 5 
Average TVOC concentration with and without cross ventilation


4.5 Correlations Between Indoor Chemical and Incense Product Use With Concentrations of Air Quality Parameters
In the present study, indoor TVOC concentrations were compared using different types of incense and chemical products. Fig. 6 represents the variation of average TVOC concentration with various incense products used in the selected sample of apartments. Cube types resulted in the highest average TVOC concentration of 3.55 ppm. Gel type, spray type, incense sticks, and scented candles had an average TVOC concentration of 0.70 ppm, 0.59 ppm, 0.45 ppm, and 0.36 ppm, respectively. However, with the essential oils and potpourris, the TVOC concentration turned out to be zero. Therefore, the sample of surveyed apartments was categorized into three levels of indoor pollutants based on the TVOC concentration. Fig. 7 indicates the probability level with different types of incense products. The categorization of TVOC concentration is as follows:

Variation of average TVOC concentration with different types of air

TVOC concentration distribution with different types of incense products
-
TVOC Concentration > 0.75 ppm: red color with a patch
-
0 < TVOC concentration < 0.75 ppm: yellow color with a patch
-
TVOC concentration = 0: green color with a patch
Figure 7 reveals the following findings:
-
Almost 100% of the apartments using cube-type incense products fall into the category of high TVOC emitting scenario (>0.75 ppm).
-
There were about 33% of apartments using gel-type incense products that indicated a high TVOC concentration (>0.75 ppm), while the rest indicated a low TVOC concentration (<0.75 ppm).
-
27% of the apartments used Spray type incense products, indicating a high TVOC concentration (>0.75 ppm), while 23% indicated a low TVOC concentration, and the remainder indicated zero VOC concentration.
-
Out of the apartments using incense sticks, 19% indicated a high TVOC concentration (>0.75 ppm), 36% indicated a low TVOC concentration, and the remaining 45% indicated Zero TVOC concentration.
4.6 Correlations Between SBS Symptoms and Associated IEQ Parameter Factors
Odds ratios were calculated for each measured physical IEQ parameter (TVOC concentration, CO2 concentration, relative humidity, temperature, and noise level) for SBS symptoms, using multiple logistic regression models, as shown in Table 5. In order to calculate odds ratios, thresholds were determined for all IEQ parameters, i.e., 0.75 ppm for TVOC as per [25], for CO2, although the threshold was defined as 1000 ppm [51]. Since the results indicated lower CO2 values with a mean of 524 ppm, a threshold of 650 ppm was selected. Similarly, in the literature, thermal comfort is achieved at 27 \(^\circ{\rm C}\) [27]. Since many apartments indicated higher temperatures with an average of 30.6 \(^\circ{\rm C}\), the threshold was selected at 31.5 \(^\circ{\rm C}\) for temperature. Also, relative humidity and noise level thresholds were taken as 70% and 60 dB, respectively. The units exceeding the thresholds were considered positive. Since literature revealed that noise is related to general SBS symptoms, it is unlikely that respiratory and dermatological symptoms occur due to noise [6]. Hence, the noise was removed when calculating multiple logistic regression models for other SBS symptoms.
High TVOC concentration and high CO2 concentration resulted in higher odds for most of the short-listed SBS symptoms. However, for TVOC, none of the symptoms was significantly associated with a P-value less than 0.05 when the TVOC concentration was higher than 0.75 ppm. For CO2, migraine and headache became significantly associated with a P-value less than 0.05 when CO2 concentrations were above 650 ppm. Relative humidity, temperature, and noise level also increased the odds for some SBS symptoms, which were insignificant at a 95% confidence interval.
A forest plot was also developed to easily determine the correlations with higher odds, as shown in Fig. 8. The following symptoms resulted in greater odds than 1 when the IEQ parameters exceeded their thresholds.

Forest plot for IEQ measurements and SBS symptoms
-
TVOC—headache, runny nose, and hay fever
-
CO2—headache, migraine, eczema, cough, dry throat, runny nose, irritation in eyes, Sinus infection
-
Relative humidity—dry hands, runny nose
-
Temperature—headache, migraine, cough
-
Noise—migraine
5 Discussion
The present study was one of the pioneer studies conducted across apartments in Sri Lanka, which resulted in many significant findings concerning future urban planning and apartment occupancy. Allergy to dust and Sinus infection was found to be the most common SBS sickness prevalent in around 50% of the measured apartments. Runny nose and migraine were prevalent in almost 40% of the measured apartments. More than 85% of the occupants indicated at least one respiratory and mucous membrane symptom, 65% indicated at least one general and neurological symptom, and 30% indicated at least one dermatological symptom.
When considering the indoor and outdoor TVOC concentrations, it was clear that the indoor TVOC concentrations were higher than the outdoor TVOC concentrations. Similarly, indoor CO2 concentrations were higher than outdoor CO2 concentrations. However, several indicated otherwise. After further consideration, it was visible that these were either unoccupied apartments or apartments under construction during the visit.
According to the obtained results of this study, outdoor TVOC concentrations reduced rapidly with the apartment height. This can be due to two reasons. Firstly, the reduction of outdoor air pollution at higher elevations due to less activity and the quick flush out of air pollutants due to heavy cross breeze at higher elevations [12]. Eventually, they may create better indoor environments at higher elevations. Cross ventilation also greatly influenced indoor air in naturally ventilated apartments as it was associated with reduced indoor TVOC concentrations. This could be because fresh crosswinds flowing through the apartment might flush out the indoor pollutants.
Cube-type, gel-type, and incense-stick-type incense products were associated with high levels of indoor TVOC concentrations, out of which cube type indicated the worst scenario having 100% of the apartments over the threshold of 0.75 ppm [25]. Also, the results showed that potpourris and essential oil types indicated zero TVOC concentration indoors. Therefore, making it comparatively better incense products to be used in the long run.
Several associations between indoor air parameters and SBS symptoms resulted in higher odds, as per Fig. 8. However, only Headache and Migraine became significant at a 95% confidence interval with P-value less than 0.05. This can be due to the lower sample size [28]. Hence, further research should be carried out with a larger sample. Furthermore, for some SBS symptoms (Sinus infection, Hay fever, Dry face, and hands), the odds could not be calculated due to the limitation of sample size. The study was conducted in 50 apartments, and some of the values required to calculate odds resulted in null and those odds were denoted by CBD in Table 5. Hence, it is advised to conduct the study with an adequate sample of apartments for future research to obtain at least several sample units from each category to overcome these situations.
6 Strengths and Limitations
In this study, the occupants self-reported their SBS symptoms in the questionnaire. This may incur recall bias due to inherent defects of the questionnaire survey. However, the questionnaire-based survey is a reliable source of information from occupants [1, 9]. Since this was a field study, controlling all the variable parameters was not feasible. However, the effect of each parameter can be tested if the study could be conducted in a laboratory environment by altering one variable at a time.
The study focused on the SBS symptoms due to the apartment environment. However, the workplaces of the occupants were not considered. Therefore, associations between SBS symptoms and apartment environments would become more apparent if all other environments were characterized.
The sample contained apartments of middle to high-income people, which can be considered a limitation of this study. However, different results could be expected if the study is expanded to slums and apartments of low-income people. The study was also based on 50 apartment units, which could be considered a low sample size and a limitation. Hence, carrying out this study with larger sample size is recommended to reduce the sampling bias and confirm whether the significant results have been masked.
However, the study is based on one region, so further field studies and controlled laboratory experiments are needed to validate these findings. Nevertheless, these new insights on the potential relationships between IAQ parameters, incense products, and SBS symptoms encourage the importance of ventilation and other means to IAQ.
7 Conclusion
This research conducted a field study on apartments in the Colombo district, focusing on IAQ parameters and SBS symptoms. It analyzed chemical usage, such as incense products’ influence on indoor environmental factors. Allergy to dust and Sinus infection were found to be the most common SBS sicknesses prevalent in around 50% of the measured apartments. Runny nose and migraine were prevalent in almost 40% of the measured apartments. Indoor TVOC concentrations varied from 0 ppm to 4.5 ppm, with an average of 0.58 ppm inside occupied apartments. Indoor CO2 concentrations ranged from 386 to 883 ppm, with a mean of 536 ppm. It was shown that the outdoor pollutant concentrations were reduced with height and cross ventilation was one of the best ways to reduce indoor pollutant concentration. It was found that indoor chemical usage and incense products, especially the cube type and gel type, led to higher indoor TVOC concentrations. Natural incense products such as potpourris and essential oils were the relatively better incense products to be used in indoor environments concerning indoor TVOC concentrations. Migraine and headache became significant with higher CO2 concentrations.
Finally, it can be concluded that increased ventilation and minimized usage of indoor chemicals can lead to a better indoor environment inside apartments and safeguard its occupants from Sick Building Syndrome; hence, Policymakers should provide necessary guidelines.
References
Andersson K 1998 'Epidemiological approach to indoor air problems*'. Indoor Air 8(S4): 32–39. Available at: https://doi.org/10.1111/J.1600-0668.1998.TB00005.X
Apte MG, William JF, Daisey JM 2000 'Associations between indoor CO2 concentrations and sick building syndrome symptoms in U.S. office buildings: An Analysis of the 1994-1996'. Indoor Air 10(4): 246–257. Available at: https://doi.org/10.1034/j.1600-0668.2000.010004246.x
Assimakopoulos VD, Helmis CG 2004 ‘On the study of a sick building: The case of Athens air traffic control tower’. Energy Build 36(1): 15–22. Available at: https://doi.org/10.1016/S0378-7788(03)00043-4
Bakke JV et al. 2008 ‘Symptoms, complaints, ocular and nasal physiological signs in university staff in relation to indoor environment—temperature and gender interactions’. Indoor Air 18(2): 131–143. Available at: https://doi.org/10.1111/j.1600-0668.2007.00515.x
Banbury S, Berry DC 1998 ‘Disruption of office-related tasks by speech and office noise’. Br J Psychol 89(3): 499–517. Available at: https://doi.org/10.1111/j.2044-8295.1998.tb02699.x
Banbury SP, Berry DC 2005 ‘Office noise and employee concentration: Identifying causes of disruption and potential improvements’. Ergonomics 48(1): 25–37. Available at: https://doi.org/10.1080/00140130412331311390
Cao SJ, Deng HY 2019 'Investigation of temperature regulation effects on indoor thermal comfort, air quality, and energy savings toward green residential buildings'. Sci Technol Built Environ 25(3): 309–321. Available at: https://doi.org/10.1080/23744731.2018.1526016
Engvall K, Norrby C, Sandstedt E 2004a 'The Stockholm indoor environment questionnaire: A sociologically based tool for the assessment of indoor environment and health in dwellings'. Indoor Air 14(1): 24–33. Available at: https://doi.org/10.1111/J.1600-0668.2004.00204.X
Engvall K, Norrby C, Sandstedt E 2004b 'The Stockholm indoor environment questionnaire: A sociologically based tool for the assessment of indoor environment and health in dwellings'. Indoor Air 14(1): 24–33. Available at: https://doi.org/10.1111/J.1600-0668.2004.00204.X
Eriksson NM, Stenberg BGT 2006 'Baseline prevalence of symptoms related to indoor environment'. Scand J Public Health 34(4): 387–396. Available at: https://doi.org/10.1080/14034940500228281
Husein AH 2021 'Multifunctional furniture as a smart solution for small spaces for the case of Zaniary towers apartments in Erbil City, Iraq'. Researchgate.net 12(1): 1–11. Available at: https://doi.org/10.14456/ITJEMAST.2021.8
Irwin P, Kilpatrick J, Robinson J, and Frisque A 2008 ‘Wind and tall buildings: negatives and positives’. The Structural Design of Tall and Special Buildings, 17(5): 915–928. https://doi.org/10.1002/TAL.482
Jaakkola MS et al. 2007 'Office work exposures and respiratory and sick building syndrome symptoms'. Occup Environ Med 64(3): 178–184. Available at: https://doi.org/10.1136/OEM.2005.024596
Kinman G, Griffin M 2008 'Psychosocial factors and gender as predictors of symptoms associated with sick building syndrome'. Stress Health 24(2): 165–171. Available at: https://doi.org/10.1002/smi.1175
Lu C et al. 2016 'Outdoor air pollution, meteorological conditions and indoor factors in dwellings in relation to sick building syndrome (SBS) among adults in China'. Sci Total Environ 560–561: 186–196. Available at: https://doi.org/10.1016/j.scitotenv.2016.04.033
Lu CY et al. 2017a 'Personal, psychosocial and environmental factors related to sick building syndrome in official employees of Taiwan'. Int J Environ Res Public Health 15(1): 7. Available at: https://doi.org/10.3390/IJERPH15010007
Lu CY et al. 2017b 'Personal, psychosocial and environmental factors related to sick building syndrome in official employees of Taiwan'. Int J Environ Res Public Health 15(1): 7. Available at: https://doi.org/10.3390/IJERPH15010007
Mendell MJ, Kumagai K 2017 'Observation-based metrics for residential dampness and mold with dose–response relationships to health: A review'. Indoor Air. Blackwell Munksgaard: 506–517. Available at: https://doi.org/10.1111/ina.12342
Mendes A, Teixeira JP 2014 'Sick building syndrome'. Encyclopedia of Toxicology, 3rd edn. pp. 256–260. Available at: https://doi.org/10.1016/B978-0-12-386454-3.00432-2
Murniati N 2020 'Sick building syndrome in Indonesia and Singapore: A comparative study'. In: Proceedings of the 3rd International Conference on Vocational Higher Education (ICVHE 2018). Paris, France: Atlantis Press, pp. 278–283. Available at: https://doi.org/10.2991/assehr.k.200331.153
Nielsen GD et al. 2007 'Do indoor chemicals promote development of airway allergy?'. Indoor Air 17(3): 236–255. Available at: https://doi.org/10.1111/J.1600-0668.2006.00468.X
Norback D, Edling C 1991 'Environmental, occupational, and personal factors related to the prevalence of sick building syndrome in the general population.' Occup Environ Med 48(7): 451–462. Available at: https://doi.org/10.1136/OEM.48.7.451
Norhidayah A et al. 2013 'Indoor air quality and sick building syndrome in three selected buildings'. In: Procedia Engineering. Elsevier Ltd, pp. 93–98. Available at: https://doi.org/10.1016/j.proeng.2013.02.014
Oh HJ et al. 2020 'Exposure to respirable particles and TVOC in underground parking garages under different types of ventilation and their associated health effects'. Air Qual, Atmos & Health 13(3): 297–308. Available at: https://doi.org/10.1007/S11869-020-00791-0
OSHA 2011 OSHA Fact Sheet: Formaldehyde | Occupational safety and health administration. Available at: https://www.osha.gov/OshDoc/data_General_Facts/formaldehyde-factsheet.html (Accessed: 9 March 2021)
Reiko K, Norbäck D,Araki A 2020 ‘Indoor environmental quality and health risk toward healthier environment for all. Singapore: Springer Link. https://doi.org/10.1007/978-981-32-9182-9
Rodrigo GA, Perera BAKS, Ekanayake BJ 2019 'Occupant perceptions on the thermal comfort guidelines in air-conditioned offices in Colombo, Sri Lanka'. Int J Constr Manag: 1–9. Available at: https://doi.org/10.1080/15623599.2019.1639125
Royall RM 1986 'The effect of sample size on the meaning of significance tests'. Am Stat 40(4): 313–315. Available at: https://doi.org/10.1080/00031305.1986.10475424
Sahlberg B et al. 2013 'Airborne molds and bacteria, microbial volatile organic compounds (MVOC), plasticizers and formaldehyde in dwellings in three North European cities in relation to sick building syndrome (SBS)'. Sci Total Environ 444: 433–440. Available at: https://doi.org/10.1016/j.scitotenv.2012.10.114
Sahlberg B, Mi YH, Norbäck D 2009 'Indoor environment in dwellings, asthma, allergies, and sick building syndrome in the Swedish population: a longitudinal cohort study from 1989 to 1997'. Int Arch Occup Environ Health 82(10): 1211–1218. Available at: https://doi.org/10.1007/S00420-009-0444-3
Sahlberg B, Wieslander G Norbäck D 2010 'Sick building syndrome in relation to domestic exposure in Sweden—A cohort study from 1991 to 2001'. Scand J Public Health 38(3): 232–238. Available at: https://doi.org/10.1177/1403494809350517
Saijo Y et al. 2009 'Relation of dampness to sick building syndrome in Japanese public apartment houses'. Environ Health Prev Med 14(1): 26–35. Available at: https://doi.org/10.1007/s12199-008-0052-y
Shan X et al. 2016 'Comparing mixing and displacement ventilation in tutorial rooms: Students' thermal comfort, sick building syndromes, and short-term performance'. Build Environ 102: 128–137. Available at: https://doi.org/10.1016/j.buildenv.2016.03.025
Silva GV, Martins AO, Martins SDS 2021 'Indoor air quality: Assessment of dangerous substances in incense products'. Int J Environ Res Public Health 18(15): 8086. Available at: https://doi.org/10.3390/IJERPH18158086
Simoni M et al. 2010 'School air quality related to dry cough, rhinitis and nasal patency in children'. Eur Respir J 35(4): 742–749. Available at: https://doi.org/10.1183/09031936.00016309
Staub PO, Geck MS, Weckerle CS 2011 'Incense and ritual plant use in Southwest China: A case study among the Bai in Shaxi'. J Ethnobiol Ethnomedicine 7(1): 1–16. Available at: https://doi.org/10.1186/1746-4269-7-43/FIGURES/7
Sun C et al. 2018 'Outdoor air pollution in relation to sick building syndrome (SBS) symptoms among residents in Shanghai, China'. Energy Build 174: 68–76. Available at: https://doi.org/10.1016/j.enbuild.2018.06.005
Sun Y et al. 2013 'Effects of gender and dormitory environment on sick building syndrome symptoms among college students in Tianjin, China'. Build Environ 68: 134–139. Available at: https://doi.org/10.1016/j.buildenv.2013.06.010
Sun Y et al. 2019 'Indoor air quality, ventilation and their associations with sick building syndrome in Chinese homes'. Energy Build 197: 112–119. Available at: https://doi.org/10.1016/j.enbuild.2019.05.046
Sundell J 1994 'On the association between building ventilation characteristics, some indoor environmental exposures, some allergic manifestations and subjective symptom reports'. Indoor Air 4(S2): 7–49. Available at: https://doi.org/10.1111/J.1600-0668.1994.TB00031.X
Sundell J 2004 'On the history of indoor air quality and health'. Indoor Air, Suppl: 51–58. Available at: https://doi.org/10.1111/j.1600-0668.2004.00273.x
Surahman U, Ray HRD (2020) IOP Conference series: Earth and environmental science sick building syndrome and its effect on health of students and teachers in selected educational buildings in Bandung Sick building syndrome and its effect on health of students and teachers in selected educational buildings in Bandung. Available at: https://doi.org/10.1088/1755-1315/447/1/012049
Thach TQ et al. 2019 'Prevalence of sick building syndrome and its association with perceived indoor environmental quality in an Asian multi-ethnic working population'. Build Environ 166: 106420. Available at: https://doi.org/10.1016/j.buildenv.2019.106420
Tong XW, Lee LN, Kim MJ 2021 'Smart management services for high-rise apartments in Beijing, China'. 21(5): 1792–1800. Available at: https://doi.org/10.1080/13467581.2021.1964974
US EPA 2012 Indoor air quality glossary|US EPA. Available at: https://sor.epa.gov/sor_internet/registry/termreg/searchandretrieve/glossariesandkeywordlists/search.do?details=&glossaryName=IAQ%20Glossary#formTop (Accessed: 16 March 2022)
Vasile V, Petcu C, Iordache V 2019 Experimental studies on TVOC concentrations and their relationships with indoor comfort parameters. REV.CHIM.(Bucharest) ♦. Available at: http://www.revistadechimie.ro (Accessed: 12 April 2020)
Virji MA et al. 2019 'Peaks, means, and determinants of real-time TVOC exposures associated with cleaning and disinfecting tasks in healthcare settings'. Ann Work Expo Health 63(7): 759–772. Available at: https://doi.org/10.1093/ANNWEH/WXZ043
Wang J et al. 2022 'Eczema, facial erythema, and seborrheic dermatitis symptoms among young adults in China in relation to ambient air pollution, climate, and home environment'. Indoor Air 32(1): e12918. Available at: https://doi.org/10.1111/INA.12918
Wargocki P 2000 'The effects of outdoor air supply rate in an office on perceived air quality, sick building syndrome (SBS) symptoms and productivity'. Indoor Air 10(4): 222–236. Available at: https://doi.org/10.1034/j.1600-0668.2000.010004222.x
Wei W et al. 2022 'Predicting chemical emissions from household cleaning and personal care products: A review'. Build Environ 207: 108483. Available at: https://doi.org/10.1016/J.BUILDENV.2021.108483
WHO 2015 Sri Lanka HEALTH ESTIMATES. Available at: www.who.int (Accessed: 22 June 2021)
WHO 2018 'Health effects of Indoor air pollution in developing countries'. WHO [Preprint]
Zhang X et al. 2019 'Dampness and mold in homes across China: Associations with rhinitis, ocular, throat and dermal symptoms, headache and fatigue among adults'. Indoor Air 29(1): 30–42. Available at: https://doi.org/10.1111/ina.12517
Author information
Authors and Affiliations
Corresponding author
Editor information
Editors and Affiliations
Rights and permissions
Copyright information
© 2023 The Author(s), under exclusive license to Springer Nature Singapore Pte Ltd.
About this paper

Cite this paper
Kumarage, N.R., Jayasinghe, C., Perera, K.P.H., Kariyawasam, K.K.G.K.D., Wickramasinghe, E.P. (2023). Assessment of Indoor Air Quality and Sick Building Syndrome in Apartment Buildings. In: Dissanayake, R., et al. ICSBE 2022. ICSBE 2022. Lecture Notes in Civil Engineering, vol 362. Springer, Singapore. https://doi.org/10.1007/978-981-99-3471-3_30
Download citation
DOI: https://doi.org/10.1007/978-981-99-3471-3_30
Published:
Publisher Name: Springer, Singapore
Print ISBN: 978-981-99-3470-6
Online ISBN: 978-981-99-3471-3
eBook Packages: EngineeringEngineering (R0)