
Abstract
Python libraries are a collection of essential functions that eliminate the need for users to develop code from scratch. Python is a plethora of libraries that serve a range of purposes and it has become a necessity to have sound knowledge of the best ones. Human and machine data production greatly outpaces humans’ ability to absorb, assess, and make complicated decisions based on that data. AI (Artificial Intelligence) is the foundation of all computer learning and the future of all intricate decision making. These technologies are being looked upon as tools and techniques to make this world a better place. It’s application ranges from various fields like healthcare, finance, transport, manufacturing, fraud detection and so on which evidently depicts its potential to transform the future. This paper intends to well verse the readers with the top libraries used to implement concepts of Artificial Intelligence like Machine Learning, Data Science, Deep Learning, Data Visualization and so on. It provides meticulous and unambiguous details about the essential building blocks necessary to execute and perform such ideas. It also includes a comparative analysis of various libraries to provide a detailed understanding and overview of them.
Access provided by Autonomous University of Puebla. Download conference paper PDF
Keywords
1 Introduction
Artificial Intelligence (AI) is a group of mighty interrelated technologies that can be used to perform complex and multiplex tasks openly with little or no human guidance. It is a vast topic of applied sciences and is used to demonstrate intelligence even beyond natural human intelligence. AI has progressed from data models for problem-solving to artificial neural networks, a computational model based on the structure and functions of human biological neural networks. Existing methodologies must be merged in order to convert vast amounts of data into value for individuals, businesses, and society. Furthermore, new barriers have evolved, not just in terms of magnitude (“Big Data”), but also in terms of the questions that should be answered. It encompasses broad topics like Experts Systems, Robotics, Machine Learning, Data Science, Neural networks, Fuzzy Logic, Natural Language Processing and so on which are booming rapidly in the times we live in. AI and DS are influenced by python. It helps to slow down the efforts of the human brain. From speech recognition to data interpretation, python and its libraries have taken AI to the sky with remarkable success. Neural networks and machine learning are the branches of AI that illuminate the future of python. Python language focuses on the readability of the code. Python has incorporated mathematical libraries and functions, making it easy to calculate mathematical problems and perform data analysis. Python libraries are in great demand even in the IoT sector. It is widely used in home and office automation to speed up the work process easily. There are numerous tools, programming languages and applications to build AI-based systems out of which Python is the most popular language for AI because of its flexibility, platform autonomy, better data visualisation and optimization options. The Python libraries are a powerful way to invent AI-based systems in a very efficient and pragmatic manner. This article aims to concentrate on and analyse the characteristics of the most popular Python libraries, as well as their potential for data mining and big data research. Throughout the paper, each of these techniques will be examined in-depth, with examples of their use in diverse domains. These libraries are the most frequently used and respected resources for solving real-world issues and developing high-tech systems.
2 Tools in Python Aiding to Artificial Intelligence
Python is a powerful interpreted language with a solid core foundation and a robust modular component that extends the language with external modules that provide new features. As a result, we now have an extensible language with tools for doing a particular operation as efficiently as feasible. Packages are frequently used to arrange modules. A package is a logical grouping of modules that all serve the same function.
2.1 Numpy
The Python programming language has a large number of high-level data structures available such as lists that enumerate collections of objects, dictionaries for building hash tables, and more. However, these structures are not ideally suited for high-performance numerical calculations. All the fundamental operations in programming include mathematical tools such as arrays, matrices, integration tools, linear equation solvers, differential equation solvers, etc. Python provides the necessary tools to easily perform these complicated calculations and difficult mathematical operations in the form of its Numpy package.
In the mid-nineties, an international team of volunteers began developing data structures for efficient array calculations [1]. This structure has evolved into what is now known as the N-dimension NumPy array. NumPy is a general-purpose array-processing package. Its main object is the homogeneous multidimensional array. It is a table containing elements (commonly numbers) of the same type that are all indexed by a tuple of non-negative integers. In NumPy dimensions are called axes. The package provides a fast interface for storing and manipulating dense data buffers. NumPy arrays are similar to Python’s built-in list type in certain aspects, but NumPy arrays allow far more efficient storage and data operations as the arrays grow in size. NumPy arrays are at the root of basically the entire Python ecosystem of data science tools. Python NumPy arrays provide tools for integrating C, C++, etc. It is also useful in linear algebra, random number capability etc. The NumPy array can also be used as a multi-dimensional container for general data [1]. We can initialize NumPy arrays from nested Python lists and access its elements. The NumPy package, consisting of NumPy arrays and their corresponding set of mathematical functions, is widely used in academia, national labs, and industry in applications from games to space exploration.
Here are the top four benefits that NumPy can bring to your code:
-
1.
More speed: NumPy uses algorithms written in C that complete in nanoseconds rather than seconds.
-
2.
Fewer loops: NumPy assists you in reducing loops and avoiding becoming entangled in iteration indices.
-
3.
Clearer code: Without loops, the code will look more like the equations which are being tried to calculate.
-
4.
Better quality: There are thousands of contributors working to keep NumPy fast, friendly, and bug free.
Because of these advantages, NumPy has become the de facto standard in Python data science for multidimensional arrays, and many of the most popular libraries are built on top of it. It is a very important library on which almost every data science or machine learning Python packages such as SciPy (Scientific Python), Mat-plotlib (plotting library), Scikit-learn, etc. depend on to a reasonable extent. Learning NumPy is an excellent approach to lay a solid basis for furthering one’s expertise in more specialised fields of data science.
The Numpy library uses multidimensional ndarrays to perform numerical processing by allowing broadcasting i.e. each and every element is processed one after another. It also allows wrapping codes of C, C++ and FORTRAN to compute core mathematical operations including linear algebra. NumPy operates on in-memory arrays using the central processing unit (CPU). To utilize modern, specialized storage and hardware, there has been a recent proliferation of Python array packages [2]. Numpy offers N-Dimensional arrays (ndarray), a storage object and a Universal Function Object (ufunc) for computing data efficiently. The ndarray consists of two essential pieces of information first being the size of the array (also referred as the shape of the array, it is a tuple of N integers containing the number of rows and columns) and second being the datatype of the items stored inside the Numpy array (Fig. 1).

Basic matrix operations using NumPy
2.2 Pandas
The pandas package is the most important data manipulation and analysis tool at the disposal of Data Scientists and Analysts working in Python today. Although advanced machine learning and fancy visualisation tools get all the attention, pandas is the foundation of most projects and initiatives. Through pandas, one can get acquainted with their data by cleaning, transforming, and analyzing it. The library’s name springs from panel data, a general term for multidimensional data sets encountered in statistics and econometrics. It is a Python library that includes a variety of knowledge structures and tools for working with structured datasets that are used in statistics, finance, social sciences, and a variety of other fields. The library is incorporated to conduct typical data processing and analysis of certain datasets, with user-friendly procedures.
The panda library, which has been developed since 2008, aims to bridge the gap in the abundance of data analysis tools available between Python, general-purpose systems, and scientific computing languages, and many domain-specific statistical computing platforms and database languages. The aim is to provide equivalent functionality and implement many features, such as automatic data alignment and hierarchical indexing, which are not available in a tightly integrated manner like so in other libraries.
Pandas is constructed on top of the NumPy package, which means that much of NumPy’s structure is used or recreated in Pandas. Pandas data is frequently used to feed statistical analysis in SciPy, graphing functions in Matplotlib, and machine learning algorithms in Scikit-learn.
The Series and DataFrame are the two main components of pandas. A Series is just a column, while a DataFrame is a multi-dimensional table composed of Series. Exploring, cleaning, transforming, and visualizing data with pandas in Python is an essential skill in data science. Just cleaning wrangling data is 80% of the job of a Data Scientist.
Operations after loading dataset in the Python Environment:
-
You may compute the fundamental statistics of your dataset and answer typical inquiries such as what the mean, median, minimum, and maximum values are.
-
A correlation between two or more columns in the dataset can also be discovered.
-
Clean up the data by deleting missing or blank values and filtering entries based on a criterion.
-
Use other modules to visualise the data, such as seaborn, matplotlib, and so on.
-
Save the cleaned data frame to a CSV or database of your choosing.
We believe that in the coming years there will be great opportunities to attract users in need of statistical data analysis tools to Python who might have previously chosen R, MATLAB, or another research environment [3]. By designing robust, easy-to-use data structures that cohere with the rest of the scientific Python stack, we can make Python a compelling choice for data analysis applications. In our opinion, pandas provides a solid foundation upon which a very powerful data analysis ecosystem can be established (Fig. 2).

Data analysis using Pandas and plotting its graph
2.3 MatPlotlib
Representation of data in visual form is a necessity nowadays. As the amount of data is increasing day by day, it isn’t easy to manage and represent data in text. Human brains are more flexible and adjustable to visual representation, and this helps to comprehend, analyze, and make decisions for AI and ML. Matplotlib is a Python plotting tool that produces high-quality graphics. Matplotlib was created with the goal of allowing users to produce basic as well as complicated plots with only a few instructions [4]. Jupyter notebooks and web application servers can also utilise Matplotlib.
Graphs of production quality may be generated with Matplotlib’s Python module for 2D plotting. In addition, it can export pictures in a variety of output formats and offers both interactive and non-interactive plotting capabilities. In addition, it supports a broad range of plot kinds and can work with different window toolkits. Aside from that, it’s very customisable, versatile, and simple to use. Due to Matplotlib’s dual nature, it may be used both in interactive and non-interactive scripts. Use it in scripts without a visual display, in graphic apps, or in web pages. Python or IPython can also be used interactively with matplotlib.
John D. Hunter initially wrote Matplotlib in 2003. It is open-source software and can be downloaded, used, and distributed freely.
Key features
Many different situations may be addressed using Matplotlib. Plots and pictures may be created interactively using the command-line, which is well-known to most users. A simple pop-up window is used to show and manipulate the data. The main plotting module of matplotlib, which is operating system and GUI agnostic, is the true power of the library [5]. Can be used as part of a webserver to produce plots and pictures in different hardcopy output formats, or it can be integrated in a more complete programme using one of many GUIs, running on one of several OSs.
Pyplot—matplotlib.pyplot is a group of functions and commands that make matplotlib work like MATLAB. These commands are helpful to create figures, make changes in them, create plotting areas, and embellish the plots.
Pylab: Pylab is an interface to matplotlib for object-oriented plotting. The Pylab module is installed alongside matplotlib.
The types of plots include-Bar, Barht, scatter, stack, Box Plot, step, quiver, violin, Hist, hist2d, pie, plot, polar plot, stemplot.
Axis functions like—Title (Add text to the axes), xlabel (Set the x-axis label of the current axis), xlim, xscale (Set the scaling of the x-axis), Axes (Add axes to the figure), Text (Add text to the axis), ylabel (Set the y axis label current axis), ylim (Get or set the y-limits of the current axes), scale (Set the scaling of the y-axis), are useful to embellish the plots.
Figure functions like- Figtext, Figure, Show, Savefig, Close are important functions for the creation of plots.
Matplotlib’s ease of usage is largely due to the following features:
-
Open-source, thus there’s no need to pay for a licence: Students and teachers on a tight budget will find it intriguing.
-
It’s an actual programming language: The MATLAB language lacks many of the features of a general-purpose language like Python.
-
It’s much more complete: Python has many external modules that will help us execute all the functions we need to perform.
-
With a simple interactive GUI, the plot window allows you to zoom in and out of the plot as well as remember the plot’s history and save it to hardcopy.
-
The command-line interface is based on the MatLab interface, which is straightforward to use.
-
Plot and picture support on many pages
-
For the GD, Agg and Paint backends as well as PostScript, there are TrueType fonts that may be used.
-
Mathematical text LATEX math mode is available whenever TrueType fonts are available.
-
Resampled images are automatically resized to the figure’s dimensions.
-
Assists in programming and development using a fully object-oriented design.
Matplotlib is mostly used to create graphical applications. Python has a convenient graphing package. The Matplotlib library is ideally suited to developing an interactive two-dimensional application, while the three-dimensional plots library is used to build a three-dimensional application. It may also be used to create high-quality photographs [6]. The features and the facilities of matplotlib are advancing day by day. Some of the new features include creating 3D plots using the mplot3d toolkit. Contour plots, wireframe plots, surface plots can also be made using matplotlib. Transformations in the coordinate axes can be quickly done and manipulated. Matplotlib can plot anything, however plotting non-basic plots or adjusting graphs to appear beautiful can be difficult (Fig. 3).

Plotting a 3-dimensional graph for the given data using Matplotlib
2.4 Seaborn
In this arena of data analysis and interpretation, visualisation of data is the best way to get insights and gain information from the data. For this purpose Seaborn is an excellent library for making statistical graphs in Python. It provides an excessive-degree interface to matplotlib and is tightly integrated with the Pandas data structure [7].
The seaborn library functions expose a dataset-oriented declarative API that can easily convert questions about the data into charts. When a dataset and drawing specification is provided to produce, seaborn will automatically map the data values to visual attributes such as colour, size, or style, and calculate statistical transformations internally. Seaborn is designed to play a role throughout the life cycle of scientific projects. By generating complete graphs from a single function call with minimal parameters, seaborn can easily and quickly build prototypes and analyze exploratory data. By providing a wide range of customization options, in addition to exposing the underlying matplotlib objects, it can also be used to create polished shapes and visuals.
Users interact with seaborn through a number of drawing functions. These drawing functions share common APIs for drawing specifications and provide many more specific customization options. These functions range from basic drawing types, such as scatter plots and line graphs, to functions that apply various transformations and abstractions, such as histogram fusion, kernel density estimation, and regression model fitting. Functions in seaborn are categorized as “axis level” or “figure level”. The behaviour of the Axes level function is similar to most plot functions in matplotlib-pyplot namespace. By default, they are linked to a state machine that tracks the “current” figure and appends a layer to it, but they can also accept objects from the matplotlib axis to control the position of the graph, similar to using matplotlib’s “object-oriented” interface. The Figurelevel function creates its own graphs when called, allowing them to “facet” the dataset by creating multiple conditional subplots and adding conveniences, such as placing the legend outside of the graph space by default. Each figure level function corresponds to several axis level functions for similar purposes, using a parameter to select the type of drawing to be performed. For example, the displot function can generate several different distribution representations, including histograms, kernel density estimates, or empirical CDFs. The figure level function utilizes a seaborn class to control the layout of the figure and mediate between the axis layer function and matplotlib. These classes are part of the public API and can be used directly in advanced applications.
Seabron is one of the most widely used python libraries. With Seaborn we can visualise both univariate and bivariate data. It provides rapid, detailed and accurate graphics. It has built-in functions and themes for embellishing the plots, plus has an edge over matplotlib. Seaborn is a complement to matplotlib. This library is easy to comprehend and implement (Fig. 4).

Plotting a heatmap using Seaborn
2.5 Scikit
Scikit-learn is one of the most beneficial and a key python library which is a structured tool for machine learning and statistical modelling. It is an open-source and commercially available software. It is capable of performing numerous statistical, data mining and data analysis operations like- Classification, Clustering, Regression. Scikit-learn is straightforward in design, efficient and is easily approachable through non-experts. It first emerged through David Cournapeau as a Google summer time season code project in 2007. Fabian Pedregosa, Gael Varoquaux, Alexandre Gramfort and Vincent Michel, from FIRCA, took this project to the next possible degree and made the primary launch in 2010.
The features of the package Scikit-learn are:
Supervised Learning Algorithms—Nearly all supervised learning algorithms like, linear regression, Decision Tree, SVM (Support Vector Machine) belong to Scikit-learn. These algorithms help to estimate the outcomes for unforeseen data.
Unsupervised Learning Algorithms—This library also includes very popular unsupervised learning algorithms of clustering, PCA (principal component analysis), factor analysis which helps in performing more complex processing tasks [8]. It allows the model to work on its own, without any supervision and discover information and data.
Cross Validation—It is used to verify the accuracy of supervised models on unseen data and helps in estimating the performance of models.
Feature Extraction—It is used to extract features from the data consisting text and images in formats supported by machine-learning. It includes functions like-DictVectorizer(), feature_name, CountVectorizer() and many more.
Feature Selection—This module is used to recognize useful attributes to create supervised models. Feature selection methods are used for simplification of models, improve data compatibility, and make the data easier for the users to interpret.
Dimensionality Reduction—This is used to reduce the attributes in the data for feature selection, summarisation and visualization. The transformed low-dimensional space retains important features of the original data and is convenient to analyze and process using machine learning techniques. This can be done using the PCA functions like-PCA (n-components, svd_solver), pca.fit().
Scikit-learn uses an enormous and substantial variety of machine learning algorithms. It supports machine learning in python and allows to build various machine learning models for predicting and deciphering abstract, unorganised and unexpected data. Scikit-learn is a set of successfully implemented machine learning algorithms that is well-documented and maintained by the community [9]. It is a useful tool to process large to small scale data. Both supervised and unsupervised learning methods can be adopted by using well suited and task-based interfaces. This enables assessment of methods and strategies for a given application (Fig. 5).

Basic program for linear regression using SciKit learn
2.6 TensorFlow
Tensors are groups of data with an arbitrary number (zero to infinity) of dimensions. They can be arranged in scalars (dimensionless), vectors (unidimensional), matrices (2 dimensional), cubes (3 dimensional), sets of cubes (4 dimensional) and so on. TensorFlow is a platform for solving machine learning algorithms, and an implementation for such algorithms [10].
The flow of information between various tensors is controlled by thousands of parameters. In a neural network, elements in one tensor are bound to elements in the next. Tensor Algebra deals with this information flow between the various tensors.
The TensorFlow open-source software library is a collection of tools developed by Google for numerical computation. It is commonly used by IT firms and giants to perform various computational tasks. Its library can be executed on various platforms, such as mobile platforms and distributed systems with very little or no modification [11].
A few salient features of the TensorFlow framework are as follows:
-
1.
Python is the language of choice for Theano and TensorFlow. Mx Net also consists of some useful Python APIs. TensorFlow and Theano are very similar when it comes to Deep Learning systems, however TensorFlow is preferable for distributed systems as it has better support for them [12].
-
2.
TensorFlow uses Automatic Differentiators which are different from numeric and symbolic differentiation. Automatic differentiators are very useful and efficient in neural networks and can be easily understood using the simple chain rule of differentiation.
-
3.
TensorFlow is compatible with various platforms like Android, IOS, Cloud as well as architectures such as CPU and GPU. TensorFlow applications can easily be executed on these platforms and architectures. This is primarily due to the ability of TensorFlow to train neural models using its own designed hardware known as TPU’s (TensorFlow Processing Units)
-
4.
TensorFlow is very proficient in data abstraction. A defined view level is available for the user so that the programmer does not have to focus on the procedure to provide or receive inputs, rather more emphasis is given on understanding and implementing the logic behind the problem statement.
-
5.
TensorFlow is more effective to implement deep-learning models as the data structure tensor allows this framework to work with multidimensional arrays. A tensor can be categorized using the attributes rank, type and shape. [13] All tensors are immutable i.e., once some data is stored in a tensor it cannot be changed. To store new data, we need to define a new tensor all together (Fig. 6).
Fig. 6 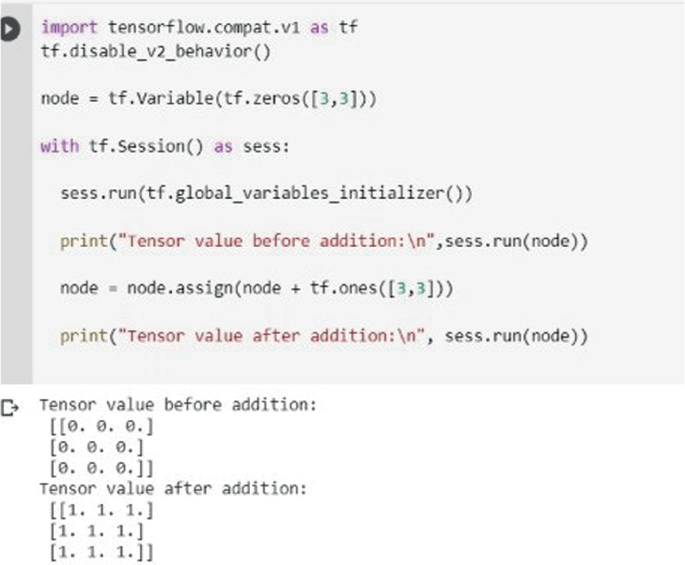
Demonstrating matrix addition using TensorFlow

2.7 Keras
Keras is a Python-based deep learning framework that makes it simple to design and train nearly any deep learning model. It is a high-level neural network API that can be used with Tensorflow, Theano, and CNTK. It was created to allow for quick experimenting.
Keras relieves developer cognitive strain, allowing you to focus on the most important aspects of the problem.
The Keras principle of progressive disclosure of complexity states that simple processes should be quick and straightforward, whereas arbitrarily sophisticated workflows should be feasible via a clear route that builds on what you've already learned.
Keras is utilised by organisations and enterprises like NASA and YouTube to deliver industry-leading performance and scalability.
Keras has the following features
-
1.
Convolutional and recurrent networks, as well as a mixture of the two, are supported.
-
2.
It can handle a wide range of network architectures, including multi-input and multi-output models, layer and model sharing, and so on. As a result, Keras may be used to create deep learning models ranging from generative adversarial networks to a neural Turing machine.
-
3.
Keras is a modular design. A model in the form of a graph or a sequence is considered. Keras gives you the option of saving the model you’re working on.
-
4.
Keras comes with a huge dataset that has been pre-defined. It gives you access to a range of datasets. You may use this dataset to import and load it directly.
-
5.
Keras includes a number of models that have already been trained. Keras may be used to import these models. Applications. These models are useful for extracting features and fine-tuning them.
-
6.
Keras is a Python library in its entirety. It employs all of Python’s well-known ideas. It is a library built in the Python programming language. Keras delivers a user-friendly environment because it is Python-based.
-
7.
Keras includes a number of functions for data pre-processing.
Keras is a human-centric API, not a machine-centric API. Keras adheres to best practises for decreasing cognitive load by providing consistent and straightforward APIs, minimising the amount of user activities required for typical use cases, and providing clear and responsive feedback in the event of user error.
Keras is thus simple to understand and use. As a Keras user, you are more productive, allowing you to attempt more ideas than your competition, faster, which helps you win machine learning competitions.
This simplicity does not come at the expense of flexibility: because Keras integrates strongly with low-level TensorFlow capabilities, it allows you to create highly hackable workflows in which any piece of functionality is customizable. Keras makes it simple to convert models into final products.
Keras uses a strong and clear deep learning library built on top of TensorFlow/Theano to give high-level neural networks. Keras is an excellent addition to TensorFlow because its layers and models work with pureTensorFlow tensors [14].
Keras is simple to understand and use as a result of this. Keras users are more productive, allowing them to test more ideas faster than their competitors, which helps them win machine learning contests.
Keras is a human-centric API. Keras adheres to best practices for minimizing cognitive load, such as providing consistent and straightforward APIs, decreasing the number of user steps necessary for typical use cases, and providing clear and responsive feedback in the event of a user error.
2.8 Theano
Python is a potent and pliant programming language for machine learning and in addition involves plenty of complex mathematical calculations, algorithms, arithmetic computations and mainly large matrices of multiple dimensions. To build such complex machine learning algorithms and to advance the mathematical expressions Theano is a structured and ideal python library. This library can be run on CPU or GPU [15]. It is an open source software and released under a BSD license. For building different algorithms and codes Theano requires mainly the support of Numpy, SiPy, BLAS.
Features of Theano
Theano permits to define, optimize and evaluate mathematical expressions. It efficiently facilitates the development of Machine Learning models. Generating computational graphs is a key feature of Theano which helps in expressing and calculating a mathematical expression. There are also various data types in Theano like- Scalers, Tensor, Matrix, Vectors, Arrays, Plural Constructors, Complex, Double, Float, Byte, 16-bit integers, 32-bit integers and 64-bit integers. These data types are used in Theano with proper and structured syntax. It also involves variables and shared variables. Theano functions are bridges for interacting with symbolic graphs. Some parts of the code are compiled in C. The compiled code is then provided input to Theano function [16]. In this way an optimum code is executed. But creating complex set of codes and algorithms using Theano is possible due to-
-
Stability Optimization- Theano is not just used for integrating mathematical expressions but can be used also to stabilize the unstable expressions in order to get optimum results.
-
Faster Execution Speed- Theano utilizes current GPU’s and can execute the expressions much faster. Plus it produces dynamic C code which helps in evaluation of expressions faster.
-
Symbolic Differentiation- Theano is capable of automatically generating symbolic graphs for computing gradients. It performs derivatives of functions with one or many inputs.
Building Machine Learning models incorporates rigorous and complex computations. For this Theano is an excellent platform. It is a beneficial tool to enhance the execution time and perform repetitive computations of mathematical expressions. It can be used for deep learning and solving real-world problems. Theano is well developed and accepted world-wide by industries and academics (Fig. 7).

Demonstrating matrix multiplication using Theano
2.9 PyTorch
Traditionally, deep learning frameworks have prioritised either usability or speed, but rarely both. The machine learning toolkit called PyTorch demonstrates that these two aims may coexist. PyTorch provides an imperative and Pythonic programming language that allows code as a model, makes debugging easy while being efficient and enabling hardware accelerators such as GPUs. PyTorch, like Python, is a fantastic introduction to deep learning as well as a tool that can be used in sophisticated real-world applications [17].
Facebook, Inc. created PyTorch, an open source machine learning and deep learning library. It’s Python-based, as the name implies, and attempts to be a faster NumPy alternative [17].
Uber’s Pyro probabilistic programming engine is built on it. Using the same core C libraries for the backend code as Torch, PyTorch re-designs and implements Torch in Python using the same C libraries. To make Python run as efficiently as possible, PyTorch engineers optimised the backend code. Lua-based Torch retained the GPU-based hardware acceleration as well as the extensible capabilities that made it famous.
PyTorch key features
-
Front-end: Using PyTorch, a user-friendly and flexible front-end is created, which seamlessly transitions from diagram format to C++ execution contexts for speed, optimization, and operability.
-
Dispersed training: C++ and Python provide native asynchronous implementation of cooperative processes and peer-to-peer communications, which improves speed in both exploration and production.
-
Tools and libraries: Scientists and innovators have collaborated to create an extensive network of tools and libraries to help disseminate PyTorch and advance research in fields such as Reinforcement Learning.
-
Cloud partners: PyTorch is extremely well supported on the most popular cloud platforms, enabling not only frictionless development but also stress-free scaling with large scale preparation on GPUs, the ability to track models in a construction scale setting etc.
-
Programming: Every time PyTorch reads a line of code, it does computations. In many ways, this is the same as running a Python application. Imperative programming is a term used to describe this type of programming. It also has the advantage of making it easier to debug and programme the logic.
-
Dynamic Graphing: It is said that PyTorch is defined by run, which implies that execution time is when the real computation graph for neural network design is generated. However the major value of this characteristic is that it provides an elastic and programmable execution interface, which makes it possible to create or modify whole system structures through the use of process-linking techniques. PyTorch is a great framework for creating dynamic computing graphs, which may be modified during operation. If you don’t have the memory to create a neural network model, this can be incredibly helpful. A new computational graph is created at each PyTorch advancing pass. TensorFlow's approach is significantly different. Inventors are often faced with reworking, training, adaptability, and scalability problems. All of these duties take a lot of time, and they demand a lot of work. This is why PyTorch was created to assist innovators and researchers in these fields with its sophisticated capabilities.
-
By combining an emphasis on usability with thorough performance considerations, PyTorch has become a popular tool in the deep learning research community. Pytorch offers a lot of customizability with minimum code, in addition to continuing to support the newest trends and developments in deep learning. While it may be difficult to grasp how the entire ecosystem is organised using classes at first, it is ultimately just Python (Fig. 8).

Basic operations on tensors using Pytorch
2.10 NLTK
Processing and understanding human language data are crucial for any interactive AI to function properly, provide more value and solve problems. NLP (Natural Language Processing) is a domain that focuses on understanding, processing and implementing human language data effectively to solve real world problems by ensuring that the computer–human interaction takes place smoothly. NLTK is implemented as a large collection of minimally interdependent modules, organized into a shallow hierarchy [18]. The Natural Language Toolkit (NLTK) was created in 2001 at the University of Pennsylvania in connection with a computational linguistics course. Assignments, demonstrations, and projects were the three pedagogical uses in mind when it was created.
NLTK (Natural Language Toolkit) is a python package which is predominantly used for NLP. NLTK preprocesses unstructured data containing human language references using computational linguistics, NLP data types and animated algorithms. NLTK also provides problem sets and tutorials to make the user familiar with this python library. Natural language processing functions are drawn up as transformations on Tokens [19]. NLTK is very beneficial for the students or programmers who are learning NLP or conducting research on the same topic.
Run the following instructions in your terminal to install NLTK
sudo pip install nltk.
Then, on your terminal, type python to launch the Python shell and run the following instructions.
import nltk.
nltk.download(‘all’).
Since NLTK is completely written in python, it has the following features:
-
Easier and convenient to learn.
-
Exceptional at string-handling.
-
Well defined syntax.
-
Data encapsulation is possible and data can be reused multiple times.
NLTK Implementation:
-
Chatbots
-
Machine Translation
-
Speech Recognition
-
Text Summarization
-
Recommendation Engine
-
Sentiment Analysis for Customer Reviews
NLTK has been effectively utilised as a teaching tool, as a tool for individual study, and as a platform for prototyping and developing research systems. NLTK offers a simple, versatile, and consistent framework for assignments, projects, and class presentations. It’s well-documented, easy to understand and utilise. The most popular tool for teaching NLP is NLTK. It’s also commonly used as a prototype and research tool [20].
4 Conclusion
Python’s libraries, modules, and frameworks have made it very simple to implement Artificial Intelligence ideas. Python machine learning libraries have evolved into the most widely used language for building machine learning algorithms. Understanding Python is essential for building conceptual knowledge of Artificial Intelligence and specialising in it. Python libraries are crucial in developing machine learning, data visualisation, data science, image and data processing, and other applications. This paper properly discussed, compared, and emphasised the critical and necessary Python Programming Libraries involved in researching the vast topic of Artificial Intelligence.
References
Van Der Walt S, Chris Colbert S, Varoquaux G (2011) The NumPy array: a structure for efficient numerical computation. Comput Sci Eng 13(2):22–30
Harris CR, Millman KJ, Van Der Walt SJ, Gommers R, Virtanen P, Cournapeau D, Oliphant TE et al (2020) Array programming with NumPy. Nature 585(7825):357–362
McKinney W (2011) Pandas: a foundational Python library for data analysis and statistics. Python High Perform Sci Comput 14(9):1–9
N. Ari and M. Ustazhanov, “Matplotlib in python,” 2014 11th International Conference on Electronics, Computer and Computation (ICECCO), 2014, pp. 1–6, doi: https://doi.org/10.1109/ICECCO.2014.6997585.
Barrett P, Hunter J, Todd Miller J, Hsu J-C, Greenfield P (2005) matplotlib—a portable python plotting package
Ranjani J, Sheela A, Meena KP (2019) Combination of NumPy, SciPy and Matplotlib/Pylab—a good alternative methodology to MATLAB—a comparative analysis. In: 2019 1st international conference on innovations in information and communication technology (ICIICT)
Waskom ML (2021) Seaborn: statistical data visualization. J Open Source Softw 6(60):3021
Pedregosa F et al (2011) Scikit-learn: machine learning in python. J Mach Learn Res 12:2825–2830
Hao J, Ho TK (2019) Machine learning made easy: a review of Scikit-learn package in python programming language. J Educ Behav Stat. 107699861983224. https://doi.org/10.3102/1076998619832248
Abadi M et al (2016) Tensorflow: large-scale machine learning on heterogeneous distributed systems. arXiv preprint. arXiv:1603.04467
Girija SS (2016) Tensorflow: large-scale machine learning on heterogeneous distributed systems. Software available from tensorflow. org 39, no 9
Imambi S, Prakash KB, Kanagachidambaresan GR (2021) PyTorch. Programming with TensorFlow. Springer, Cham, pp 87–104
Goldsborough P (2016) A tour of tensorflow. arXiv preprint. arXiv:1610.01178
Manaswi NK (2018) Understanding and working with Keras. Deep learning with applications using python. Apress, Berkeley, CA. https://doi.org/10.1007/978-1-4842-3516-4_2
Team TTD et al (2016) Theano: a python framework for fast computation of mathematical expressions. arXiv preprint. arXiv:1605.02688
Bergstra J, Breuleux O, Bastien F, Lamblin P, Pascanu R, Desjardins G, Turian J, Warde-Farley D, Bengio Y (2010) Theano: a CPU and GPU math compiler in Python. In: Proceedings of the 9th python in science conference, vol 1, pp 3–10, 1–5. https://doi.org/10.1109/ICIICT1.2019.8741475
Ketkar N, Moolayil J (2021) Deep learning with python. https://doi.org/10.1007/978-1-4842-5364-9
Bird SG, Loper E (2004) NLTK: the natural language toolkit. Association for Computational Linguistics
Loper E (2004) NLTK: building a pedagogical toolkit in Python. PyCon DC 2004
Singh A, Ramasubramanian K, Shivam S (2019) Building an enterprise chatbot: work with protected enterprise data using open source frameworks. https://doi.org/10.1007/978-1-4842-5034-1
Acknowledgements
This paper on ‘Analysis of Python Libraries for Artificial Intelligence’ has been possible only because of kind cooperation lent by our teacher and project guide Dr. Anand Khandare without which this would not have been possible. We would also like to thank our parents, who have provided us with all possible resources to gain the best possible knowledge.
Author information
Authors and Affiliations
Corresponding author
Editor information
Editors and Affiliations
Rights and permissions
Copyright information
© 2023 The Author(s), under exclusive license to Springer Nature Singapore Pte Ltd.
About this paper

Cite this paper
Khandare, A., Agarwal, N., Bodhankar, A., Kulkarni, A., Mane, I. (2023). Analysis of Python Libraries for Artificial Intelligence. In: Balas, V.E., Semwal, V.B., Khandare, A. (eds) Intelligent Computing and Networking. Lecture Notes in Networks and Systems, vol 632. Springer, Singapore. https://doi.org/10.1007/978-981-99-0071-8_13
Download citation
DOI: https://doi.org/10.1007/978-981-99-0071-8_13
Published:
Publisher Name: Springer, Singapore
Print ISBN: 978-981-99-0070-1
Online ISBN: 978-981-99-0071-8
eBook Packages: EngineeringEngineering (R0)