
Abstract
The energy systems of major countries are transitioning toward clean, low-carbon and intelligent solutions to combat climate change and environmental pollution. The goal to build a new electricity-centered energy supply infrastructure that progressively evolves toward an energy internet that integrates the exploitation, transmission, distribution and consumption of electricity has become a global consensus and object. It is expected that in the future, with continued innovations in power generation, transmission grid system, load and energy storage, and advances in information and communication technology, the structural pattern of the power system will undergo drastic changes. The future transition and development of the power system will be characterized by a high share of renewable energy in the grid, prevalent application of power electronic equipment, multi-energy complementarities and integrated energy utilization, and an intelligent grid network and energy internet with deeply integrated cyber-physical systems. This chapter is dedicated to examining the transition and development of the power system in the three main links of power supply, transmission grid and load. The trends of technological development are analyzed and suggestions on polices and measures to accelerate the transition are proposed.
Access provided by Autonomous University of Puebla. Download chapter PDF
Keywords
- Transition development
- High share renewable energy (HSRE)
- Multi-energy complementarities and integrated energy utilization
- Deeply integrated cyber-physical system
4.1 Background and Challenges of China’s Power System Transition
4.1.1 Drivers of Power System Transition in the Era of Energy Revolution
Since the turn of the twenty-first century, the booming Chinese economy and subsequent soaring energy demands have produced mounting pressure of resource depletion and environmental degradation. In light of the challenges, President Xi Jinping called for an energy revolution in June 2014 in a bid to reduce energy consumption, increase energy supply, boost technology innovation and step up international cooperation. Pledging that China would “promote a revolution in energy production and consumption, and build an energy system that is clean, low-carbon, safe, and efficient”, the Report to the 19th Party Congress delivered a clear path forward for the development and reform of China’s energy sector.
The global call for environmental protection and sustainable development has also turned the spotlight on greenhouse gas emissions from the production and consumption of energy. On September 3, 2016, Standing Committee of China’s National People’s Congress adopted the proposal to review and ratify Paris Agreement. Under the framework of the agreement, China outlined a set of ambitious INDCs (Intended Nationally Determined Contributions): (1) cut CO2 emissions per unit of GDP by 60–65% from the 2005 level by 2030; (2) increase non-fossil fuels in primary energy consumption to roughly 20% by 2030; (3) China’s carbon dioxide emission will peak by around 2030 and the country will work hard to achieve the target earlier; (4) increase forest carbon stock by around 4.5 billion cubic meters from the level in 2005. The four targets articulate China’s commitment to the world, and would underpin the country’s transition in energy production and consumption. The proportion of non-fossil-fuel energy (mainly including renewable energy such as hydro, wind, and solar) in primary energy consumption represents a key metric in assessing energy transition.
To recapitulate, the primary goal of China’s energy revolution is to gradually replace fossil fuels by renewables, increase the share of renewable and other clean energy sources in primary energy production and consumption, promote energy transition, and build a new-generation energy system that is clean, low-carbon, safe and efficient (Zhou et al. 2018). Since the power system is closely associated with the transmission and consumption of renewables, it’s crucial for the fulfillment of core targets of energy transition. In this connection, the transition must be driven by technological development and innovation. The pursuit of clean development has brought greater diversity to the development of power systems where power supply, grid network, load and storage have witnessed profound changes. The deep integration of information and communication technologies (ICT) and physical systems has also emerged as a key trend. Meanwhile, the future blueprint of Energy Internet, an upgrade of smart grid, is being increasingly and widely embraced by the energy sector.
4.1.1.1 New Trends of Power Development Triggered by Global Energy Transition
The energy systems of major countries are transitioning toward clean, low-carbon and intelligent solutions to combat climate change and environmental pollution. The target to build a renewable power-based energy supply infrastructure that progressively evolves toward an energy internet that integrates exploitation, transmission, distribution and consumption of power has become a global consensus. It is expected that in the future, with continued innovations in power generation, grid system, load and energy storage, and advances in ICT, the structural pattern of the power system will undergo drastic changes.
A number of countries have rolled out plans for technological development in the energy sector in recent years, including the Comprehensive Energy Strategy of the US, the EU’s Energy Roadmap 2050, the National Energy and Environment Strategy for Technological Innovation Towards 2050 by Japan, South Korea’s Clean Energy Technology Roadmap and China’s Energy Innovation Action Plan (2016–2030), Energy Technology Revolution Key Innovation Action Roadmap and the 13th Five-year Plan on Scientific and Technological Innovation. Technological innovation for the utilization of clean and low-carbon energy resources has become the “holy grail” of energy development in all countries, who have devised plans to underscore the centrality of renewables in energy supply of the future (Lu et al. 2017).
The international energy landscape has been dramatically adjusted. The fast-track development of unconventional oil and gas, spearheaded by the shale gas revolution in the US, had reshaped the traditional energy supply chain. The increasing maturity of renewable energy technologies has ushered in, quietly and assuredly, the era of energy transition and heralds a paradigm shift in the energy system. What’s more, a new wave of Industrial Revolution, driven by big data, artificial intelligence and the Internet of Things, will propel the deep integration of the energy industry and the Internet. On the whole, four trends—decarbonization, electrification, decentralization and digitalization—are steering the transformation of energy and power sectors.
4.1.1.2 Transition of Domestic Power Sector in the Era of the Energy Revolution
At the historic intersection of the Energy Revolution and the Fourth Industrial Revolution, China remains firmly committed to the notion of green, low-carbon, clean and efficient sustainable energy development, and has actively enforced and revised its medium- and long-term energy technology strategies to cater to the evolving needs of ecological sustainability and national energy security.
The Strategy of Energy Production and Consumption Revolution (2016–2030) (hereinafter referred to as the Strategy), issued by the National Development and Reform Commission (NDRC) and the National Energy Administration (NEA) on December 29, 2016, set out the medium- and long-term strategic goals of China’s energy revolution. The Strategy stated that: (1) China aims to keep energy consumption within equivalent to 5 billion tons of standard coal by 2020, non-fossil energy will account for 15% of primary energy consumption, and natural gas will make up at least 10%; (2) China will keep energy consumption within equivalent to 6 billion tons of standard coal between 2021 and 2030, non-fossil energy will represent roughly 20% of primary energy consumption, natural gas 15%, and 50% of power generation will be derived from non-fossil sources; (3) by 2050, total energy consumption will be basically stable and non-fossil energy will contribute over 50%.
It can be seen that the rising share of non-fossil fuels in primary energy consumption and the ensuing energy transition hold the key to China’s energy revolution. The goal of delivering 50% of the power through renewables by 2030 stated in the Strategy serves as a key benchmark for the future development of China’s power system, and something that must be accommodated in developing the country’s new-generation power system.
The share of non-fossil fuels in primary energy consumption is a core metric for China’s energy transition. Electricity is a secondary energy source derived from the primary energy sources. Power generated from non-fossil fuels hit 1.5 trillion kWh in China in 2015. Given that the average amount of coal consumed for thermal power generation in the year stood at 315 g/kWh, total primary energy consumption for power generation would amount to 472.5 million tons of standard coal equivalent (tce), or 11% of the 4.3 billion tce consumed in the whole year, just 1 percentage point of the national share of non-fossil fuels in primary energy consumption (12%) in the same year. In 2016, power generated from non-fossil fuels grew to 1.7 trillion kWh. Given that the average amount of coal consumed for thermal power generation in the year stood at 312 g/kWh, primary energy consumption for power generation would total 530.4 million tce, or 12.3% of the 4.36 billion tce consumed in the whole year, which was also 1 percentage point short of the national share of non-fossil fuels in primary energy consumption (13.3%) in the same year. The conversion of nearly 90% of the non-fossil fuels into electricity has cemented the dominant position of power in the use of non-fossil fuels in primary energy consumption in China, spurred the production and consumption of the country’s non-fossil energy, and invigorated the strategic transition of its energy system. Therefore, a marked increase in the share of power from non-fossil fuels and the formation of a non-fossil-centric power mix would underpin China’s energy transition, and stand as a tangible testament to the country’s power transition and the development of a new-generation power system.
The EU, the US and China have outlined their blueprint of 100%, 80% and 60% renewable power system respectively by 2050. The power system will undergo major shift under the new scheme. Randomly fluctuating solar and wind energy will constitute the bulk of power generation, baseload power plants will gradually bow out of the stage, and conventional thermal generation units will adopt a daily start-and-stop regime. In the meantime, gas-fired stations, pumped-storage hydro power plants and energy storage devices will be utilized to compensate for the random fluctuations of weather-driven renewable energy. Flexibility will be at the heart of the planning and operation of power systems.
The overriding trend at the source side is the shift toward a clean power supply. The booming development of renewable sources such as wind and solar (over 30% of local power generation), full development of hydropower, the re-positioning of thermal power for peak load shaving, and the steady development of nuclear power will contribute to a new and sufficiently clean power supply.
Power electronization of the grid is a rapidly accelerating trend. Long-distance transmission and on-site balanced power supply work in tandem as local conditions demand. Hybrid AC/DC grid is widely used. A range of new equipments in the distribution networks are emerging and technologies for DC distribution are being developed at a breakneck pace.
There is multiple uncertainty in terms of electric load. The emergence of distributed generations, electric vehicles, distributed energy storage and bidirectional load have brought out the interactive and dynamic nature of the entire power system comprised of power source, grid, load and storage. Uncertainty has become the core issue facing the planning and operation of power system.
4.1.2 Trends and Key Technologies of China’s Power System Transition
4.1.2.1 The Trends of China’s Power System Transition
The development of power systems in the past decade and, more specifically, the rapid adoption of wind and solar photovoltaic in electricity generation, the massive construction of UHV DC lines under the West-East Electricity Transmission Project, and the rise of distributed generations located on the consumers’ side, multi-energy complementarities for integrated energy utilization and the energy internet exemplify the technological characteristics of the new-generation power system. A high share of renewables in overall power production, the prevailing application of power electronics, multi-energy complementarities for integrated energy utilization, a smart grid and energy internet featuring a high degree of cyber-physical integration are what distinguish the new-generation power system from its predecessors.
-
(1)
A high share of renewables in power generation
In 2019, new installation of grid-connected wind power capacity reached 25.74 million kW, of which 23.76 million kW originated from onshore wind farms and 1.98 million kW from offshore wind farms. At the end of 2019, the nationwide cumulative installed capacity of wind power amounted to 210 million kW, including 204 million kW from onshore and 5.93 million kW offshore. Wind power accounted for 10.4% of total generation installation. In 2019, China’s wind power production exceeded 400 billion kWh for the first time, reaching 405.7 billion kWh, or 5.5% of the country’s total electricity generation. The country added 30.11 million kW of new PV capacity in 2019, a year-on-year decline of 31.6%. Newly installed centralized PV capacity slid to 17.91 million kW, down by 22.9% year-on-year while newly installed distributed PV capacity surged 41.3% to 12.2 million kW. Cumulative installed PV capacity reached 204.3 million kW, up 17.3% year-on-year. Cumulative installed centralized PV capacity grew 14.5% to 141.67 million kW and that of distributed PV rose 24.2% to 63.63 million kW.
With the massive centralized grid-connection of renewable power, the technical challenge, first and foremost, is adopting wind and solar power into a weak grid. The issue is particularly acute in northwest China, where the grid remains vulnerable in spite of the 750 kV AC and multiple DC transmission lines. The ability of the grid to absorb the amount of variable power that comes from renewables remains a big headache. Specifically, the problem can be broken down into two parts. The first concerns the impact of wind and solar variability on power system stability in weak grids. Through the coordinated control of renewable generation units, power stations and clusters of stations, along with grid control, such problems as voltage fluctuations, power frequency variations and poor power quality can be addressed. The second concerns the need for peak and frequency modulation of power system stemming from the volatile, intermittent and uncertain nature of wind and solar power, as well as wind and solar curtailment. Wind power generators saw its worst curtailment in China in 2016, which totalled 49.7 billion kWh or 20% of the total amount generated. The province of Gansu topped the list with a 43% curtailment, followed by Xinjiang’s 38%. In the past few years, with the strengthening of government control over orderly planning and construction, the implementation of priority scheduling strategy for wind power and PV in the dispatching operation section, and the improvement of the technology of power forecasting and optimal operation by the wind farms and PV stations themselves, the expected goal of controlling the curtailment rate within 5% has been basically achieved.
Given the reality of grid in China, the following measures can be taken to reduce wind and solar power curtailment: (1) upgrade flexibility in power supply and storage. For instance, coal-fired power takes up 65% to 90% of the total output in north China, but the share of flexible resources such as pumped storage stations only made up somewhere between 0.5% and 1.2%. Flexibility in coal-fired power plants should be improved and energy storage stations should be developed to cope with wind and solar power curtailment; (2) encourage local consumption based on local conditions, including the placement of industries with high energy loads, district heating and surplus electricity to produce hydrogen and methane; (3) boost grid interconnectivity and complementarity between hydro, wind and solar power; (4) promote concentrated solar power (CSP); (5) build power transmission lines.
Apart from the above measures, new possibilities can be explored to address wind and solar curtailment as grids and power technology continue to evolve.
-
(2)
Power electronization of the power system
The new-generation power system will be characterized by the proliferation of power electronics, the most important of which is the UHV transmission system that has flourished in recent years. China, the global test bed for UHV transmission lines, had built nine UHV AC and ten DC lines by June 2019 and is building another three UHV AC and one DC lines. The total length of operating UHV lines in the country amounted to 27,570 km, and the total transformation (conversion) capacity stood at 296.2 million kVA (kW). By the end of 2019, China’s UHV lines had delivered more than 1.15 trillion kWh of electricity cumulatively, making tremendous contribution to stable power supply, clean energy development, environmental improvement and grid safety.
East and South China, the two major load centers where multiple DC transmission terminal stations are located, are the focus of the country’s UHVDC construction project. Technical challenges of system operation, such as the dynamic reactive power support in handling the commutation failure to a receiving-end grid with multi-DC lines feeding, and stable and coordinated control of sending and receiving-end in AC-DC hybrid systems, require further research for solutions.
Furthermore, with intensified development of renewable energy in western China and growing demand for west-east power transmission, clean power in China’s west will be produced through the complementarity across regions and river basins of diverse energy sources of hydro, wind and solar as well as from low-emissions coal plants with tremendous flexibility, and transmitted over long distances to load centers in east China, with renewables as the mainstay. The vision Zhou academician proposed to build a DC transmission grid on top of the existing west-to-east single-phase HVDC to supply energy from the west to the load centers in the east may very well become a reality (Zhou et al. 2013).
The demonstration project of four-terminal VSC-HVDC from Zhangbei to Beijing (see Fig. 4.1), which began construction at the tail end of 2017, will provide China with useful experiences for the construction of DC grids in the future.

Demonstration project of 4 terminal VSC-HVDC from Zhangbei to Beijing
On the other hand, with the development of renewable energy, a host of power electronic converters such as direct drive wind turbine converters, PV power plant and distributed PV inverters, non-hydro energy storage stations and distributed energy storage inverters, are now connected to the grid. In additional to centralized large wind and solar installations, more small-capacity, distributed wind and solar power systems are being implemented. At present, wind and solar power curtailment has hobbled the development of centralized wind and solar power in western China while distributed wind and solar generation has witnessed substantial growth in the central and eastern regions. Meanwhile, the ongoing poverty alleviation project by installation of solar PV panels in poor households has also dramatically increased the amount of power electronic equipment connected to the grid.
As a rising number of power electronic equipment of various types and voltage levels are connected to the grid, the increasing power electronization of China’s power system will lead to a range of challenges in such areas as operation safety, system analysis and control, and simulation modeling and calculations. They include:
-
1.
Prevent large-scale power shift and cascading failures that can propagate across the AC-DC transmission systems as the result of a fault in the receiving-end of DC power transmission system.
-
2.
The problem of voltage instability triggered by the restart following commutation failure in multi-feed DC receiving-end.
-
3.
The issue of frequency fluctuation and instability due to reduced system inertia.
-
4.
With an increasing number of power electronic devices such as for wind power solutions connected to the grid, broadband oscillations (1-kHz) are produced by the interactions among power electronics as well as between power electronics and the AC grid.
The analysis, simulation and control of subsynchronous or high-frequency oscillations sparked by the integration and interfacing of power electronics to the grid will become crucial matters. The above-mentioned problems have presented new challenges to existing grid simulation and system analysis. In the future, with more connection of sophisticated power electronic devices to the grid on a greater scale, it will be even more difficult to manage the complexity of the grid. Therefore, more work needs to be done in the research of grid characteristics, the development of modelling and simulation technology and control measures to ensure the safe and reliable operation of China’s AC/DC hybrid power system.
-
(3)
Integrated energy and power system with multi-energy complementarities
The new-generation power system has evolved along with China’s energy transition. It will no longer be an isolated system of power production and consumption, but main part of the larger new-generation energy system of the country and an expansion and upgrade of the smart grid notion toward a comprehensive energy system. Such a system can be further subdivided into two types based on the reality of integrated energy utilization in China:
-
1.
Source-end integrated energy system. The western region of China is blessed with an abundant supply of various forms of renewable energy resources, promising enormous potential for energy production. However, due to spacial limitations of power transmission and other technical constraints, the capacity of the West-East power transmission project has been held below 600 million kW. While local consumption of power should be maximized, a great amount of electrical energy must also be converted into other forms of energy for storage and transportation. Therefore, the establishment of a source-end integrated energy system in China’s northwest is imperative. Such a system will allow for complementarities among hydro, wind, solar and clean coal to transmit power to the central and eastern parts of the country through a DC transmission grid; greater local consumption through heating, cooling, industrial consumption and other means; and production of hydrogen and methane by electrolysis for local consumption as well as for eastward transmission through natural gas pipelines.
-
2.
Consumption-end integrated energy system. Serving primarily the eastern parts of China, the system aims to enhance energy efficiency and bring down total energy use. At present, thermal power generation remains the dominant source of electricity in China, with a thermodynamic efficiency of between 30 and 40%, calling for an integrated energy system to upgrade energy efficiency. The system is mainly comprised of a clean energy-based regional integrated energy system that caters to the diverse needs of users, distributed energy systems that directly interface with various types of end users under the active distribution network as well as a multitude of energy storage and renewable energy microgrids. The combined cooling-heating-power (CCHP) system based on natural gas and clean power is shown in Fig. 4.2, and the user-oriented integrated energy system architecture is shown in Fig. 4.3.
Fig. 4.2 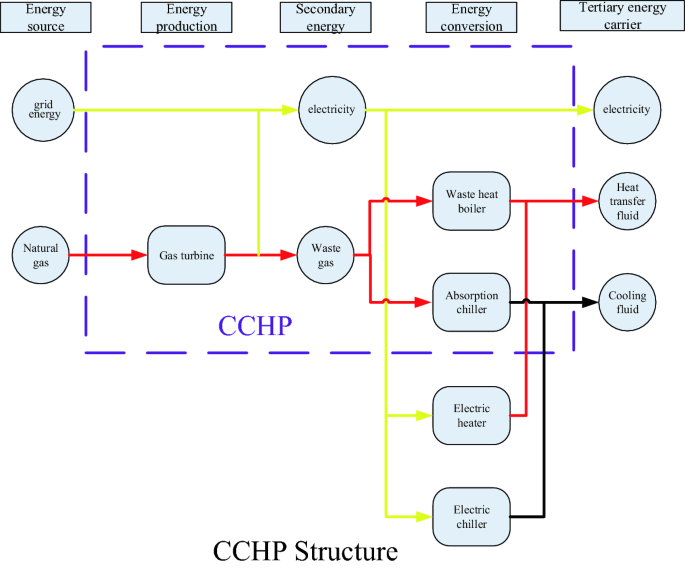
Combined cooling heating and power system (CCHP)
Fig. 4.3 
User-oriented integrated energy system architecture


-
(4)
An intelligent power system and energy internet featuring deep cyber-physical integration
The pace of progress in the ICT industry has prompted gradual integration of various energy systems and Internet technologies to create an energy internet where information and energy interact at a level never seen before. If one examines the traditional power system through the lens of the Internet, one can see that the way the centralized and distributed power sources are connected to hundreds of millions of households through massive interconnected transmission and distribution networks is naturally characterized of networks. In fact, the end-users of traditional power systems have long enjoyed “plug-and-charge” without needing to know which power plant is supplying the electricity. The way electricity is consumed is typical of the open and shared nature of the Internet. On the other hand, an examination of the traditional power system through the lens of the Internet also reveals a lack of flexibility and storage options, ineffectiveness in integrating concentrated and distributed renewable power into the grid, inability to support multiple energy conversions or the mutual conversion and complementarities between various forms of primary and secondary energy sources, and bottlenecks to the improvement of integrated power efficiency and renewable energy utilization. The centralized and unified management, dispatching and control mechanisms of the traditional power system are not suited to large-scale distributed power generation, nor does it align with the trend of energy systems integration for efficient power utilization.
The energy internet formed through the interconnection of intelligent power systems with deep cyber-physical integration and multiple energy production and consumption networks including transportation, heating and fuel networks (see Fig. 4.4) on the basis of smart grid is characterized by the following three properties:

Energy internet architecture
-
1.
It’s an energy network built around the core of power system featuring a variety of interconnected energy sources. Through the coordinated utilization of multiple energy sources and leveraging their complementarities, the diverse energy demands of end-users are met and integrated energy efficiency is significantly improved.
-
2.
It’s a cyber-physical system with the deep integration of the energy system and Internet technology. Internet-based thinking and technology are employed to transform traditional power systems. The pervasive application of big data, cloud computing and the Internet of Things can greatly enhance the flexibility, adaptability, intelligence, operational and management capabilities of power systems, upgrade the grid’s ability to absorb volatile power generation from renewables, and facilitate energy transition.
-
3.
It operates on a business model and service approach that centered around the users, provide them with a portfolio of convenient and interactive energy, power and information services. While meeting energy needs of users, it seeks to create more value for users and boost the market-oriented development of the energy sector and related industries.
In conclusion, the further integration of traditional power system and Internet of information, the transformation of the traditional power system through Internet-based thinking and technology, and the building of an energy internet are instrumental to developing the new-generation energy system, and where the development of the new-generation power system is headed. In fact, the new-generation power system is at the very heart of the new-generation energy system. The concept and system architecture of the energy internet are highly compatible with the new-generation energy system. Power is at the kernel of energy internet services while the smart grid provides the key platform where the needs of consumers are met to the greatest extent.
4.1.2.2 The Main Drivers of the Transition of China’s Power System
The transition and development of China’s power system are primarily driven by three factors, namely communal drivers, market drivers and technical drivers, as shown in Figs. 4.5, 4.6 and 4.7.

Communal drivers of electrical power system evolution

Market drivers of electrical power system evolution

Technical drivers of electrical power system evolution
Communal drivers are chiefly the product of strategic needs at the national level and can be divided into four overarching domains—modernization, resource and environmental constraints, climate change and low-carbon economy, and national security.
The strategic needs of industries and enterprises are the linchpin of the market drivers, which can also be broken down into four domains, namely market-oriented reform, the optimization of the energy system, the outward influence, catalytic effect and clustering of industries, and development and evolution of the modern enterprise system.
The technical drivers are primarily derived from the technical challenges and opportunities facing the development of power systems. The current technological hotspots include ICT and the Internet of Things, clean energy and energy storage, non-fossil fuel energy for transportation and new materials (with the focus being on advanced power electronics, superconducting power transmission and etc.).
The various drivers of electric power system evolution differ in both the amount of force applied and the way in which change is exacted under different temporal and environmental contexts. The evolution occurs from the inside out when it is driven by technical factors. The changing of the guard between old and new technology and the improvement of key technical indicators result in a gradual and highly predictable form of evolution. On the contrary, changes prompted by external, communal drivers, which are forceful and radical in nature, may lead to a complete unpredictable reconstruction of the entire system. Market drivers straddle in between the two in terms of how they initiate change in the electric power system. On the one hand, market-oriented reforms contribute to restoring the qualities of electricity as a commodity and the optimal allocation of resources. On the other hand, the grid as a social infrastructure and public service is characterized as a natural monopoly and will not be entirely profit-driven.
4.1.2.3 Key Technologies for Promoting the Transition and Development of the Power System
The development of the power system moves in lockstep with technological progress. The following technologies may have disruptive impacts on the new-generation power system.
-
(1)
Efficient and low-cost solar and wind power generation and grid-friendly technologies
The large-scale development and application of such technologies will displace the traditional methods of power generation, consign fossil energy-based power to the dungheap of history and revolutionize the production and consumption of energy. In fact, with the development of related technologies since 2000, the levelized cost of energy (LCOE) of large-scale terrestrial PV projects has dropped by 85% over the entire life cycle. In the meantime, according to the US Department of Energy (DOE), the LCOE of PV will be cut to 3 ¢/kWh by 2030. The planning and construction time for renewable energy projects is short, relative to other forms of energy such as thermal, hydro and nuclear power installations. The construction period for 50 MW wind power project is roughly several months while that for MW-level PV plants is less than half a year. Therefore, if significant cost reductions occured, the share of renewable energy capacity will grow rapidly.
-
(2)
High-efficiency, low-cost and long-cycle life energy storage
The large-scale application of such technologies will revolutionize how traditional power systems operate, usher in a new form of power generation and distribution, and lay the foundation for the new-generation power system powered by a high percentage of or even 100% renewable energy. The average cost for lithium iron phosphate batteries stood at roughly 3000 yuan/kWh in 2015, and is expected to drop to just 1000 yuan/kWh in 2020. The energy storage cost of lithium ion batteries was close to 0.65 yuan/kWh in 2016, and is set to be reduced to 0.12 yuan/kWh in 2030. The notable reduction in the cost of energy storage solutions will overcome renewable variability. In addition, it is expected that by 2030, ultra-high density batteries such as lithium-air batteries will reach energy densities of 8–10 kWh/kg (calorific value of petrol 5.94 kWh/kg). Such ultra-high energy density storage technologies will transform the way electricity is generated, transmitted, distributed and consumed.
-
(3)
Power electronics with higher reliability and lower losses
The uptake and application of such technologies will gradually displace the traditional AC-dominated transmission and distribution network and set the stage for a new system characterized by the coexistence of DC and AC/DC hybrid transmission and distribution. On the one hand, the development of Wide Band Gap power semiconductor devices such as SiC and GaN will drive HVDC transmission and DC grids to achieve greater capacity, efficiency and reliability. The HVDC circuit breakers based on WBG devices are also a main component of the DC power grid. On the other hand, the connection to the grid of a new generation of FACTS devices and power routers with greater power density and lower losses will assist in the construction of DC distribution networks. As power converters for microgrids, they will also bring revolutionary changes to low-voltage active distribution networks and microgrids.
-
(4)
High-strength low-cost environment-friendly insulation and superconducting power transmission technology
The development and application of such technologies will transform traditional transmission lines and equipment. Among them, the development of insulation materials with high dielectric strength, high non-linearity, resistance to heat and cold and high voltage tracking resistance can improve the long-term safety of equipment, contribute to the miniaturization of electrical components, significantly enhance the performance of electrical devices and help achieve environmental sustainability. New superconductor technology will provide a brand-new low-loss, large-capacity, long-distance power transmission solution for the power grids of the future. Meanwhile, superconducting fault current limiters and superconducting magnetic energy storage systems will measurably improve the safety and reliability of power grid operations.
-
(5)
A new generation of artificial intelligence
Built on the ubiquitous sensing and advanced ICT and with the Internet of Things, big data, cloud computing, deep learning and blockchain at the core, artificial intelligence is rapidly evolving with the potential to be applied in such fields as power system equipment management and system control, energy management and trading, and may reshape the traditional landscape to create a new future featuring automatic and autonomous processes, and lend a powerful hand in improving the safety, economy and reliability of the new-generation power system. For instance, the variability and uncertainty of solar power and the temporal and spatial uncertainties associated with EVs will introduce more variables into the equation. Traditional methods of analysis will meet a host of challenges in terms of scheduling, transaction and energy management, to which artificial intelligence will be able to provide new insights and solutions.
The development of these technologies will produce significant impacts on the future power system, how it operates and how transactions are conducted. Indeed, the development and application of these technologies are inextricably linked to market demand. So economics must be considered. Only technologies and equipment proven to be competitive in the market place will see broader application and continue to evolve down the path.
The development of the new-generation power system will be a long-term process. In this regard, new and meaningful technical trends may emerge during this process beyond the above-mentioned ones. Therefore, it’s essential to keep abreast of potential innovation, continue to embrace new technologies and make due adjustments to the system in a timely manner.
4.2 Research on China’s Power Generation Mix
4.2.1 The Evolution of China’s Power Generation Mix
Since the founding of the People’s Republic of China, especially in the four decades since the country embarked on reform and opening up, China has achieved remarkable social and economic success. In the meantime, the demand for electricity has risen exponentially, and total installed capacity has grown consistently over the years. In 1979, the Chinese mainland’s total installed capacity amounted to a mere 63.02 million kW, and it more than quadrupled to 298.77 million kW in 1999. Total installed capacity scaled up to 2.01066 billion kW in 2019, a surge of more than 30-fold in the past four decades.
Figure 4.8 shows China’s installed capacity in the years between 1979 and 2019. It can be seen that it has been growing year by year and the growth picked up pace notably after 2003. The accelerated growth was due to, on the one hand, a surge in the demand for electricity thanks to China’s soaring GDP after 2003, and on the other hand, the reform of the power system in 2002, which split the State Power Corp of China into five power production firms and two grid companies. The power production firms went on to expand and ramp up investments, which led to accelerated capacity installations.

Total installed capacity in the years between 1979 and 2019
China’s power generation mix has also been evolving and improving as installed capacity continued its breakneck growth. Figure 4.9 shows the share of multiple forms of power generation in total installed capacity from 1979 to 2019. For the first 30 years, data are presented in ten-year intervals, and for the past decade, data are illustrated in five-year intervals. Though thermal and hydro power sectors have witnessed a contraction in installed capacity as a share of total capacity in recent years, they still represent the bulk of China’s power generation. In 2019, thermal, hydro, wind, solar, nuclear and other forms represented 59.2%, 17.7%, 10.4%, 10.2%, 2.4% and 0.1% of the total installed capacity, respectively.

The share of multiple forms of power generation in total installed capacity from 1979 to 2019
Between 1979 and 1999, China’s generation portfolio composed almost entirely of hydro and thermal. Beginning in 2009, the share of non-hydro renewable sources (mainly including wind and solar power) in the energy mix has risen sharply. In 2009, the proportion of solar in the energy mix stood at a negligible level, and the total installed capacity of nuclear and wind combined amounted to a mere 3%. Fast forward to 2019, the share of non-hydro renewable sources in the energy mix had soared to 23%.
Figure 4.10 shows the share of multiple forms of power generation in the total installed capacity between 2009 and 2019. It is evident from the data that the share of hydro and thermal in the total installed capacity has been on a steady decline. The decline of thermal power generation was particularly pronounced, though its predominance in the energy mix still holds. Nuclear, wind and solar power have grown to become important components of China’s energy mix.

The share of multiple forms of power generation in total installed capacity from 2009 to 2019
The landscape of power generation in China has shifted from thermal and hydro dependency toward a more diversified mix of resources including wind, solar and nuclear. In the meantime, the country is transitioning from high to lower-emissions sources of power generation. The improvement of China’s energy mix has laid the groundwork for its low-carbon energy transition and sustainable development.
4.2.1.1 The Development of Thermal and Hydro Power in China
Figure 4.11 shows the installed capacity of thermal and hydro power and their shares in the total mix in the years between 1979 and 2019. The installed capacity of thermal and hydro power plants soared from 1.69 million and 0.16 million kW at the beginning of the founding of the PRC in 1949 to 1.19 billion and 356.4 million kW in 2019. A closer examination of the trends reveals that, between 1979 and 2003, growth in the total installed capacity of hydro and thermal power was relatively flat, and that thermal installations first picked up pace notably between 2003 and 2015, then tapered off after 2015. A look at their respective shares in the total installed capacity shows that the weight of hydro power has been on a consistent decline from 30.3% in 1979 to 17.7% in 2019; the proportion of thermal power capacity first grew gradually from 69.7% in 1979 to 77.6% in 2006, and took a plunge afterwards to just 59.2% in 2019.

The installed capacity of thermal and hydro power and their shares in the total mix
Here are the main drivers behind this trajectory of development: the development of renewable energy sources such as wind and solar had yet to be brought to scale before 2006, and hydro and thermal power remained the largest sources of China’s energy mix. As the demand for electricity rose steadily, thermal power installations took off, resulting in a rising share of thermal power and a decline in the share of hydro. After 2006, the installation of renewable energy capacity such as wind and solar was ramped up dramatically, and the share of hydro and nuclear in the energy mix dropped correspondingly. The fall in the share of thermal power in the overall portfolio was particularly steep under the influence of macro policies that supported energy saving and emissions reduction.
Though coal-fired power will remain the dominant source of electricity in China for a long time to come, the installed capacity of coal power and its share in the total mix are expected to go on a downward trajectory under the dual pressures of energy security and environmental protection. Clean coal technologies will be increasingly valued and deployed. Peak shaving technologies for thermal power plants also lay the technical groundwork for improving the integration of renewable energy assets within power grids.
4.2.1.2 The Development of Nuclear Power in China
In December 1991, China’s first commercial nuclear power plant (Qinshan l) was connected to the grid, and by December 2019, the Chinese mainland had 45 nuclear power units in operation in 16 nuclear plants. The installed capacity of nuclear power stands at 48.74 million kW, accounting for 2.4% of the total installed capacity. In 2019, the country’s nuclear power plants produced 348.7 billion kWh, or 4.8% of the total electrical output.
The installed capacity of nuclear power and its annual growth on the Chinese mainland between 2009 and 2019 are shown in Fig. 4.12. With the exception of 2012, the country’s nuclear capacity expanded during all other years. However, there have been marked fluctuations in the growth. Nuclear power now plays a noticeable role in the overall energy mix, though its share in the total installed capacity remains minor. Between 2009 and 2019, the share of nuclear power in the total installed capacity edged up from 1.0 to 2.4%. In the wake of the Fukushima nuclear accident in 2011, China took a much more cautious stance to the approval of nuclear power projects. In December 2012, the National Nuclear Safety Administration approved the construction of the third and fourth units (Phase II) for the Tianwan Nuclear Power Plant. No new approvals were granted in 2013 and 2014. In 2015, a total of eight nuclear power units were approved. No conventional nuclear power projects were approved in the subsequent three years (Xu 2018). In October 2019, construction licenses were issued for units 1 and 2 of the Zhangzhou nuclear power plant in China’s Fujian province.

Nuclear electricity generating capacity on the Chinese Mainland 2009–2019
In the 13th Five Year Plan on electric power development issued by the National Development and Reform Commission and the National Energy Administration in 2016, it was proposed that China would have 58 million kW of installed nuclear power by 2020 (The 13th Five-Year Plan for Electric Power Development 2016). However, actual growth fell short of the government’s target. By the end of 2019, the installed nuclear power generation capacity only rose to 48.74 million kW from 33.64 million kW in 2016. In February 2019, the China Electricity Council (hereinafter referred to as CEC) advocated for revising the 2020 target down to 53 million kW (Mid-Term Evaluation and Optimization of the 13th Five-Year Plan for Electric Power 2019).
Nuclear power plants provide a stable power generation with long utilization time. Nuclear is clean and zero-emission compared with thermal power, not affected by seasonality compared with hydro, and free from natural conditional such as wind and solar power. Nuclear energy development holds enormous potential in China. However, technological upgrading and the safety of the facilities will be the highest priority in the development of nuclear power.
4.2.1.3 The Development of Wind Power in China
The first wind farms sprouted in the 1980s in China, but it was not until 2005 that wind power began to take off. The support of government policies, which drove a massive inflow of capital into the sector, fueled explosive growth in the installed capacity of wind power in China in the following decade. In 2008, the total installed capacity of wind power stood at 8.39 million kW, accounting for a mere 1.1% of the country’s total installed capacity. In total, wind energy generated 13.1 billion kWh, or 0.4% of the country’s total power generation. China’s installed capacity of wind power had topped 210 million kW by the end of 2019, making up 10.4% of the country’s power capacity. Wind energy produced 405.7 billion kWh, representing 5.5% of the country’s power production in the year. Wind power has become an important part of China power supply mix.
The installed capacity of wind power between 2009 and 2019 and its share in the total mix are shown in Fig. 4.13. Figure 4.14 shows the capacity added each year and the rate of growth. It is evident from the data that since 2009, though the amount of newly installed capacity varied from year to year, a high level of growth was maintained throughout. The average annual increase in the installed capacity of wind power exceeded 15 million kW, and its share in the total mix has also witnessed a steady rise.

Installed capacity of wind power between 2009 and 2019 and its share in the total mix

Capacity added each year between 2009 and 2019 and the rate of growth
It is worth noting that although the installed capacity of wind power was seeing explosive growth, that did not translate into commensurate increases in the share of wind power in the total amount of electricity production. On the one hand, average utilization times of thermal, hydro and nuclear power plants are much longer than wind farms due to the unpredictable nature of wind energy. On the other, a significant amount of wind curtailment occurs due to a number of factors. Wind power curtailment refers to the shutdown of wind power generator under normal conditions due to grids with insufficient capacity, unstable wind conditions, construction mismatch of wind farm and power grid, and so on. Wind power curtailment has been effectively alleviated in the past two years through such measures as grid optimization, deep peak regulation by thermal power units and wind-powered heating. Conditions were the most severe during 2015 and 2016. In 2015, up to 33.9 billion kWh of wind electricity failed to connect to the grid, and the average wind power curtailment rate stood at 15%. In 2016, wind electricity losses approached 49.7 billion kWh, at a curtailment rate of 17.1%. After several years of efforts, the total curtailed electricity from wind nationwide dropped to 16.9 billion kWh in 2019, at a curtailment rate of just 4%.
4.2.1.4 The Development of Solar Power in China
Photovoltaic and solar thermal power are the two established solar power technologies. Currently, PV dominates China’s solar power industry. Figure 4.15 shows the cumulative and newly installed capacity of solar power in China between 2009 and 2019. Figure 4.16 illustrates the respective shares of nuclear, wind and solar in the total installed capacity in the same time span. It can be seen that in spite of the country’s late start, solar power generation has grown enormously in China. By the end of 2019, the installed capacity of solar power had risen to rival that of wind power. Solar power has become an important part of the energy portfolio of China.

Cumulative and newly installed capacity of solar power in China between 2009 and 2019

The respective shares of nuclear, wind and solar in the total installed capacity between 2009 and 2019
In 2016, China’s installed capacity of solar power reached 42.18 million kW, and electricity produced from solar hit 39.5 billion kWh. China overtook Germany in both indicators to become the world’s largest and fastest-growing solar energy market. In 2019, the total installed capacity of solar power in China stood at 204.68 million kW, generating 223.8 billion kWh of electricity. The share of solar power in the total installed capacity amounted to 10.4% in 2019, comparable to that of wind power (10.4%). The installed capacity of solar has pulled far ahead of nuclear and is edging closer to that of wind power. The share of both wind and solar in the total installed capacity topped 10% for the first time.
Similar to wind power, curtailment is also a cause for concern for solar power generation. Totally speaking, solar fares better than wind in this regard, and its curtailment has been reduced significantly in recent years. In 2019, some 4.6 billion kWh of solar power were curtailed nationwide, at a curtailment rate of just 2%.
4.2.2 The Distribution of Various Energy Resources in China
4.2.2.1 The Distribution of Hydro Power Resources
China posses the world’s greatest hydropower resources with a theoretical potential of 680 million kW, of which an estimated 540 million kW is exploitable. The enormous hydropower resources are distributed unevenly across the country, and mismatched the level of regional economic development. The vast majority are concentrated in relatively economically stagnant regions such as the west and southwest. Sichuan, Chongqing, Yunnan, Guizhou and Tibet together represent nearly two-thirds of the country’s total hydropower resources. However, hydro resources are scare in the more economically prosperous central and eastern regions where the demand for electricity is the highest. This mismatch of power supply and demand has had a profound impact on the development of regional power grids. Table 4.1 gives an overview of the distribution of hydropower resources in China (Review Results of Hydraulic Resources in People’s Republic of China 2003).
China has built 13 large-scale hydropower bases, which are principally located along the Jinsha River, Yalong River, Lancang River, Dadu River, and the upper reaches of the Yangtze River, as shown in Table 4.2 (Liu et al. 2016). Among them are the Three Gorges Dam—the world’s biggest hydroelectric power facility with an installed capacity of 22.5 million kW, Xiluodu Hydropower Station with an installed capacity of 12.6 million kW and Baihetan Hydropower Station with an installed capacity of 12 million kW.
4.2.2.2 Distribution of Thermal Power Plants in China
Thermal power plants can be powered by coal, gas and oil. The fact that China is rich in coal, but poor in other forms of energy resources such as gas dictates that coal-fired power plants have been the dominant source of electricity in the country. China’s coal-fired power capacity stood at 1.00845 billion kW at the end of 2018, accounting for 88.1% of the total installed thermal power capacity. The Energy Development Strategy Action Plan (2014–2020) released by the State Council in June 2014 called for utilizing the most cutting-edge energy-saving, water-saving and environmentally-friendly power generation technology to facilitate the building of 9 10 million-kW-plus mega coal power bases in Xilingol, Ordos, northern Shanxi, central Shanxi, eastern Shanxi, northern Shaanxi, Hami, Zhundong and Ningdong. The 9 coal power bases are listed in Table 4.3.
As can be seen from Table 4.3, these nine large-scale coal power bases are situated far from the load centers in central and eastern China. Consequently, the UHV power grid has become the premier choice for connecting the mega coal power bases to the load centers.
4.2.2.3 Distribution of Nuclear Power Capacity in China
The vast amounts of water are demanded by nuclear power plant for cooling, therefore using seawater as a cooling source is an advantage of nuclear power plants usually built in coastal area. All nuclear power plants in operation on the Chinese mainland are located in the coastal province such as Liaoning, Shandong, Jiangsu, Zhejiang, Fujian, Guangdong, Guangxi and Hainan. The location and installed capacity of each nuclear power plant are shown in Table 4.4 (by October 22, 2019). It can be seen that China’s nuclear power plants are sited more closely to the load centers. However, due to the relatively small total installed capacity, the nuclear power plants are still far from meeting the demand for electricity in these regions, a large share of which have to be transmitted through the power grid over long distance.
The development of inland nuclear power plants has long been part of discussions and research efforts in China. Three inland nuclear power plants—Hunan’s Taohuajiang power station, Hubei’s Xianning Dafan power station, and Jiangxi’s Pengze power station—were already approved prior to the Fukushima incident. However, the incident prompted China to halt all plans for constructing inland nuclear power projects. In recent years, the construction of inland nuclear power stations has re-entered the discussion. China’s 13th Five-Year Plan on the development of energy called for “research and preparations for the construction of inland nuclear power plants”.
4.2.2.4 Distribution of Wind Power in China
Unlike thermal and nuclear power, wind power output is greatly affected by a host of geographical and environmental factors. China’s wind energy resources are mainly concentrated in the northeast, north, northwest and along the coast, which are also home to the vast majority of the country’s wind power bases. In 2019, the top three provinces by cumulative wind capacity were Inner Mongolia (30.07 million kW), Xinjiang (19.56 million kW), and Hebei (16.39 million kW). Other provinces topping the 10 million mark included Shandong (13.54 million kW), Gansu (12.97 million kW), Shanxi (12.51 million kW), Ningxia (11.16 million kW) and Jiangsu (10.41 million kW).
In 2019, the regions with wind curtailment rates exceeding 5% included Xinjiang (14%, 6.61 billion kWh curtailed), Gansu (7.6%, 1.88 billion kWh curtailed) and Inner Mongolia (7.1%, 5.12 billion kWh curtailed). The three regions curtailed a combined 13.6 billion kWh of electricity generated from wind farms, or 81% of the country’s total curtailment. The common denominator shared by these three regions is an abundant supply of wind energy, a sparse population, relatively low demand for electricity locally and lack of transmission capacity to export excess electricity elsewhere. To tackle wind curtailment, it is necessary to improve the power grid’s capacity for transmitting wind power outward and for the coordinated generation, transmission and consumption of electricity across regions. In addition, local consumption of electricity should be bolstered through industrial transformation and upgrading, industrial transfer from the eastern regions, and the development of a number of energy-intensive industries such as hydrogen production by electrolysis and smelting. Low-cost wind power generated locally should be made full use of to reduce product cost and enhance their competitiveness.
4.2.2.5 Distribution of Solar Power in China
The total installed capacity of solar power in China reached 204.68 million kW at the end of 2019, 99.8% of which were from photovoltaic solar panels. In 2019, a total of 30.11 million kW of new PV capacity were added nationwide. 28.5% of the new capacity or 8.58 million kW were installed in northern China; 5.1% or 1.53 million kW in the northeastern region; 17.5% or 5.31 million kW in east China; 11.6% or 3.48 million kW in central China; 21.6% or 6.49 million kW in the northwestern region; and 15.7% or 4.72 million kW in southern China.
In 2019, the installed capacity of PV is mainly found in Xinjiang, Qinghai, Gansu, Ningxia, Inner Mongolia, Shaanxi, Shanxi, Hebei, Henan, Shandong, Jiangsu, Anhui and Zhejiang, where the PV capacity has either exceeded or is approaching 10 million KW. Among them, Shandong (16.19 million kW), Jiangsu (14.86 million kW), and Hebei (14.74 million kW) topped the chart.
In 2019, solar power generation by photovoltaics nationwide totalled 224.3 billion kWh, up 26.3% year-on-year. The average number of hours of utilization of PV systems stood at 1169 h, an increase of 54 h year-on-year. The national solar curtailment rate fell by 1 percentage point to 2%, tallying to a total of 4.6 billion kWh of electricity curtailed. A closer examination of the various regions reveals that the challenge of curtailment is most acute in the northwestern region, which accounted for 87% of nationwide curtailment in 2019 in spite of a 2.3 percentage point drop in curtailment to 5.9%. The rate of curtailment in north, northeast and south China stood at 0.8%, 0.4%, and 0.2%, respectively. No solar curtailment occurred in central and east China. Parsing the data further at the provincial level, the curtailment rate in Tibet, Xinjiang and Gansu declined 19.5%, 8.2%, and 5.6% year-on-year to 24.1%, 7.4%, and 4.0%, respectively. Due to such factors as a notable increase in solar installations and a drop in load, Qinghai saw its curtailment rate rise to 7.2%, up 2.5% year-on-year.
Photothermal power generation is also called solar thermal power (STP) generation. Solar thermal power plants are generally composed of three subsystems: solar heat collection, heat storage and power generation. Heat storage gives STP systems the advantages of stable output and adjustability compared to PV power generation. In addition, the heat storage component can be integrated with other circulation systems to improve energy efficiency (Du et al. 2016).
Despite the clear advantages of STP, China remains at the very early stage in terms of the full-scale development of STP due to technology and cost barriers. The conditions for building STP plants are rather demanding: strong and direct solar radiation, a large amount of water and land as well as a flat landscape. Therefore, current STP plants in China are primarily concentrated in the northwestern and northern regions where the conditions are suitable. On September 13, 2016, the National Energy Administration issued a notice on the construction of solar thermal power generation demonstration projects, which contained a shortlist of 20 demo STP projects with a total installed capacity of 1.349 million kW to be built in Qinghai, Gansu, Hebei, Inner Mongolia and Xinjiang.
In summary, the curtailment of power generated from renewable facilities, mainly wind and solar, is most prominent in northwest China. The reasons are three-fold. First of all, renewables by their very nature are intermittent and volatile, and the power grids do not have sufficient capacity to adequately peak shave. Second, there is a mismatch between power generation installations and the construction of infrastructure for the outward transmission of renewable energy. Third, there are weaknesses in the power grid, and some regions are hobbled by grid constraints.
4.2.3 The Current Development of Distributed Renewable Power
The thermal, hydro, nuclear, wind and PV power generation discussed above are all large-capacity or centralized. Their output is connected to the high-voltage transmission grid via transformers, and then delivered over long distances to load centers. Distributed generation (DG) or decentralized generation, on the contrary, is directly either connected to the distribution network or designed to meet an end user’s on-site electricity needs. DG capacity usually less than 10–30 MW. Currently, distributed renewable power sources in China mainly include small hydropower, distributed wind power and distributed photovoltaic power generation.
Small hydropower is a necessary supplement to large power grids. It helps to realign the mismatch between the supply and demand of electricity in the rural areas, stimulate growth in the rural economy, and accelerate the pace of rural electrification. The development of small hydropower projects is not only pertinent to the issues of energy and livelihood, but also key part of the country’s poverty alleviation project. It is of enormous significance to the eradication of poverty in China’s remote and underdeveloped rural areas. The current construction of small hydropower projects in rural China, besides having green development and poverty alleviation as its two overarching priorities, is ultimately aimed at aiding in the revitalization of rural communities and improvement of river ecology.
According to the Annual Report on Rural Water Conservancy and Hydropower Work in 2018 released by the Ministry of Water Resources, 194 new hydropower stations were built in the rural areas in 2018, adding a total of 1.643 million kW in installed capacity, or 18.3% of the total newly installed hydropower capacity in the country. The vast majority of the installations were in southwest China. There were 46,515 hydropower stations across rural China at the end of 2018, with installed capacity of 80.435 million kW, which amounted to 22.8% of the total installed capacity of hydropower or 4.2% of total installed power capacity nationwide. Small rural hydropower plants are predominately concentrated in Yunan, Guizhou, Sichuan, Hubei, Hunan and Zhejiang. Their distribution is shown in Fig. 4.17.

Rural hydropower installed capacity by region at the end of 2018
According to the Annual Report on Rural Hydropower in 2018 published by the Ministry of Water Resources, rural hydropower stations provided 214.95 billion kWh of electricity into the grid, with around 3.81 billion kWh supplied to nearby communities. 1519 counties across rural China were equipped with hydropower facilities at the end of 2018, the vast majority of which were found in southwest, central and southern parts of the country. Sichuan topped the list with 162, followed by Yunnan with 116 and Hunan with 96 small rural hydropower plants. The installed capacity of rural hydropower and the amount of electricity generated made up 62.8% and 43.8% respectively of China’s total hydropower potential in rural areas. Provinces with higher utilization rates are chiefly concentrated in central and east China and southeastern regions along the coast, while rural hydropower still holds enormous untapped potential in southwest China where hydropower resources are more abundant and economic development has been relatively stunted. With the continuous construction of small hydropower projects in rural areas, they may very well become the leading source of power for rural communities and remote mountainous areas across the country.
The scale of distributed wind power remains limited in China. A growing number of provinces have announced plans for the development of decentralized wind power in recent years. Table 4.5 shows the regions with a planned distributed wind power capacity exceeding 1 million kW.
Currently, the most popular application of PV systems is rooftop photovoltaic installation. In 2019, 12.2 million kW of distributed PV capacity were installed nationwide, accounting for 40.5% of newly installed PV capacity and 11% of newly electricity. The cumulative installed capacity of distributed PV stood at 62.63 million kW at the end of 2019, a year-on-year increase of 24.2%. Distributed PV capacity represented 30.5% of all PV capacity and 3.1% of total installed power capacity. Topping the chart in terms of distributed PV capacity were Shandong (9.42 million kW), Zhejiang (9.42 million kW), and Jiangsu (6.56 million kW).
Distributed renewable energy systems entail shorter construction period, lower infrastructure investments and present less impact on the environment and ecological system than their centralized counterparts. Electricity generated by distributed renewables prefers to be consumed on site, and any surplus is exported to the grid. The adaptive, clean, efficient, distributed and localized nature of distributed generation supports, on the one hand, the replacement or reduction of fossil fuel use through tapping into local resources, and on the other hand, the addressing or alleviation of the problem of power shortages in certain areas. In addition, distributed energy systems are located close to the end-user, thus entailing less complicated electric equipment and resulting in less transmission losses.
Although distributed renewable power generation remains supplementary to the traditional, centralized power infrastructure in China at the current juncture, it will undoubtedly rise to become the main source of electricity for not only rural communities, pastoral and mountainous areas but also urban and commercial areas on the merit of its unique advantages as the country works toward embracing renewables as the main source of future energy.
It is worth noting that while distributed renewable sources have a positive impact on the stability and safety of power systems, they can also pose certain challenges and risks. For one thing, distributed renewable power systems are independent of each other, and as such, large-scale power outages can be avoided and the problem of instability facing large-scale power grids is a non-issue. For another, the grid connection of distributed renewable systems also increases the variability and uncertainty of the load, in addition to causing voltage fluctuations in the grid and impacting the distribution relay protection of the system.
4.2.4 Analysis of the Impact of Policy on the Power Generation Mix
The development and evolution of China’s power generation mix have been accompanied by the introduction and implementation of a series of policies. The transition of the energy system down the road, especially the development of renewable energy, will call for the continuing support of enabling policies. The adoption of the Renewable Energy Law in 2005 can be deemed as the beginning of China’s outpouring of supportive policies for the development of renewable energies, especially wind and solar.
A close look at the evolution of China’s power generation mix in the past two decades and the introduction of policies reveals the central role of policies in driving and supporting the country’s energy transition. The Wind Farm Concession Program rolled out in 2003, the Renewable Energy Law promulgated in 2005 and the slew of policy documents for supporting wind power issued in the years that followed have fueled explosive growth in the installed capacity of wind energy since 2005. Coinciding with the rapid growth of China’s PV capacity since 2009 was the aggressive introduction of a plethora of PV-related policies. In addition, following the release of policy documents on the absorption of wind power, China saw substantial reductions in curtailment in 2018 and 2019.
Renewable energy-related policies in China can be summarized as below:
-
(1)
Such means of financial support as loan discounts, subsidies and tax incentives are used to support the development of renewable energy. In 1999, the Chinese government issued an official notice to further support renewable energy, which included the arrangement that renewable energy projects would be granted a 2% fiscal discount on lending rates by banks. A special fund for renewable energy was set up in 2006. Funds would be provided as grants or low interest loans, the repayment of which are accorded interest discounts up to a maximum of 3%. In terms of subsidies, in 2009, the Finance Ministry announced it would provide 20 yuan per watt peak (Wp) of subsidy for solar projects attached to buildings that have capacity of more than 50 kW peak. The conditions and amount of subsidies have been adjusted on an annual basis since. In 2012, China reduced the subsidy for projects under the Golden Sun program, geared towards end-users who generate the power for their own use, to 7 yuan per Wp. Solar PV subsidies have been declining as the sector grew. According to the Notice on Matters relating to PV Power Generation in 2018, jointly issued by the National Development and Reform Commission, the Ministry of Finance and the National Energy Administration, the subsidy for self-consumption DG generation projects was to be reduced by ¥0.05–¥0.32 kWh (including tax). DG projects that supply all generated power to the grid would be treated in the same manner price-wise as PV plants in the same resource area. Electricity generated for self-use from DG projects would be exempt from various fees including a reserve capacity charge and other grid-related service fees. Tax incentives are delivered primarily through Value-added Tax (VAT) policies. In 2013, China introduced a 50% VAT rebate for solar equipment manufacturers, effective between October 1, 2013 and December 31, 2015. The policy was renewed again in 2016.
-
(2)
The grid-price of electricity generated from renewable sources will use the benchmark grid-price of electricity as the starting point and transition toward more competitive prices in the long run, with the ultimate aim of delivering affordable or low-cost clean electricity. The benchmark on-grid electricity price is set by the government while a competitive price is determined by competitive bidding under the upper limit of the government’s suggested price. An affordable price generally refers to the benchmark grid-price of electricity produced locally from coal-fired units (including desulphurisation, denitrification and dust removal systems), and prices below this threshold are characterized as low-cost. A review of policies on the grid-price of renewable energy in the past two decades reveals a familiar pattern. Whether in the case of PV or wind power generation, including both onshore and offshore, the government would set a benchmark grid-price at the initial stage of development, gradually lower the price as the sector grew in both scale and the amount of electricity generated, and then either replace the benchmark price with a government-suggested price or allow prices to be determined by competitive bidding in order to ultimately deliver clean electricity at affordable prices.
-
(3)
Policies to support wind energy in China began with the onshore sector and gradually expanded to include offshore wind farms. The development of wind energy early on had been limited to onshore sites until the roll-out of the Medium and Long Term Development Plan for Renewable Energy in 2007, which proposed to “intensify research efforts toward the development of offshore wind energy technology, make preparations for the survey of offshore wind resources and pilot demonstration projects, and build 1–2 100,000-kW offshore pilot wind farms in order to acquire technology and experience for the large-scale development of offshore wind power in the future.” In 2009, the Interim Measures on the Management of Offshore Wind Farm Development, the first policy document focusing exclusively on offshore wind power was released. Subsequently, policy documents on wind power would invariably include a separate section dedicated to the offshore sector. In terms of price, the grid-price of electricity generated from offshore wind farms has always been higher than that from onshore wind power plants. According to the Notice from the National Development and Reform Commission on Improving the Policies for On-Grid Wind Power Prices, the guideline feed-in tariff for onshore wind power varies among the four categories of wind energy areas as determined by the NDRC, specifically being 0.34, 0.39, 0.43 and 0.52 yuan/kWh in 2019, and 0.29, 0.34, 0.38 and 0.47 yuan/kWh in 2020. The guideline feed-in tariff for all offshore wind power projects stood at 0.8 yuan/kWh for the year 2019 and it was lowered to 0.75 yuan/kWh for 2020. It can be seen that while affordable access to electricity generated in category I and II wind energy areas is ensured, currently the grid-price of electricity generated from offshore wind farms remains much higher than that from thermal power plants in the same area.
-
(4)
Policy support was first provided to centralized PV power plants and gradually expanded to distributed PV projects. The Notice on the Implementation of the Golden Sun Demonstration Project issued in 2009 specified that financial subsidies would be allocated toward supporting large-scale grid-connected PV power generation projects constructed in areas rich in solar energy potential. In 2013, the Several Opinions of the State Council on Promoting the Healthy Development of the Photovoltaic Industry proposed to commit significant resources toward developing the distributed PV power generation market and proceed with the construction of PV power stations in an orderly fashion. The National Energy Administration followed up again with yet another document on driving the implementation of support policies for distributed PV power generation a year later.
-
(5)
Policy on the development of renewable energy has evolved from a singular focus on the expansion of scale toward addressing such issues as integration and curtailment. In 2012, the National Energy Administration issued the Notice Regarding Improving the Connection and Consumption of Wind Resources. Similar documents have been released each year since. The Notice on Wind Power Investment Monitoring and Early Warning Results issued by the NEA in 2017 designated regions dealing with significant wind curtailment such as Inner Mongolia, Heilongjiang, Jilin, Ningxia, Gansu, and Xinjiang (including the Corps) as red warning zones, which would not be granted approval of the construction of any new wind power projects without first addressing wind curtailment. Since 2018, special notices issued for wind and PV power generation projects have spelled out strict prerequisites concerning the capacity of new projects to guarantee the efficient utilization of the electricity generated.
4.2.5 Projections on the Transition of China’s Power Generation Mix
According to a 2017 study by the Institute for Contemporary China Studies of Tsinghua University, China’s per capita GDP is expected to top US$36,632 by 2035 and US$60,847 by 2050 (Hu 2017). The country’s annual electricity consumption per capita will reach the current Japanese level of roughly 8000 kWh in 2035. Since the industrial sector accounts for a larger share of the Chinese economy and consumes more electricity, it is estimated that annual electricity use per capita will top 8000 kWh by 2035 and 13,000 kWh by 2050, which is close to the current US level. According to the National Population Development Plan (2016–2030) released by the State Council, China’s population is expected to peak at 1.45 billion in 2030, and then drop to 1.365 billion by 2050. Based on these projections, the country’s overall power demand will reach 11.6 trillion kWh by 2030 and 17.8 trillion kWh by 2050.
Data on the hours of utilization of various power generating equipment for 2019 are shown in Table 4.6.
Literature (Mid-Term Evaluation and Optimization of the 13th Five-Year Plan for Electric Power 2019) proposed to expand China’s hydropower installed capacity to 480 million kW by 2035; peak coal-fired installed capacity at around 1.3 billion kW by 2030; expand gas-fired installed capacity to 95 million kWh by 2020; and approve the construction of 8–10 nuclear power units annually.
Projections on the installed capacity and amount of electricity generated from various sources of energy are given on the basis of data presented above. It is presumed that from 2030 to 2050, the hours of usage of hydro, solar, wind, nuclear and thermal power facilities are 3800, 1500, 2200, 7000 and 4000 h, respectively.
In 2005, 2014, and 2019, China’s hydropower installed capacity stood at 110 million kW, 300 million kW and 360 million kW, respectively. Given the target of 480 million kW by 2035, it is predicted that hydropower installed capacity and the amount of power generated will total 450 million kW and 1.71 trillion kWh respectively by 2030. By 2050, China will have mostly tapped its full hydropower potential, with an installed capacity exceeding 90% of the technically exploitable hydropower capacity. Total hydropower installed capacity will reach 500 million kW and annual power generation will stand at 1.9 trillion kWh.
In 2019, the installed capacity of nuclear power in China was registered at 48.74 million kW, and the total capacity of reactors under construction topped 13 million kW. Assuming that 10 nuclear power units, each with a generation capacity of 1 million kW, are approved for construction each year, and each requires a construction time of 6 years, which has been the domestic average in recent years, China’s nuclear installed capacity is expected to reach 100 million kW by 2030 and 300 million kW by 2050, producing some 700 billion and 2.1 trillion kWh of electricity respectively.
In order to meet the target of peaking carbon emissions by around 2030, new installations of coal power should be reduced year by year, and total coal-fired installed capacity should peak by 2030 at approximately 1.3 billion kW. Though natural gas is a cleaner form of energy than coal, its burning still yields a significant amount of carbon dioxide emissions. It is assumed that natural gas installed capacity will also peak by 2030. China’s natural gas installed capacity stood at 76, 84 and 95 million kW respectively in 2017, 2018 and 2019. New installations amounted to roughly 10 million kW of added capacity annually. According to the latest data from the National Development and Reform Commission and the National Bureau of Statistics, natural gas output in China rose by 9.8% y-o-y to 173.62 billion cubic meters (bcm) in 2019. Its consumption was up by 9.4% to 306.7 bcm, with 44% of the country’s gas demand satisfied by imports. China’s natural resource profile dictates that its natural gas installed capacity won’t be able to sustain continuous, high growth in the future, which is projected to reach 200 million kW by 2030. It is estimated, on the basis of coal and natural gas projections, that thermal installed capacity will peak at 1.5 billion kW by 2030, generating some 6 trillion kWh of electricity.
Assuming that the ratios of wind and solar installed capacity are the same in 2030 and 2050, and the annual time of usage of renewable facilities, calculated by averaging the hours of utilization of wind and solar facilities, is 1850 h, projections of China’s power supply in 2030 and 2050 are shown in Tables 4.7, 4.8 and Fig. 4.18.

Projections on China’s power generation mix in 2030 and 2050
It is projected that total installed capacity will grow to 3.78 billion kW by 2030. Thermal, hydro, nuclear and renewables including wind and solar will account for 40%, 12%, 2% and 46% respectively of the total. By 2050, total installed capacity is expected to climb to 6.63 billion kW, of which thermal, hydro, nuclear and renewables (incl. wind and solar) will represent 21%, 8%, 4% and 67% respectively.
4.3 Research on the Structural Transition of China’s Power Grids
The development of China’s power grids can be roughly divided into three stages:
The first stage: the formation of local/provincial power grids, spanning from the founding of the People’s Republic of China in 1949 to the late 1960s and early 1970s. In this stage, distribution networks centering around large and medium-sized cities were gradually connected through 220 kV transmission lines. And local power grids, mainly covering provincial areas and with 220 kV lines as the backbone network, were set up.
The second stage: inter-provincial connection, spanning from the early 1970s to the 1980s, when the improvement of provincial power grids and the formation of inter-provincial power grids went hand in hand. By the end of the 1970s, nearly 30 provincial power grids with 220 kV lines as the backbone gradually emerged in China, which were interconnected into several regional grids across provinces. Since first launched in the early 1980s, the 500 kV transmission lines have become the backbone of major grids and served as the “liaison” across provinces and regions. By 1989, seven inter-provincial grids had taken shape in China, namely: the Northeast China Grid (NECG), North China Grid (NCG), East China Grid (ECG), Central China Grid (CCG), Northwest China Grid (NWCG), Sichuan and Chongqing Grid (CYG), and South China Grid (SCG) (including the Hong Kong Grid and the Macao Grid). Six other independent provincial grids existed in Shandong, Fujian, Hainan, Xinjiang, Tibet and Taiwan.
The third stage: the interconnection of cross-regional power grids, which began in the late 1980s and is now under rapid development. Milestones include:
-
In September 1989, the ±500 kV UHV DC transmission project (1.2 million kW) between CCG and ECG was put into operation, marking the debute of asynchronous trans-regional interconnection in China and a major step forward from inter-provincial to cross-regional connection.
-
In July 1991, China Southern Power Associated Company (the predecessor of China Southern Power Grid) was founded, mainly operating in Guangdong, Guangxi, Guizhou and Yunnan provinces (regions).
-
In 2002, the State Council approved the reform plan of the power system to restructure grid and power production enterprises, which led to the establishment of State Grid Corporation of China (State Grid) and China Southern Power Grid (Southern Grid), with the former setting up five regional grid companies, namely, North China Grid Company Limited (NCGC), Northeast China Grid Company Limited (NECGC), Northwest China Grid Company Limited (NWCGC), East China Grid Company Limited (ECGC) and Central China Grid Company Limited (CCGC).
-
Since the twenty-first century, the construction of the Three Gorges Project has facilitated the asynchronous interconnection between CCG and ECG, CCG and SCG, CCG and NWCG, as well as NECG and NCG. In December 2008, the UHV AC test and demonstration project between CCG and NCG was launched. In 2010, Xinjiang provincial grid and the main network of NWCG were connected through 750 kV lines. The year of 2011 witnessed the asynchronous networking between Tibet provincial grid and NWCG. By then, six regional grids had emerged: NCG, CCG, ECG, NECG, NWCG, and SCG.
Currently, the six regional grids are primarily connected through UHV AC/DC hybrid transmission lines—a reality determined by the severe regional mismatch between power and load distribution. UHV transmission lines enable long-distance, large-capacity and high-efficiency transmission of electricity, optimizing the allocation of energy resources nationwide.
4.3.1 UHV AC/DC Transmission Networks
4.3.1.1 Overview of UHV Transmission
The distribution of primary energy resources in China is quite the reverse to that of the main load. Some 80% of primary energy resources such as coal, water and wind are distributed in such remote areas as the western and northern regions with low population density, small energy demand, underdeveloped economy and large environmental capacity, while over 75% of energy consumption is concentrated in economically developed and densely populated eastern regions such as Beijing-Tianjin-Tangshan area, Yangtze River Delta and Pearl River Delta. With the growth of national economy, industrialization and the improvement of people’s living standards, China will continue to see surging power demand. With this in mind, large-capacity and long-distance transmission projects hold the key to energy balance. And the scenario of massive west-to-east power transmission will remain well into the future (Zhou et al. 2018).
HVAC and HVDC transmission projects developed rapidly in China. On January 6, 2009, the 1000 kV Southeast Shanxi-Nanyang-Jingmen UHV AC pilot demonstration project, the first of its kind in China, was put into operation. It marked the world’s first 1000 kV transmission line for commercial use, harnessing complementary hydro and thermal power production from NCG and CCG. On December 28, 2009, Southern Grid’s ±800 kV UHV DC transmission project extending from Yunnan to Guangdong, independently designed by China, went into operation, meaning that China had joined the ranks of world-leading nations in the research on key technologies of UHV DC transmission and transformation and manufacturing of crucial equipment. China had built nine UHV AC and ten DC lines by June 2019 and is building another three UHV AC and one DC lines. The total length of operating UHV lines in the country amounted to 27,570 km, and the total transformation (conversion) capacity stood at 296.2 million kVA (kW). By the end of 2019, China’s UHV lines had delivered more than 1.15 trillion kWh of electricity cumulatively, making tremendous contribution to stable power supply, clean energy development, environmental improvement and grid safety. UHV AC and UHV DC power transmission projects won the National Science and Technology Progress Awards in 2012 and 2017 respectively.
At present, AC/DC transmission projects among regional power grids in China mainly include:
-
SCG-CCG: ±500 kV Three Gorges-Guangdong DC transmission project (2003);
-
NECG-NCG: ±500 kV Gaoling Back-to-Back DC transmission project (2008, 2012), ±800 kV Zhalute-Qingzhou DC transmission project (2017), 1000 kV Southeast Shanxi-Nanyang-Jingmen UHV AC transmission project (2008);
-
NWCG-CCG: Lingbao Back-to-Back DC transmission project (2009), ±500 kV Debao DC transmission project (2009), ±800 kV Tianzhong DC transmission project (2014), ±800 kV Jiuquan-Hunan DC transmission project (2017);
-
NCG-NECG: ±660 kV Yindong DC transmission project (2010), 1000 kV Yuheng-Weifang UHV AC transmission project (2017);
-
CCG-ECG: ±500 kV Ge Nan DC transmission project (1989), Long Zheng DC transmission project (2003), Yi Hua DC transmission project (2006), Lin Feng DC transmission project (2011), ±800 kV Upward DC transmission project (2010), Jinping-South Jiangsu DC transmission project (2012), Left Bank of Xiluodu-Jinhua, Zhejiang DC transmission project (2014);
-
NWCG-ECG: ±800 kV Ningdong-Zhejiang DC transmission project (2016);
-
NECG-ECG: ±800 kV Ximeng-Taizhou DC transmission project (2017);
-
NCG-ECG: ±800 kV North Shanxi-Jiangsu UHV DC transmission project (2017).
The UHV AC transmission projects set to be completed in 2020 include “west vertical” and “mid vertical” lines, the former being the UHV AC line from west Mongolia to south Hunan, and the latter being the UHV AC line from Ximeng to Zhangbei to Ganzhou, with a total capacity of 17 million kW, serving central and north China respectively. UHV DC transmission projects include Huaidong-South Anhui, Qinghai-Henan, Yazhong-Jiangxi and North Shaanxi-Wuhan lines. The voltage of Huaidong-South Anhui line is ±1100 kV with a capacity of 12 million kW, while the other lines are ±800 kV and 10 million kW, also serving central and north China.
4.3.1.2 UHV DC Transmission Network
High voltage direct current transmission (HVDC) technology is very important in long-distance and large-capacity power transmission, asynchronous networking of power systems, improvement of reliability, and new energy development and its grid connection. It is one of the major grid technologies and produces tremendous impact on grid structure.
A late mover in DC transmission technology, China independently built the first DC transmission line running from Zhoushan to Ningbo in 1987. Thanks to three decades of development, enormous strides have been made in conventional HVDC transmission, with notable improvement in voltage classes, transmission capacity and distance, localization of equipment and engineering, etc. For China’s HVDC projects, their voltage classes range from ±400 kV (Golmud-Lhasa HVDC project) to ±1100 kV (Changji-Guquan UHV DC project); the capacity varies from 600 MW (Golmud-Lhasa HVDC project) to 12,000 MW (Changji-Guquan UHVDC Project); transmission length is between 890 km (Three Gorges-Changzhou HVDC project) and 3324 km (Changji-Guquan UHVDC project). On the whole, China’s UHV DC transmission is featured by high and multiple voltage classes, wide span in capacity and transmission length.
Equipment for HVDC transmission mainly includes converters, converter transformers, smoothing reactors, AC filters, DC arresters and control and protection equipment, as shown in Fig. 4.19 (Wang and Cao 2018). Converters are used for rectification and inversion, during which higher harmonics will be produced. In this case, filters should be configured on the AC bus of converter station to reduce the entry of higher harmonic into the AC system. The filter consists of reactance coil, capacitor and small resistor connected in series.

Schematic diagram of HVDC transmission
According to the Annual Development Report on China Power Industry 2019 released by CEC in June 2019, by the end of 2018, China’s cross-regional power transmission capacity totalled 136.15 million kW, 122.81 million kW of which were connected to AC and DC networks. The power transmission capacity of cross-regional point-to-network stood at 13.34 million kW.
The Annual Report on National Power Reliability 2017 issued by CEC in May 2018 revealed statistics of varied HVDC transmission systems (15 point-to-point EHV systems, 7 point-to-point UHV systems and 3 back-to-back systems), as shown in Table 4.9. All systems featured over 90% of energy availability, which demonstrates the maturity and reliability of UHV DC transmission technology in China’s engineering practice.
In the foreseeable future, China’s conventional HVDC transmission technology will largely remain unchanged, but will reach higher voltage class, larger transmission capacity, longer transmission and lower cost per unit of construction in the long run (Jia 2018).
4.3.1.3 UHV AC Transmission Network
In recent years, China has seen a string of major technological breakthroughs in key UHV technologies, thanks to intensive R&D efforts in automatic voltage control, secondary-arc current control, commissioning and operation of equipment sets. As a result, China has owned a whole set of world-leading UHV AC transmission technologies with independent intellectual property rights (IPRs). On January 6, 2009, the Southeast Shanxi-Nanyang-Jingmen UHV AC pilot—a 1000 kV AC power transmission and transformation project that was developed, designed and built by China with IPRs—was put into trial operation. This is the first of its kind in China, showcasing major breakthroughs in the localization of long-distance, large-capacity and low-loss UHV core technologies and equipment, which was crucial for optimizing resource and energy allocation, and ensuring national energy security and reliable power supply (Tang et al. 2016).
As of 2019, China’s UHV AC transmission projects already in operation and under construction include:
-
1000 kV Southeast Shanxi-Nanyang-Jingmen UHV AC pilot demonstration project (2009), with a conversion capacity of 18 million kW;
-
1000 kV Huainan-North Zhejiang-Shanghai UHV AC demonstration project (2013), with a conversion capacity of 21 million kW;
-
1000 kV North Zhejiang-Fuzhou UHV AC project (2014), with a conversion capacity of 18 million kW;
-
1000 kV Ximeng-Shandong UHV AC project (2016), with a conversion capacity of 15 million kW;
-
1000 kV West Mongolia-South Tianjin UHV AC project (2016), with a conversion capacity of 24 million kW;
-
1000 kV Huainan-Nanjing-Shanghai UHV AC project (2016), with a conversion capacity of 12 million kW;
-
1000 kV Ximeng-Shengli UHV AC project (2017), with a conversion capacity of 12 million kW;
-
1000 kV Yu Heng-Weifang UHV AC transmission and transformation project (2017), with a conversion capacity of 15 million kW.
4.3.1.4 Comparison of Two Technological Options
China’s UHV transmission network has always been characterized by a combination of AC and DC. The replacement of UHV AC grid by UHV AC backbone network and proper utilization of UHV AC/DC transmission for regional grids interconnection and synergy have proved to be vital to power delivery from major energy production bases and power transmission to remote areas (Peng et al. 2017).
Meanwhile, both technology options have their own characteristics. UHV DC transmission technology is featured by Zhou and Zhong (2007): (1) large transmission capacity, high voltage class, narrow line corridor, suitable for high-power transmission in long distance; (2) no drop point, clear and simple architecture, and direct transmission of power to the load center without synchronous operation between networks; (3) equipment compromise by high-power impact on the AC system at both ends due to DC system locking.
UHV AC transmission technology is featured by Zhou and Zhong (2007): (1) large transmission capacity, wide coverage, minor network loss, small number of transmission corridors, and suitable for large-capacity transmission in short distance; (2) existence of drop point, the ability of building backbone network based on actual needs of power distribution, load position, power transmission and exchange; (3) variation of transmission power affects reactive power at the transmitting and receiving ends, triggering chain reaction and even voltage instability.
In contrast to UHV AC, UHV DC long-distance transmission boasts low construction cost of long-distance overhead lines (as shown in Fig. 4.20) (Wen et al. 2012), minor loss, large transmission capacity, narrow transmission corridors, easy access to long-distance transmission, high reliability and high energy utilization (as shown in Tables 4.10 and 4.11), etc.

Comparison of AC/DC transmission construction costs
With the rapid development of UHV transmission network in China, notable changes have occurred in the running of power grids, with some regions experiencing much stronger DC than AC (Zhang and Gong 2016). Overlapping UHV AC synchronous grids on the existing trans-regional UHV DC transmission would produce a complex parallel of AC and DC, which is prone to new stability issues and might incur potential security risks. Therefore, grid security and reliability should warrant more attention.
It’s important for UHV AC/DC parallel grids to match the distribution of energy resources in China. Construction of robust UHV grids should be accelerated by using UHV DC, via UHV AC connection, to transmit clean energy across regions and over long distances. Efforts should be made to reverse the precedence of DC over AC and ensure appropriate balance, so that the size of DC or AC is commensurate with intensity. Currently, China’s UHV AC/DC parallel grids have taken shape, yet new problems resulting from constant changes in operation stand as a test to the endurance of grids (Wen et al. 2012).
4.3.2 Flexible DC Transmission Technology
Despite the distinct strength of UHV DC transmission technology in long-distance transmission, it can only be applied to point-to-point transmission of energy without any drop point in the middle, which is not conducive to the optimal allocation of electricity in many cases. Flexible DC transmission technology helps overcome this weakness and represents the future of grid development.
In 1990, Canadian scientists envisioned flexible DC transmission technology by adopting insulated gate bipolar transistor (IGBT) and integrated gate converter thyristor (IGCT) and other fully controlled devices, which captured attention from scholars and researchers worldwide. Leading international electric academic organizations named it “VSC-HVDC” (“high-voltage direct current transmission with voltage source converter”), or “flexible DC transmission” in China.
Flexible DC transmission technology is able to control the flow of electric energy and isolate faults by using turnoff voltage source converters and pulse width modulation (PWM); it can absorb energy, adjust active and reactive power in the operation of power grids to improve voltage stability; in case of flow reverse, voltage polarity can be kept unchanged for multi-end transmission; AC side current can be controlled to cut short-circuit current and reactive compensation capacity; filtering devices can also be reduced. The earliest flexible DC project was Hellsjon, which was put into operation in Sweden in 1997. The first interconnected flexible DC transmission project was Directlink in Australia, and the first back-to-back flexible DC project was EaglePass-TexasB2B between Mexico and US.
In 2011, Shanghai Nanhui flexible DC project, the first of its kind in China based on MMC technology, was officially launched. The project was designed and manufactured by the State Grid, which signified China’s capability of independent R&D, design and manufacturing of key equipment and control technology for flexible DC transmission. Since then, China has been at the forefront of MMC-HVDC technology development. In 2013, 200 MW/±160 kV Nan’ao three-terminal flexible DC transmission demonstration, the world’s first multi-terminal MMC-HVDC project, was commissioned. Designed and manufactured by China Southern Power Grid, it managed to address key technical problems such as large-scale wind farms access through MMC-HVDC, multi-terminal system control and protection, and complex AC/DC hybrid system control, laying a solid foundation for the application and promotion of flexible DC transmission access technology for large wind farms in China, and marking a significant stride for China’s transmission technology towards multi-terminal flexible DC system.
In China, flexible DC transmission projects have been constructed in Nanhui (±30 kV, 18 MW, 2011), Nan’ao (±160 kV, 200 MW, 2013), 5 terminals of Zhoushan (±200 kV, 400 MW, 2014) and Xiamen (±320 kV, 1000 MW, 2015), which have been running in a stable manner and gained valuable experience in construction and operation. The Zhangbei DC power grid (±500 kV, 3000 MW) that has been fully connected also represents the multi-terminal flexible DC transmission network with the highest voltage class and the largest capacity in the world. The design of the hybrid DC network under construction in Wudongde (±800 kV, 5000 MW) has also been upgraded. Both projects are expected to be commissioned in 2020.
Compared with traditional HVDC transmission, flexible DC boasts the following advantages:
-
(1)
Reactive power is not required on the AC side with no commutation failure. For traditional HVDC transmission, conversion stations need to absorb tremendous reactive power, which calls for many more devices for compensation; what’s more, traditional DC transmission relies on voltage support of AC system during commutation. Inadequate support might result in commutation failure—a problem that would never occur in flexible DC.
-
(2)
Flexible DC transmission technology can operate in 4 quadrants and control active and reactive power independently, providing power supply to passive networks. Flexible DC transmission can be used as STATCOM application to compensate reactive power on AC side and stabilize its voltage. But traditional DC transmission can operate in 2 quadrants only without independent control of active and reactive power.
-
(3)
Minor harmonic content requires almost no filters due to the fairly high switching frequency of flexible DC transmission.
In view of these advantages, flexible DC transmission technology is mainly applied in the following scenarios:
-
(1)
Massive power transmission and networking of AC/DC systems.
-
(2)
Grid connection of distributed power.
-
(3)
Grid capacity expansion and DC power supply. The less harmonic content during the operation of flexible DC transmission system enables quick control of system-wide power to upgrade power quality; less floor space is required for flexible DC transmission conversion stations than traditional ones, hence more land saving and less waste; furthermore, the ability of the system to control the current on AC side as needed makes control of short-circuit capacity possible.
-
(4)
Power supply to weak systems or isolated islands. No voltage is needed from the outside for flexible DC transmission systems during commutation, and the system could be run in passive inversion and the passive network can be used as a receiving system to ensure stable power supply to remote areas. But reliability remains a challenge for overhead flexible DC transmission lines.
The development of high-voltage and large-capacity flexible DC transmission projects entails urgent measures to enhance the capacity, voltage level and reliability of power electronic devices. More efforts are needed to slash the cost and facilitate large-scale construction of new DC grids and the maintenance and renovation of existing ones. To accommodate large capacity, a gradual migration is required from IGBT module packaging and compression IGBT to compression IGCT in order to provide high reliability. From the material standpoint, it’s important to introduce gallium arsenide and silicon carbide as new wide band gap semiconductor materials to enable larger capacity of single semiconductor switch components. The concurrent localization efforts have brought about tremendous cost reduction. And the development of high-voltage and large-capacity equipment will greatly contribute to new breakthrough in the performance of power electronic equipment. It is projected that by 2050, key research findings from new semiconductor materials will be commercialized for massive production, with 100% localization and a big boost in the capacity and performance of equipment.
Major breakthroughs have been made in power electronics related equipment of flexible DC grids, with substantial improvement in performance of such equipment as modular multilevel converters, DC circuit breakers and DC transformers, which have seen increasing local production. To illustrate, the performance of DC circuit breakers in Zhoushan’s 5-terminal flexible DC network launched in 2016 has achieved 200 kV/15 kA/2.64 ms. Not only that, the performance of breakers in Zhangbei 5-terminal flexible DC network set to operate in 2020 has hit a new high of 500 kV/26 kA/2.64 ms, and its multi-level power electronic converter has also broken a new world record of 500 kV/3000 MW. With further upgrade in the capacity of converters, circuit breakers and other equipment, construction of flexible DC networks with larger capacity and in a wider range could be made possible by 2050.
Core power electronic devices in DC transmission (such as high-voltage high-capacity IGBT, IGCT, IETO, etc.) are expected to be fully localized in the future, and new semiconductor devices with large capacity, low cost and high reliability will be developed. Flexible DC core equipment such as modular multilevel converter (MMC), DC circuit breaker and DC transformer will be fully commercialized. As an increasingly more economically attractive option than traditional high-voltage DC transmission, flexible DC transmission is likely to be adopted as the mainstream technology for long-distance high-capacity transmission and grid interconnection. Flexible transmission and distribution technologies will produce dramatic impact on grid structure, which will be distinctly featured by the hybrid of AC/DC and multi-directional transmission. The share of distributed power supply and energy storage will be significantly increased, and energy self-sufficiency of regional grids will be improved, with a notable downsizing of backup capacity.
4.3.3 DC Distribution Network
The rapid development and wide application of new energy, information technology and power electronics technology has prompted rising demand for the amount, quality and reliability of power, which has in turn created challenges to the existing AC distribution networks in terms of distributed new energy access, diversification of load and power demand, stability and economic efficiency of power supply, etc. As urban planning has been detached from power system planning in China, the distribution network structure is not fully aligned with load development, so the planning and development of distribution networks and power quality increasingly fall short of the demand of urban development (Liu et al. 2015).
DC power grids have been mainly built on the flexible DC transmission technology. Compared with conventional DC transmission, flexible transmission requires no commutation voltage from the AC grid, and thus is highly suitable for such scenarios as isolated power supply, access to renewable power, capacity expansion and renovation in cities. In the technical report of the CIGRE working group B4.52, DC power grid is defined as a direct current network composed of a radial network of converters. DC grid is characterized by higher redundancy and more flexible and diversified operation than traditional flexible DC transmission (Boroyevich et al. 2010).
Different from AC distribution grid, power load of DC distribution grid is supplied by DC bus, which requires no extra rectifier equipment for power supply when applied to settings with large DC load, demonstrating greater advantages of application. DC distribution network features minor line loss, high reliability and strong access to distributed power supply with no need for phase-frequency control (Sun et al. 2016). The basic topological structure of DC distribution network includes ring, radial and two-terminal distribution, etc. Power supply of radial network is less reliable, but is much easier for control and protection; while that of ring network enjoys high reliability, but lacks control and protection.
Existing DC power distribution systems, such as the SBN (Sustainable Building and NanoGrids) (Marquardt 2011) proposed by Virginia Tech University of United States, adopt two voltage classes of 380 and 48 V to form a radial topology. The FREEDM (Future Renewable Electric Energy Delivery and Management) system brought up by North Carolina State University is a plug-and-play radial network (Marquardt 2011). At present, DC power distribution networks have been applied in communication power distribution, vessel power distribution and subway electric traction, etc., but the application of ring network has been a rarity, and no standards have been formulated for the selection of voltage class for corresponding DC distribution network.
On the whole, technologies for the planning and application, scheduling and control, safe operation and protection of DC distribution network are not yet mature. But with the cost reduction of power electronic devices, development and application of DC circuit breakers, flexible access of distributed energy, and fault current limits of the network, DC distribution network will promise a brighter prospect for adoption (Yan et al. 2019).
4.4 Research on Coordinated Development of Generation Mix, Grid and Load of Power System in China
4.4.1 Research on the Trend of Load Variation
In-depth analysis and accurate prediction of load characteristics are important guarantees for reliable, efficient and economical operation of power systems. In recent years, major changes have occurred in the external environment affecting the load and load characteristics of power grid, which are mainly shown in the following areas: (1) the economy has entered a phase known as the “new normal”, with accelerated structural adjustment that has exerted great impact on load composition; (2) market-based reform and liberalization of electricity sales would make for closer interaction between users and grid, hence changes in the load curve; (3) rapid growth in electric vehicles and other new electricity loads would bring considerable impact on load curve; (4) rapid development of distributed energy would be a useful supplement to the main grid, hence the importance of managing the impact of distributed energy development on grid load.
With the influence of multiple factors such as distributed energy, power market, demand response, electric vehicles and energy storage, generalized load is featured by:
-
(1)
Diverse load components. Traditional loads mainly involve electric motors, electric furnaces, lighting equipment and other electrical equipment that consume power externally. The generalized load not only involves the electrical equipment in the traditional load, but also distributed power such as distributed wind and distributed PV, as well as active loads such as energy storage and electric vehicles that can participate in demand side response.
-
(2)
Diverse impact factors. Traditional load is mainly affected by macroeconomic, demographic, meteorological and other factors, which also bring impact on the generalized load. In addition, the generalized load is also subject to many other factors. For instance, distributed wind and solar are affected by wind speed, wind direction, light radiation, cloud cover and other natural elements. The load of electric vehicles is under the impact of traffic conditions, user travel patterns, among others. Active load participation in demand management is subject to market price and demand response strategy. These factors often come together in impacting generalized load, which renders load characteristics more complex.
-
(3)
Both “load” and “generation” characteristics. When the output of distributed power supply is less than the electricity demand at the access node, the node would present the characteristics of load. And in case of greater distributed energy output than power load at its access node, the remaining energy would be transmitted to the grid, and the reverse power flow occurs, showing features of power generation. With both “load” and “generation” characteristics, this type of generalized load adds great difficulty to the planning of distribution network and calculation of power flow.
-
(4)
Ability to respond. Active loads such as energy storage and electric vehicles can change their energy consumption according to demand response. Active load can cater to the change in electricity prices and shift the load from the period with high tarrif to the one with low prices. In this way, load can be balanced through proper tarrif scheme. Active load can also boost the uptake of renewable energy via demand response and reduce the adverse impact of renewable energy access. The ability of generalized load to respond improves the safety and economy of power system operation, and may change the original curve shape and characteristics of load.
-
(5)
Strong uncertainty. The uncertainty of generalized load comprises the uncertainty of user demand, the uncertainty of distributed renewable energy output, and the uncertainty of active load response. The combined influence of multiple uncertain factors leads to great uncertainty of generalized load, bringing new challenges to the planning and operation of power grid.
-
(6)
Complex spatio-temporal characteristics. Due to the blend of diverse factors on different scales of time and space, generalized loads show complex temporal and spatial characteristics. To illustrate, generalized load at a certain point may correlate with meteorological factors, electricity prices, and renewable energy output at different previous time, meaning that it is correlated on multiple time scales. The generalized load possesses complex spatio-temporal characteristics, placing higher demands for its description, analysis and prediction methods.
Figure 4.21 illustrates the annual electricity consumption in China from 2000 to 2018. The dawn of this century witnessed rapid economic development, which pushed up demand for electricity, and the use of power rose rapidly. As time went by, China’s economy has shifted from high-speed to high-quality growth, bringing a gradual slowdown of power demand, and subsequently steadier increase in electricity use. It is projected that electricity consumption will continue to grow steadily in 2020. Without widespread extreme weather, power consumption across the country will be up 4–5% in 2020, with an overall balance of supply and demand. At the regional level, northern and central China are expected to experience power shortage at certain time slots; eastern and southern China are expected to see an overall balance; and a surplus of power supply might be found in northeastern and northwestern regions.

Annual power consumption in China from 2000 to 2018
In 2019, nationwide electricity consumption amounted to 7.23 trillion kWh, up 4.5% over the previous year. The country’s per capita consumption was 5161 kWh, and the per capita residential use was 732 kWh. The growth of electricity consumption in Q1, Q2, Q3 and Q4 was 5.5%, 4.5%, 3.4% and 4.7%, respectively. The main characteristics of electricity consumption are:
First, electricity consumption in the primary industry showed steady increase. In 2019, the industry consumed 78 billion kWh of power, up 4.5% from the previous year. The industry contributed 1.1% to the growth of power consumption in the whole country.
Second, electricity consumption of the secondary industry maintained medium-low growth. In 2019, the industry used 4.94 trillion kWh of power, an increase of 3.1% over the previous year. Quarterly growth was 3.0%, 3.1%, 2.7% and 3.5%, respectively. Consumption in the industry accounted for 68.3% of the national total, and contributed 47.9% to the growth of electricity use in the whole society.
Third, electricity consumption in the tertiary industry maintained rapid growth. In 2019, the industry used 1.19 trillion kWh, up 9.5% over the previous year, with quarterly growth of 10.1%, 8.6%, 7.7% and 11.8%, respectively. The tertiary industry and urban and rural residential use contributed 51% to the growth of electricity consumption.
Based on the clustering algorithm, the load patterns of various industries in China can be classified into the following categories: (1) “M” shape; (2) “∏” shape; (3) “__” shape; (4) “W” shape, as shown in Table 4.12. The “M” load curve has double peaks, which usually occur at 9–12 a.m. and 14–17 p.m., primarily in agriculture, forestry and animal husbandry in the primary industry, as well as labor-intensive sectors in the secondary industry and equipment manufacturing; “∏” curve mainly appears in the tertiary industry and sectors with uninterrupted noon production in the secondary industry; The “__” curve is very stable, which is mainly found in the part of secondary industry that requires continuous production and “three shifts”; The “W” mainly takes place in the secondary industry, with strong peak averting behaviors.
4.4.2 Research on Demand Response Mechanism
With the vision of high renewable energy uptake, load participation in system operation via demand response becomes a necessary technical behavior. The US Department of Energy defines demand response as a change in the electricity consumption pattern by end-users in response to real-time changes in electricity prices, or the changes in consumption pattern of users in response to economic incentives when prices are high or system reliability is threatened. China released Measures on Power Demand Side Management (DSM) in 2010, which signalled the official launch of demand response mechanism in China. In 2015, the CPC Central Committee and the State Council jointly issued Several Opinions on Further Reform of the Power System, kicking off a new round of market-based reform of the power system, building a solid foundation for the massive application of demand response. In recent years, Beijing, Shanghai and other cities have implemented a number of demand response pilot projects, which have proved to adjust the load quickly an flexibly, and reduce peak time power demand, thus verifying the engineering practicability of demand response.
Demand response technology enables power users to change their electricity consumption behavior according to the price signal or incentives of the market, in order to achieve “peak shaving” and make the power load flexible. Demand response drastically changes the mode of traditional power grid in which power supply goes with the load, taking the dispatchable resources on the demand-side as the alternative resources on the supply side. As a virtual controllable resource, demand response can be combined with a various types of power generation to overcome the adverse impact of randomness, volatility and load mismatch of new energy on the power grid, properly absorb renewable energy output, thereby providing flexibility to the system.
As an efficient load management mechanism, demand response can be grouped into two categories (Fig. 4.22): one based on prices and the other based on incentives. The former refers to the adjustment of power consumption, time and mode by users according to market price signals, which mainly includes time-of-use (TOU) tarrif, peak tarrif and real-time tarrif, etc. The latter refers to the incentives (compensation, discount, etc.) used by relevant organizations to motivate and encourage users’ involvement in load reduction, taking the load of contracted users as virtual standby resource and scheduling it. The incentive demand response mainly includes interruptible load control, direct load control and demand-side bidding, etc.

Technical categorization of demand response
In recent years, demand response technology has been widely used in many power markets, including PJM power market in the United States, NYISO power market and National Grid of the United Kingdom. At present, there is still a distance between China’s power market and developed countries, and demand response technology has not maximized its benefits in the power market. Utilizing demand response resources and improving demand-side flexibility in the power system with high proportion of renewable energy will be the top priority in the future power system development.
Since 2002, the smart grid development strategy has stressed the need to ease power shortage and absorb clean energy by adopting demand response. Afterwards, a series of policies were unveiled to strengthen its development. In 2012, Ministry of finance, National Development and Reform Commission approved Beijing, Tangshan, Suzhou, Foshan to be the first national pilot cities for DSM. In 2018, the country achieved the maximum peak power reduction of 12.45 million kW through demand response. At present, it is believed that demand response is mainly used for relieving power shortage by balancing the load and making its curve flexible. But in the future it should be more about ensuring the smooth operation of high-proportion renewable energy systems. The National Grid Energy Research Institute estimates that with the accelerated electrification, demand response resources will reach 370 GW by 2050.
4.4.3 Research on the Coordinated Development of Flexible and Balanced Generation, Grid and Load
Power system flexibility refers to the ability of a power system to adapt to random changes in power generation, grid and load at a certain cost by optimizing the allocation of available resources in the active balance of a time-scale. Based on the above definition and actual operation of the power system, five characteristics of power system flexibility could be defined, as shown in Table 4.13.
A look at new energy development in China in recent years shows that the lack of flexible resources has become one of the key impediments for the consumption of renewable energy. Despite the boom of China’s new energy in recent years, with the installed capacity of wind and solar exceeding 210 million kW and 200 million kW respectively in 2019, ranking the first in the world, serious curtailment of wind and solar have also occured. According to the data from the National Energy Administration, wind curtailment from 2012 to 2017 averaged at 12.6%; and that in most of the wind farms in the Three Northern regions even exceeded 20%. The reasons for load-shedding vary from region to region, but in essence, the uptake of renewable energy is hampered by the lack of flexibility in the power system. For power grid in north Hebei and Gansu, the main reason is the lack of power consumption and flexibility incentives; for western Inner Mongolia and three northeastern provinces, it’s mainly due to the long heating period with insufficient peak regulation of conventional units. In 2018 and 2019, the government and the industry worked hard to address wind and solar curtailment, and the wind curtailment was brought down to 7 and 4%. Figure 4.23 shows the active power balance of the system in low and high uptake of renewable energy scenarios.

Flexibility issue brought by high share of renewable energy
Currently, with the low percentage of renewable energy and lower level of volatility and uncertainty, flexibility could take a back-seat in the planning until the system is scheduled for operation. Wind and solar curtailment resulted from inflexibility in isolated areas and timeslot of the system is acceptable from an engineering standpoint. If inflexibility occurs in the future scenario with a high uptake of renewable energy in the power system, the problem will be even worse, with widespread wind and solar curtailment and a subsequent system failure, thus putting a great damper on the healthy development of renewable energy and energy reform at large.
Figure 4.24 reveals a typical day of power balance after a high proportion of wind power is connected to the grid. The green area represents the traditional load operation scenario without renewable energy; the purple shows the net load (difference between load and new energy output) operation scenario with a high percentage of renewable energy in the grid, and the shaded part means the uncertainty range. In this case, if the traditional operation mode is still being used, load shedding will occur in multiple timeslots, as shown in the red dotted line in the figure, which not only reduces the economic efficiency of power system operation, but also impedes healthy development of renewable energy.

Diagram of flexible balance of supply and demand in power system
When a high uptake of renewable energy is fed to the grid, three obvious changes emerged: (1) Steep ramping in the system was found at certain timeslots, widening the peak-valley gap, which means a substantial increase in flexibility demand; (2) Renewable energy replaces most of traditional units output, thus reducing the regulation capacity of conventional power supply (flexible supply); (3) The failure of the traditional power balance mode means the output range of traditional power supply can’t completely cover the net load area, resulting in inflexibility at certain timeslots, and a subsequent load shedding or loss of renewable energy. The current operation rules of power system put safety at the center, thus leaving no choice but load shedding. Under this circumstance, in the future when a high proportion of renewable energy power is fed to the grid, the coordinated development of generation, grid and load based on flexible balance will be inevitable.
Power flexibility measures mainly include five aspects: power flexibility transformation, energy storage, demand response, power grid expansion planning and flexibility market mechanism. The first four seek to improve flexibility from the technical perspective; the last one aims to incentivise flexibility from a market point of view. IRENA conducted a study on the cost of flexible resources for a multi-energy system, and the results are shown in Fig. 4.25.

Comparison of various flexible resources in an integrated energy system based on scale of cost and time
Now, varied measures in generation, grid, load and storage of China’s power system have been actively deployed, with fruitful results. Some parts of northern China have conducted flexibility modification of thermal power units, demonstration of large-scale energy storage in power grid, and ultra-high voltage direct currents project, among others. Jiangsu province has piloted demand response and coordination of generation, grid and load, alleviating wind and solar curtailment to some extent. But it should be noted that renewable power at the present still accounts for a small percentage in the grid. Should it continues growing to extremely high proportion (e.g. 80% or even 100% at certain timeslots), the power system will be troubled by close to zero or even negative net load. Due to the volatility of renewable energy output, the resource potential to solve flexibility problems within the power system will reach its limits. Therefore, in order to further reduce wind and solar curtailment through flexible resource planning in a more economic, efficient and holistic manner, and accommodate the future high uptake of renewable power in the grid, other forms of energy system should be introduced. The integration of other forms of energy and electricity should be utilized to study the way multi-energy integration improves system flexibility based on their physical mechanism. By doing so, the flexible balance of supply and demand of the power system could be addressed in the broader context of energy system, which would enable the move towards the electricity-predominant new generation of energy system—the energy internet.
4.5 Policies and Recommendations for Expediting Transition of China’s Power System
-
1.
The sustainable development of renewable energy should be underpinned by a range of policies in order to achieve a high share or even 100% scenario.
-
(1)
Build auxiliary service power markets to support the flexible modification of thermal power units.
Flexibility modification of thermal power units represents a relatively low cost solution with mature technology. But it must be supported by auxiliary service electricity market. Therefore, it’s a must to build a stronger national auxiliary service power market. Pilots could be conducted in provinces where renewable energy develops well.
-
(2)
Accelerate the building of a new generation of energy market system that is unified, open, competitive, orderly and coordinated.
It is important to continue to deepen reform of the power system, coordinate medium-and-long term trading of power with spot trading, and actively promote new trading methods such as green certificates for renewable energy and carbon emission rights. At the same time, establishing multi-shareholder comprehensive energy investment and operation enterprises to provide users with efficient and integrated energy services is necessary. China is actively advancing a new round of power system reform. Currently, many regions have tried out the power spot market and renewable energy green certificate trading, which unfortunately are still in the infant stage and lacks coordination. Meanwhile, the management on electricity, gas, oil, heat and other market is still fragmented without comprehensive planning. It’s advised to advance the reform of the power system, achieve the coordinated operation of medium-and-long term power trading and spot transactions, open the channel of private investment, actively establish a comprehensive energy service system, and encourage all types of energy enterprises to participate in the development of the new generation of energy market.
-
(3)
Learn from the success stories of Europe and the United States, facilitate the establishment of demand-side management in China, which should go hand in hand with power market reform.
Demand response technology is essential to accommodate the high uptake of renewable energy in the future. Now, China still lacks full-fledged market mechanism, and pilots in this regard have been mainly carried out in Beijing, Shanghai and other developed areas, with limited technology demonstration and scale-up. It’s important to strengthen and expand demonstration efforts, coupled with market pricing policies. The key step is combining demand response with the “green tariff” system. In the consumption tarrif, markup of the new energy development fund should be moderately increased, and cross-subsidies for residential electricity from industry and commerce should be reduced or scrapped. The low electricity price for residential use is the leftover of the low wage system in past, which has long been divorced from the national conditions, and has led to energy waste. “Green tariff” ensures timely payment of new energy subsidies and boost green energy development. Other measures include: to curb high consumption of electricity to save energy and power, and improve energy efficiency through multi-energy complementary measures; to reduce electricity price of industry and commerce to enhance competitiveness of Chinese products and economy; and to provide subsidies to low-income earners to ease the financial burden of power consumption.
-
(4)
Develop highly efficient, low-cost, long-life energy storage technologies and products for widespread application.
A high uptake of renewable energy is the salient feature of the future power system. All forms of energy storage devices (electricity storage, heat storage and hydrogen storage) can be used by power grid and users to contain the fluctuation and intermittency of renewable energy output, meet the stability and economic demands of distributed energy supply, and support the development of electric vehicles.
The following efforts are supposed to make: to strengthen basic research on energy storage, with emphasis on supporting the development of advanced battery energy storage materials with high energy density and low cost (e.g. grapheme), and research on improving safety and reducing negative environmental impacts; to explore the research and application of high energy density and low cost energy storage technologies such as metal aluminum air fuel cell; to carry out project demonstration and pre-commercialization support, and focus on building large-scale, high-performance, and highly reliable energy storage systems; to provide financial support for the early market players of new business models, so that emerging energy storage technologies and their operation models can be quickly introduced into the market; to reinforce supervision on the operation of energy storage power stations and enhance the market mechanism of energy storage application; to develop a sound pricing and compensation strategy to increase benefits to energy storage providers for their role in system regulation and auxiliary services; to offer economic compensation for user-side distributed energy storage; to put in place a robust medium-and-short term power market mechanism, increase market openness, and encourage competition and emerging market models; to channel private investment into energy storage development, and streamline the financing procedure of new and large storage systems.
-
2.
Multi-energy complementary and integrated development should start with the convergence of electricity and heating, which represents the crucial first step towards the vision of the energy internet.
-
(1)
Facilitate the clean and efficient development of summer air conditioning and winter heating in central China to meet the increasing demands of urban and rural residents for living comfort.
As China prioritizes its northern region for promoting clean and efficient winter heating, tailor-made efforts should also be made to target the vast central region to scale up individual or centralized air source, ground source heat pump together with sunlight, heat storage and other efficient and clean approaches of air conditioning and heating by harnessing state-of-the-art technologies and economic incentives. Where conditions permit, distributed solar power generation could also be combined. The sole dependence on traditional air conditioner leads to highly concentrated load in summer and poor comfort and low energy efficiency in winter. This must be changed to meet the pursuit of urban and rural residents for a better life.
-
(2)
Prompt energy-intensive industrial enterprises to strengthen energy conservation and multi-energy complementation.
The improvement of end-use energy efficiency contributes the most to the overall efficiency of the energy system. It’s advised to carry out in-depth investigations into various energy use in enterprises and put forward suggestions on technological measures and policy incentives. Existing studies have shown that it’s most effective to realize multi-energy complementary use of coal, gas and electricity and recycling of waste heat within large enterprises. But policy measures, including promoting win-win cooperation between energy sectors, as well as finance and taxation, need to be formulated through further investigation and research.
-
(3)
Intensify R&D and industrialization of key technologies and equipments to provide technical support for building China’s energy internet.
The first is the new generation of power electronic materials, components and power electronic equipment technology and equipment based on wide band gap semiconductor. With the extensive access of renewable energy to the grid, the new generation of power system will be characterized by the high proportion of power electronic equipment. Built on the wide band gap semiconductor, the new generation of power electronic equipment boasts high temperature resistance, high voltage and overload capability and high reliability. It’s currently under research and development for small-scale pilot production at home and abroad. It’s therefore suggested that R&D and development should be strengthened for the new generation of power electronic materials (e.g. silicon carbide), devices and equipment to boost the development of a new generation of power system and the transformation of smart grid.
The second is the gas turbine power supply for distributed energy as well as technology and equipment for the comprehensive utilization of energy. China’s distributed energy equipment is relatively underdeveloped. In particular, small and medium-sized gas turbines that use natural gas for power generation with waste heat utilization in the country mainly depend on imports, with technologies monopolized by developed countries in Europe and America. It’s advised to boost R&D research to support the development of distributed natural gas turbine.
References
Boroyevich, D., Cvetkovic, I., Dong, D., et al. (2010). Future electronic power distribution systems a contemplative view. In IEEE Conference on Optimization of Electrical and Electronic Equipment.
Du, E., Zhang, N., Kang, C., & Miao, M. (2016). Review and prospect of research on grid operation and optimization planning of solar power generation. Chinese Journal of Electrical Engineering, 36(21), 5765–5775+6019.
Hu, A. (2017). China towards 2050: Building China into a great modern socialist country in an all-round way. China Social Science Journal, 004.
Jia, Y. (2018). Characteristics and application prospect analysis of flexible direct current transmission technology. Electronic World, 12, 51+53.
Liu, Y., Jing, P., Li, G., Zhou, F., Chen, Y., Lei, X., & Chen, Y. (2015). Research on transmission mode and transmission distribution technology of DC power network. Chinese Journal of Electrical Engineering, 35(S1), 25–35.
Liu, J., Shi, D., & Li, Y. (2016). Evaluation of ecological environmental fragility and countermeasures for green development of major hydropower bases in China. China Energy, 38(04), 15–21.
Lu, Z., Huang, H., Shan, B., et al. (2017). Morphological evolution model and power forecasting prospect of future electric power systems with high proportion of renewable energy. Automation of Electric Power Systems, 41(9), 12–18 .
Marquardt, R. (2011). Modular multilevel converter topologies with DC-short circuit current limitation. In 8th International Conference on Power Electronics.
Mid-term evaluation and optimization of the 13th Five-Year Plan for electric power. (2019). China Electric Power Enterprise Management, 04, 10–14.
Peng, L., He, J., Xie, K., Tang, Y., Hu, B., Yi, J., et al. (2017). Reliability and economy comparison of UHV AC and DC transmission systems. Power Grid Technology, 41(04), 1098–1107.
Review results of hydraulic resources in People’s Republic of China. (2003). Beijing: China Electric Power Press.
Sun, P., He, C., Shao, H., Liu, X., & An, J. (2016). Research status and development of DC distribution network. Electric Power Automation Equipment, 06.
Tang, G., Pang, H., & He, Z. (2016). Development and application of advanced AC-DC transmission technology in China. Chinese Journal of Electrical Engineering, 36(07), 1760–1771.
The 13th Five-Year Plan for electric power development. (2016). China Electric Power Enterprise Management, 31, 7.
Wang, L., & Cao, Y. (2018). Review of HVDC transmission technology. Science and Technology Innovation, 10, 50–51.
Wen, J., Wu, R., Peng, C., et al. (2012). Analysis of DC grid prospects in China. Proceedings of the CSEE, 32(13), 7–12.
Xu, Q. (2018). China nuclear power waiting for restart. Energy, 08, 38–41.
Yan, S., Luo, X., & He, Z. (2019). Prospect of DC power grid core equipment and key technologies. Automation of Power Systems, 43(03), 205–216.
Zhang, T., & Gong, Y. (2016). Overview of transmission technology and operation characteristics of UHV AC-DC grid. Intelligent Power, 46(02), 87–92.
Zhou, H., & Zhong, Y. (2007). Application scenarios and technology comparison of UHV AC and DC power transmission. Electric Power Automation Equipment, 05.
Zhou, X., Chen, S., & Lu, Z. (2013). Review and prospect of power grid and technology development—A discussion on third-generation power grid. Chinese Journal of Electrical Engineering, 33(22), 1–11+S1.
Zhou, X., Chen, S., Lu, Z., Huang, Y., Ma, S., & Zhao, Q. (2018). Technology features of the new generation power system in China. Proceeding of CSEE, 38(7), 1893–1904.
Author information
Authors and Affiliations
Corresponding author
Editor information
Editors and Affiliations
Rights and permissions
Copyright information
© 2021 The Author(s), under exclusive license to Springer Nature Singapore Pte Ltd.
About this chapter

Cite this chapter
Lu, Z., Zhu, G. (2021). The Transition of China’s Power System. In: China’s Resources, Energy and Sustainable Development: 2020. Springer, Singapore. https://doi.org/10.1007/978-981-33-6100-3_4
Download citation
DOI: https://doi.org/10.1007/978-981-33-6100-3_4
Published:
Publisher Name: Springer, Singapore
Print ISBN: 978-981-33-6099-0
Online ISBN: 978-981-33-6100-3
eBook Packages: Earth and Environmental ScienceEarth and Environmental Science (R0)