
Abstract
As a common driving behavior on highways, lane changing has many effects on traffic flow. How to achieve safe, reasonable, and human-imitative autonomous lane-changing is a current research hotspot in the field of autonomous driving. Based on the driver’s lane-changing behavior data, this paper extracts lane-changing characteristic parameters reflecting the driver’s behavior, studies the human-imitative lane-changing trigger mechanism, uses polynomial curves to achieve lane-changing trajectory planning, and designs feedforward-feedback tracking controller based on preview theory. The simulation results show that this method can realize human-imitative lane change triggering, trajectory planning and good tracking control.
Access provided by Autonomous University of Puebla. Download conference paper PDF
Keywords
1 Introduction
In highway scenes, lane changing is a common driving behavior. Lane-changing behavior involves the lateral and longitudinal control of the vehicle, and is susceptible to factors such as the driver’s decision-making judgment, driving experience, and emergencies, and has a high risk. Drivers’ decision-making errors or improper operations are likely to cause traffic accidents. Therefore, research on autonomous lane changing technology has always been a core topic in the field of traffic safety.
According to the different reasons for the intention of lane change, it can be divided into Mandatory Lane Change and Discretionary Lane Change [1]. Discretionary lane changing is a driving action for better speed or space satisfaction. This article will conduct research on this.
In terms of autonomous lane-changing decision-making, scholars are committed to studying the trigger mechanism of lane-changing behavior and trajectory planning methods. In terms of the trigger mechanism of lane changing behavior, there are methods based on rules [2], stochastic utility theory [3], car-following model [4], minimum safe distance model [5]; in terms of trajectory planning, there are methods based on optimization and Search, geometry-based methods, etc. [6]. In addition, some scholars have proposed rolling window method [7] and elastic band theory [8] to realize trajectory planning.
Trajectory tracking control is another major problem in autonomous lane changing. Common methods include: optimal preview curvature control, PID control, sliding mode control, feedforward-feedback control, MPC control, etc. [9]. The above methods can be used alone or in combination in controller design to achieve good tracking of the target trajectory.
In recent years, in order to enable intelligent vehicles to have anthropomorphic decision-making and control capabilities, scholars have carried out related research on how to learn the driving behavior of drivers.
In terms of human-like lane-changing decision-making, some scholars use deep learning methods to simulate the behavior characteristics of the driver, and map the sensor information to the underlying control information of the vehicle, without relevant decision-making rules [10,11,12,13]. In terms of human-like control, there are currently training methods based on deep learning [14], optimization methods based on ant colony algorithm and fuzzy reinforcement learning, etc. [15].
The above method is based on a large amount of driving data. The human-like effect is greatly affected by the training scene and data quality, and the interpretability is poor, and it is impossible to perform qualitative and quantitative analysis of the driving characteristics of the driver.
Aiming at the above problems, in order to realize intuitive, reasonable and human-like autonomous lane changing, this paper starts from the driver’s real lane changing behavior, extracts human-like characteristic parameters, designs autonomous lane changing decision-making and tracking control algorithms. Eventually, the function verification of the lane-changing algorithm will be carried out.
2 Driver’s Lane Changing Behavior Mechanism Analysis
2.1 Lane Changing Behavior Data Collection Test
The driver’s lane-changing behavior includes a series of complex processes: the perception and judgment of the surrounding road environment, the decision of the vehicle behavior at the next moment, the execution of the decision, and control the vehicle to drive in the desired state.
In order to extract the characteristic parameters that are representative and guiding significance of the driver during the lane changing process, this paper uses the driving data acquisition platform to record the driver’s lane changing data, combining with the driver’s actual lane-changing behavior, discuss the parameters that are strongly related to the driver’s lane-changing characteristics, and then determine the data to be recorded for the lane change test.
-
(1)
Lane change behavior trigger layer
In the research on triggering of lane-changing behavior, the first consideration is the reason for the intention of lane-changing. In this paper, the minimum safe car following distance acceptable to the driver is recorded, as shown in Fig. 1. By analyzing the relative distance data between the vehicle and the preceding vehicle in the current lane, the human-like minimum safe car-following distance for lane change is obtained, which is used to trigger lane change behavior.
Fig. 1. 
Determine the characteristic parameters of the trigger layer of the lane change behavior
-
(2)
Trajectory planning layer
In the trajectory planning layer algorithm, it is proposed to use the fifth-order polynomial method for trajectory generation. In the process of determining the polynomial parameters, the lane change time is closely related to the trajectory generation. The reasonable lane change time should be within a certain range, and the human-like range can be obtained through data analysis, as shown in Fig. 2.
Fig. 2. 
Determining the characteristic parameters of the trajectory planning layer
-
(3)
Tracking control layer
In addition to ensuring the tracking accuracy of the tracking control algorithm, ride comfort and driving comfort are also important considerations. In order to evaluate the effect of the tracking control algorithm, this paper summarizes the maximum lateral acceleration and the maximum yaw angle during the driver’s lane change, as shown in Fig. 3.
Fig. 3. 
Determining the characteristic parameters of the tracking control layer


Based on the above discussion, the test data to be collected and recorded in the lane-changing driving test in this article are shown in the following table (Table 1).
2.2 Extracting Characteristic Parameters of Lane Changing Behavior
-
(1)
Human-like safe car-following distance
In the lane change test, the parameter that determines the trigger time of the lane change is the minimum safe car following distance acceptable to the driver. When the relative distance between the vehicle and the preceding vehicle is reduced to this value, the driver will have an intention to change lanes. In this paper, the minimum safe car following distance that the driver can accept extracted from the test data is defined as the human-like safe car following distance based on driving data, it is named as Data-based Anthropomorphic Safe Trailing Distance (DASTD).
From the 100 sets of DASTD values obtained in the lane change test, it can be seen that it increases with the increase of vehicle speed, and the higher the vehicle speed, the more obvious the increase. After fitting in a variety of ways, it is found that: The curve in the form of y = a × ebx can better describe the relationship between DASTD and the speed of the vehicle. The final anthropomorphic minimum safe car-following distance formula is as follows:
$$ DASTD = 5.605 \times e^{{0.02427v_{x} }} $$(1)In the formula, vx(km/h) is the speed of the vehicle. The anthropomorphic change curve of DASTD with vehicle speed obtained according to this formula is shown in the following figure, which can obtain the anthropomorphic safe car-following distance of the vehicle at any speed (Fig. 4).
Fig. 4. 
DASTD vs. vehicle speed curve at any vehicle speed
-
(2)
Human-like lane change time
Based on the data from the lane-changing test, this paper extracts the anthropomorphic lane-changing time based on driving data (Data-based Anthropomorphic Lane Change Time, Tlc-DA), take it as the characteristic parameter of the trajectory planning link. The figure below shows the distribution of Tlc-DA values of skilled drivers at different vehicle speeds (Fig. 5).
Fig. 5. 
Tlc-DA distribution map of 10 skilled drivers
-
(3)
Anthropomorphic maximum lateral acceleration
In order to intuitively associate lane-changing behavior with comfort, this article summarizes the maximum lateral acceleration of the vehicle during the lane-changing process, and obtains the anthropomorphic maximum lateral acceleration based on driving data, it is named as Data-based Anthropomorphic Maximum lateral acceleration (ay-DAmax), take it as the verification parameter of the tracking control link. The following figure shows the maximum lateral acceleration distribution of skilled drivers during lane changing at different vehicle speeds (Fig. 6).
Fig. 6. 
Ay-DAmax distribution map of 10 skilled drivers
-
(4)
Anthropomorphic maximum yaw angle
The yaw angle, as a direct manifestation of the posture of the car body, is also an important parameter that reflects the driver’s operating characteristics during lane changes. This article extracts the anthropomorphic maximum yaw angle based on driving data, it is named as Data-based Anthropomorphic Maximum Yaw Angle (φ-DAmax), it is used for the calculation of the safety judgment condition of the lane change and the parameter verification of the tracking control link. The following figure shows the distribution of φ-DAmax of skilled drivers during lane changing at different vehicle speeds (Fig. 7).
Fig. 7. 
φ-DAmax distribution map of 10 skilled drivers


3 Autonomous Lane Changing Algorithm Design
3.1 Human-Like Decision-Making Method for Autonomous Lane Changing
3.1.1 The Trigger Mechanism of Human-Like Lane Changing Behavior
This article divides the driver’s lane-changing behavior trigger process into four parts: lane-changing intention generation, target lane selection, lane-changing safety judgment, and lane-changing triggering and execution.
-
(1)
Intention to change lanes
The intention to change lanes generally comes from dissatisfaction with driving speed or driving space. This article introduces the lane tolerance variable ζ to quantify the degree of dissatisfaction. The ζ formula produced by the unsatisfied driving speed is as follows:
$$ \zeta_{n} = \left\{ {\begin{array}{*{20}l} 0 \hfill & {({\text{Still}}\;{\text{obstacles}}\;{\text{ahead}})} \hfill \\ {\zeta_{n - 1} - \frac{{v_{exp} - v_{act} }}{{v_{exp} }} \times T \times \alpha_{k} } \hfill & {({\text{Others}})} \hfill \\ \end{array} } \right. $$(2)In the formula, ζn−1 is the lane tolerance at the previous moment (take ζ0 = 1), vexp(m/s) is the desired vehicle speed, vact(m/s) is the actual vehicle speed, and T is the data sampling period. αk is the front vehicle type coefficient. When k = 0, it means that the front is a small passenger car, and k = 1 means that the front is a large commercial vehicle.
The calculation formula of lane tolerance considering the unsatisfactory driving speed and driving space is as follows, when ζ = 0, the intention to change lanes will be generated.
$$ \zeta_{n} = \left\{ {\begin{array}{*{20}l} {\zeta_{n - 1} - \frac{{v_{exp} - v_{act} }}{{v_{exp} }} \times T \times \alpha_{k} } \hfill & {({\text{No}}\;{\text{still}}\;{\text{obstacles}}\;\& \Delta D > DASTD)} \hfill \\ 0 \hfill & {({\text{Still}}\;{\text{obstacles}}\;{\text{ahead/}}\Delta D \le DASTD)} \hfill \\ \end{array} } \right. $$(3)
-
(1)
Select the target lane
Considering the requirements of traffic laws, safety and high-speed driving, this article only considers the situation of changing lanes to the left. When the traffic flow in the left lane is faster than the speed of the vehicle in front of the current lane, the left lane is selected as the target lane; otherwise, the target lane is the current lane.
-
(2)
Judge the safety of changing lanes
Minimum Safety Spacing [16] (MSS), is a common method to judge the safety of changing lanes. Based on this model, this paper considers the dynamic changes and potential dangerous situations that may occur in the driving state of the vehicle during the lane changing process, and proposes an improved minimum safe distance model for lane changing (IMSS).
Before judging the safety of lane changing, this article makes the following reasonable assumptions:
-
(1)
Except for the main vehicle, the lateral acceleration and lateral speed of other vehicles are zero;
-
(2)
Except for the main vehicle, all other vehicles are running at a constant speed, that is, the longitudinal acceleration is zero;
-
(3)
The lateral speed change will not affect the longitudinal speed.
The lane-changing scene studied in this paper is shown in Fig. 8. Define O as the main car, Fc, Rc, Ft, Rt as environmental cars.

Schematic diagram of lane-changing driving scene
The following will discuss the IMSS for changing lanes based on the lane changing scene shown in Fig. 8, and taking the vehicle in front of the current lane as an example.
During the lane change, the vehicle O may collide with Fc in a forward or side direction. Define t0 as the time when the vehicle O starts to change lanes, and t1 as the latest time when the two vehicles may collide. After t1, the two vehicles will not collide in any form. The schematic diagram of the lane change safety distance is shown below.

Schematic diagram of the lane-changing safety distance between vehicle O and Fc
It can be seen from Fig. 9 that the relative distance ΔDt0 between the two cars at time t0 only needs to ensure that the two cars do not collide at time t1, that is, the condition for vehicle O to change lanes safely is ΔDt1 > 0, where the minimum value of ΔDt0 is this scene The following IMSS value, its expression is:
In the formula, \({v}_{x}^{o}\), \({v}_{x}^{{F}_{c}}\) is the longitudinal speed of vehicle O and Fc, \({a}_{x}^{o}\) is the longitudinal acceleration of O, Wo is the width of O, θ is the yaw angle of O at time t1, and Dsafe is the safety margin.
-
(1)
Triggering and execution of lane change (Fig. 10)
Fig. 10. 
The trigger mechanism process of lane changing behavior

The trigger mechanism of lane changing behavior in this paper is shown in the figure above. details as follows:
-
(1)
The vehicle travels at a constant speed in the current lane, and when a stationary obstacle is identified in front, its tolerance ζ for the lane is reduced to a threshold value, and a lane change intention is generated.
-
(2)
If there are no static obstacles in front, and there are low-speed obstacles, the reasons for the intention to change lanes at this time are two kinds of dissatisfaction with the driving speed and the driving space.
-
(3)
After the intention to change lanes is generated, the target lane is selected based on the speed advantage.
-
(4)
Make a judgment on the safety of changing lanes. When and only when the safety conditions for the lane change are met, the lane change action can be performed.
3.1.2 Autonomous Lane Changing Trajectory Planning Method
Based on the improved potential field method, this paper constructs a safe and drivable area in the driving environment, then plans the candidate trajectory by combining the fifth degree polynomial and the human-like lane change time, and finally determines the optimal target trajectory through a multi-dimensional evaluation method.
3.1.2.1 Safe Area Modeling
-
(1)
Lane centerline constraint
In this paper, the Gauss-like function [17] is used to model the static constrained potential field of the lane centerline. The expression of the potential field is as follows:
$$ U_{{cen}} = \left\{ {\begin{array}{*{20}l} {\sum\limits_{{i = 1}}^{2} {A_{{cen}} exp\left( { - \frac{{(y - y_{{cen,i}} )^{2} }}{{2\sigma _{{cen}}^{2} }}} \right)} } \hfill & {if\;y_{{boun,1}} \le y \le y_{{boun,2}} } \hfill \\ 0 \hfill & {otherwise} \hfill \\ \end{array} } \right. $$(5)In the formula, Ucen is the value of the potential field around the centerline of the lane, Acen is the minimum value of the potential field; ycen,i is the lateral coordinate value of the ith centerline, σcen is the potential field convergence coefficient, yboun,i is the boundary of the ith lane Line lateral position.
Fig. 11. 
The constrained potential field of the lane centerline
Take a two-lane scene in the same direction as example, set Acen = −15, σcen = 1, lane width Wl = 3.75 m, ycen,1 = 0 m, ycen,2 = 3.75 m, yboun,1 = −1.875 m, yboun,2 = 5.625 m, the centerline potential field distribution is as Fig. 11.
-
(2)
Lane boundary line constraints
In this paper, the constrained potential field of the lane boundary is modeled as follows:
$$ U_{{boun}} = \left\{ {\begin{array}{*{20}l} {\sum\limits_{{i = 1}}^{2} {A_{{boun}} exp\left( { - \frac{{(y - y_{{boun,i}} )^{2} }}{{2\sigma _{{boun}}^{2} }}} \right)} } \hfill & {if\;y_{{boun,1}} \le y \le y_{{boun,2}} } \hfill \\ {A_{{boun}} } \hfill & {otherwise} \hfill \\ \end{array} } \right. $$(6)In the formula, Uboun is the value of the potential field around the lane boundary, Aboun is the maximum value of the potential field, yboun,i is the lateral position of the i-th lane boundary, and σboun is the potential field convergence coefficient.
Take the two-lane scene in Fig. 11 as example, set Aboun = 50, σboun = 1, the boundary line potential field distribution is as follows (Fig. 12):
Fig. 12. 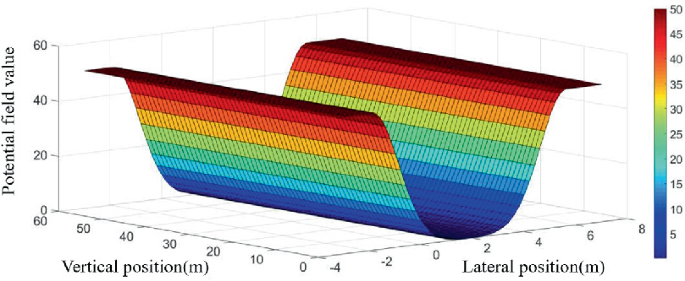
Confinement potential field of lane boundary line
-
(3)
Dynamic interference potential field
In the driving environment, in addition to the lane line constraints on driving behavior, environmental vehicles will also interfere with driving behavior. In this paper, the environmental vehicle potential field is modeled as follows:
$$ U_{obs,i} = A_{obs} exp\left( { - \left( {\frac{{(x - x_{i} )^{2} }}{{2\sigma_{{obs_{x} ,i}}^{2} }} + \frac{{(y - y_{i} )^{2} }}{{2\sigma_{{obs_{y} ,i}}^{2} }}} \right)^{n} } \right) $$(7)In the formula, Uobs,i is the potential field value of the i-th environmental vehicle, Aobs is the maximum value of the potential field of the vehicle i, (xi, yi) represents the position coordinates of the i-th environmental vehicle, and (x, y) represents any point the position coordinates of σobsx,i, σobsy,i, n are the potential field shape coefficients of the environmental vehicle.
Set Aboun = 40, lane width Wl = 3.75 m, vo = 25 m/s, front vehicle position (xFc, yFc) = (40,0), vFc = 15 m/s, the interference potential field of the vehicle ahead is shown in the figure below (Fig. 13):
Fig. 13. 
The interference potential field of the surrounding vehicles ahead when vFc = 15 m/s
-
(4)
Driving environment total potential field
The expression of the total potential field Up is as follows:
$$ U_{p} = U_{cen} + U_{boun} + \sum\limits_{i = 1}^{n} {U_{obs,i} } $$(8)In the formula, n is the number of environmental vehicles, and the value of Up intuitively reflects the level of driving risk at that place.
Set (xo, yo) = (0, 0), (xFc, yFc) = (40, 0), (xFt, yFt) = (70, 3.75), (xRt, yRt) = (−30, 3.75), vo = 25 m/s, vFc = 15 m/s, vFt = 30 m/s, vRt = 30 m/s, lane width Wl = 3.75 m, ycen,1 = 0 m, ycen,2 = 3.75 m, yboun,1 = −1.875 m, yboun,2 = 5.625 m, Acen = −15, Aboun = 50, Aobj = 40, the total potential field of the driving environment is shown in the figure below (Fig. 14):
Fig. 14. 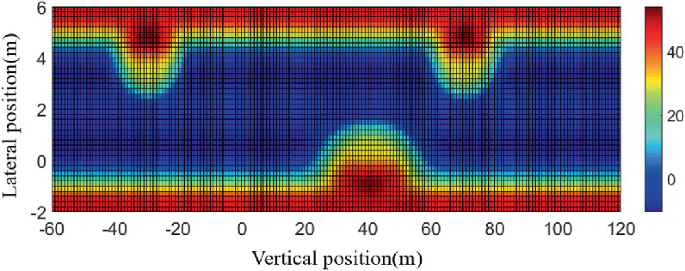
Total potential field of driving environment


In the figure, the higher the potential field value, the higher the risk, and vice versa, the lower the risk. The potential field distribution is more in line with the real driving scene, which verifies the rationality of the safe area modeling in this paper.
3.1.2.2 Lane Change Trajectory Planning
In this paper, a fifth-degree polynomial is used for trajectory generation. This method only needs the initial state and target state of the vehicle to change lanes to generate a smooth transition curve that satisfies the driving conditions. The expression is as follows:
In the formula, x(t) and y(t) are the longitudinal and lateral positions of the vehicle, ai and bi (i ∈ [0, 5]) are undetermined coefficient. After determining the initial state, the target state and the lane change time of the lane change, the undetermined coefficients can be calculated to uniquely determine a trajectory.
Based on the anthropomorphic lane-changing time, this paper generates a series of lane-changing trajectories that meet the characteristics of the driver’s behavior. The following figure shows the lane-changing trajectory clusters in the safe area when the lane-changing time is Tlc ∈ [5, 7] (Fig. 15):

Schematic diagram of lane-changing trajectory clusters
3.1.2.3 Determine the Optimal Trajectory
In order to determine the optimal trajectory at this moment in the trajectory cluster, this paper designs an evaluation method that considers driving safety, driving acceptance, and high-efficiency traffic, and establishes the following evaluation model:
In the formula, μ1, μ2, μ3 are weight coefficients, Esafety, Ecomfort, Eefficient are evaluation indicators.
-
(1)
Driving safety index Esafety
$$ E_{safety}^{i} = \frac{{U_{pmax}^{i} }}{{U_{pmax} }} \quad i \in [1,n] $$(11)In the formula, i represents the i-th trajectory, Up is the value of the potential field, and n is the total number of trajectories in the trajectory cluster.
-
(2)
Driving acceptance index Ecomfort
$$ E_{{{\text{com}}fort}}^{i} = \frac{{\kappa_{max}^{i} }}{{\kappa_{max}^{{}} }} \quad i \in [1,n] $$(12)In the formula, \(\kappa\) is the curvature value of the track.
-
(3)
Efficient accessibility index Eefficient
$$ E_{efficient}^{i} = \frac{{T_{lc}^{i} }}{{T_{lcmax} }} \quad i \in [1,n] $$(13)In summary, the evaluation model of this article is as follows:
$$ \begin{aligned} & E^{i} = \mu _{1} \frac{{U_{{pmax}}^{i} }}{{U_{{pmax}} }} + \mu _{2} \frac{{\kappa _{{max}}^{i} }}{{\kappa _{{max}}^{{}} }} + \mu _{3} \frac{{T_{{lc}}^{i} }}{{T_{{lcmax}} }} \\ & \quad \quad \quad \quad \quad \quad \quad \quad \quad \quad i \in [1,n] \\ \end{aligned} $$(14)
In order to ensure the safety of changing lanes, and to consider the requirements of high-efficiency traffic and driving acceptance, this paper takes μ1 = 0.5, μ2 = 0.3, μ3 = 0.2. The final optimal trajectory is as follows (Fig. 16):

Schematic diagram of determining the optimal trajectory
3.2 Autonomous Lane Change Tracking Control Method
Trajectory tracking control is to calculate the corresponding control amount according to the current position of the vehicle and the desired trajectory to ensure that the vehicle can track the desired trajectory well. Based on the preview-following theory, a feedforward-feedback trajectory tracking controller with adaptive preview time is designed in this paper.
3.2.1 Preview Time Adaptive
Aiming at the limitation of the traditional preview distance (equivalent to the preview time under constant speed) being a fixed value, this paper proposes an adaptive method of preview time based on the curvature of the target trajectory.
In the constant-speed lane changing conditions, the curvature of the trajectory has a significant effect on the preview distance. For road sections with different curvatures, in order to obtain a suitable driving vision, the preview distance (preview time) should be different. Therefore, based on the fixed preview time Tp0, this article introduces the modified preview time ΔTp:
In the formula, ρ is the curvature of the trajectory, ΔTpmax is the maximum value of the correction preview time, and λ is the correction coefficient. In this paper, ΔTpmax = 0.2 s, and λ = 10000.
The final adaptive preview time expression is as follows:
3.2.2 Feedforward-Feedback Controller Design
In order to ensure the accuracy of trajectory tracking, while taking into account the driver’s response lag, the nonlinear characteristics of the car under high-speed driving conditions and the adverse effects of complex driving conditions, this paper designs a trajectory tracking controller based on lateral deviation feedforward and lateral acceleration feedback. The control quantity is the steering wheel angle of the vehicle.
The steering wheel angle based on the lateral deviation feedforward is as follows:
In the formula, C(s) [18] is the correction link, \(\Delta e\) is the lateral deviation between the vehicle and the preview point, \(e^{{ - t_{d} s}}\) and 1/1 + Ths represents the driver’s response and action lag.
The steering wheel angle based on the lateral acceleration deviation is as follows:
In the formula, η is the lateral acceleration feedback coefficient [19].
Finally, the steering wheel angle obtained by the trajectory tracking controller based on lateral deviation feedforward and lateral acceleration deviation feedback is as follows:
As a result, the feedforward-feedback controller of this article is shown in the following figure (Fig. 17):

Feedforward-feedback trajectory tracking controller
4 Simulation Test Results
In this paper, a joint simulation platform based on CarSim & Simulink is built, and simulation tests are performed on typical working conditions to verify the validity and rationality of the lane-changing algorithm. The detailed parameters of the controlled vehicle model are as follows (Table 2):
In this paper, the relevant parameters of the algorithm in the simulation link are set as follows (Table 3):
The working conditions of the lane-changing scene designed in this paper are shown in the figure below (Fig. 18):

Schematic diagram of the working conditions of the lane changing scene
The position and speed information of the own vehicle and the surrounding vehicle in this working condition are as follows (Table 4):
The simulation test results of this working condition are as follows. It can be seen from the figure below that the trajectory of the vehicle during the entire lane change period is relatively smooth, and the tracking error can be maintained within the centimeter range. It can be seen that the trajectory tracking control algorithm designed in this paper has a better tracking effect (Fig. 19).

Schematic diagram of trajectory comparison and tracking error
It can be seen from Fig. 20 and Fig. 21 that the yaw angle of the vehicle changes smoothly during the lane change, and the steering wheel angle and lateral acceleration oscillate slightly after the lane change is completed. On the whole, the peak yaw angle and lateral acceleration are within the range of the characteristic parameters of the anthropomorphic lane change, and their peak values are close to the root mean square values of ay-DAmax and φ-DAmax, which reflects the lane change algorithm effectively considers comfort and anthropomorphic lane changing characteristics. It can be seen from Fig. 21(b) that the preview time can be adjusted in real time according to the curvature of the target trajectory to ensure the accuracy of trajectory tracking.

(a) Steering wheel angle curve. (b) Yaw angle curve

(a) Lateral acceleration curve. (b) Preview time curve
Figure 22 shows the lane change triggering and execution process of this working condition. Since the expected speed of the vehicle O is higher than the initial speed, the lane tolerance value due to the unsatisfied driving speed gradually decreases. At time t0, the lane tolerance value has not yet been reduced to 0, but the relative distance between vehicle O and Fc has reached the DASTD value at this moment, so the lane tolerance value is immediately reduced to 0 at time t0, resulting in an intention to change lanes.
At this time, the relative distance between the vehicle O and the surrounding vehicle is greater than the IMSS value, which meets the safety conditions, and the vehicle starts to perform the lane-changing action.
This working condition verifies the effectiveness of the autonomous lane-changing algorithm in complex working conditions, reflects the comprehensive consideration of the vehicle’s dissatisfaction with the driving speed and driving space, and generates lane-changing intentions based on the principle of safety priority, and changes with the driver. This is consistent with the driver’s lane changing behavior.

Schematic diagram of lane change trigger and execution process
5 Conclusion
In order to realize the anthropomorphic autonomous lane changing function, this paper proposes an anthropomorphic autonomous lane changing decision-making method, and designs a feedforward-feedback trajectory tracking controller. The main content and results of this article are as follows:
-
(1)
Analysis of driver’s lane changing behavior mechanism
Based on the lane-changing data of skilled drivers, the anthropomorphic safe car-following distance, lane-changing time, maximum lateral acceleration and maximum yaw angle are extracted to provide data support for lane-changing decision-making and tracking control algorithm development.
-
(2)
Design an anthropomorphic lane change decision method
In terms of the trigger mechanism of lane changing behavior: Introduce the lane tolerance variable ζ as a quantitative indicator, consider the speed advantage to select the target lane, propose an improved minimum safe distance model for lane change to judge the safety of lane change, and finally, a decision is made whether to trigger the lane change or not.
In terms of trajectory planning: use the potential field method to describe the safe and drivable area around the vehicle, combine the anthropomorphic lane change time and the fifth-order polynomial curve to generate candidate trajectory clusters, and finally design evaluation function based on driving safety, driving acceptance and efficient trafficability indicators to determine the optimal lane change trajectory.
-
(3)
Design an independent lane-changing tracking control method
Aiming at the adverse effects of fixed preview time on driving behavior and tracking effect at high driving speeds, an adaptive preview time method based on target trajectory curvature is proposed, and trajectory tracking based on lateral deviation feedforward and lateral acceleration deviation feedback is designed. The controller realizes good follow-up of the target trajectory.
-
(4)
Autonomous lane changing algorithm simulation test verification
Based on the CarSim & Simulink joint simulation platform, the simulation verification of the autonomous lane changing algorithm is carried out for typical working conditions. The results show that the decision method considering the driver’s characteristic parameters can make anthropomorphic lane changing behavior decisions, and the preview time is adaptive. The feed-feedback controller can follow the target trajectory well.
This paper studies the decision-making triggering, trajectory planning and tracking control methods of anthropomorphic autonomous lane changing under the expressway, and completes the simulation test verification. However, there are still some content that can be studied and discussed in depth, details as follows:
-
(1)
The lane change safety judgment in this article is based on the assumption that the driving state of the environmental vehicle will not change in a short time. However, in the actual road scene, the driving state of the environmental vehicle may be changeable. The next step can be to introduce the driving behavior prediction of the environmental vehicle, and make the lane changing safety judgment model more perfect.
-
(2)
The tracking control algorithm in this article only controls the steering wheel angle, and it may not be able to give full play to the lateral motion capability of the vehicle in some emergency situations. The next step can be to consider the side and longitudinal coupling control of the vehicle to improve the control performance of the controller.
References
Bevly, D., Cao, X., Gordon, M., et al.: Lane change and merge maneuvers for connected and automated vehicles: a survey. IEEE Trans. Intell. Veh. 1(1), 105–120 (2016)
Gipps, P.G.: A model for the structure of lane-changing decisions. Transp. Res. Part B: Methodol. 20(5), 403–414 (1986)
龙小强,谭云龙.微观仿真自主性车道变换模型. 公路交通科技 29(11), 115–119 (2012)
Kesting, A., Treiber, M., Helbing, D.: General lane-changing model MOBIL for car-following models. Transp. Res. Rec. J. Transp. Res. Board 1999, 86–94 (2007)
金立生, Bartvan Arem, 杨双宾, Mascha van der Voort, Martijn Tideman. 高速公路汽车辅助驾驶安全换道模型. 吉林大学学报(工学版), 39(03), 582–586 (2009)
徐杨,陆丽萍,褚端峰,黄子超.无人车辆轨迹规划与跟踪控制的统一建模方法. 自动化学报 45(04), 799–807 (2019)
Schouwenaars, T., How, J., Feron, E.: Receding horizon path planning with implicit safety guarantees. In: Proceedings of American Control Conference. IEEE (2004)
Brandt, T., Sattel, T.: Path planning for automotive collision avoidance based on elastic bands. IFAC Proc. Vol. 38(1), 210–215 (2005)
谢勇波. 智能车辆的全局路径规划与轨迹跟踪控制方法. 湖南大学 (2017)
Bojarski, M., Testa, D.D., Dworakowski, D., et al.: End to end learning for self-driving cars. arXiv (2016)
Bojarski, M., Yeres, P., Choromanska, A., et al.: Explaining how a deep neural network trained with end-to-end learning steers a car. arXiv (2017)
Chowdhuri, S., Pankaj, T., Zipser, K.: MultiNet: multi-modal multi-task learning for autonomous driving. In: 2019 IEEE Winter Conference on Applications of Computer Vision (WACV). IEEE (2019)
Chen, C., Seff, A., Kornhauser, A., et al.: DeepDriving: learning affordance for direct perception in autonomous driving. In: IEEE, pp. 2722–2730. IEEE (2015)
Rehder, E., Quehl, J., Stiller, C.: Driving like a human: imitation learning for path planning using convolutional neural networks. In: International Conference on Robotics and Automation Workshops (2017)
周新宸.基于轨迹相似性的智能汽车仿人转向控制驾驶员模型研究. 江苏大学 (2020)
Jula, H., Kosmatopoulos, E.B.: Collision avoidance analysis for lane changing and merging. IEEE Trans. Veh. Technol. 49(6), 2295–2308 (2000)
Wolf, M.T., Burdick, J.W.: Artificial potential functions for highway driving with collision avoidance. In: IEEE International Conference on Robotics & Automation. IEEE (2008)
郭孔辉. 汽车操纵动力学. 吉林科学技术出版社 (1991)
丁海涛, 郭孔辉, 李飞, 张建伟. 基于加速度反馈的任意道路和车速跟随控制驾驶员模型. 机械工程学报 46(10), 116–120+125 (2010)
Author information
Authors and Affiliations
Corresponding author
Editor information
Editors and Affiliations
Rights and permissions
Copyright information
© 2023 The Author(s), under exclusive license to Springer Nature Singapore Pte Ltd.
About this paper

Cite this paper
Zhao, W., Gao, Z., Zhang, Z., Zhu, N. (2023). Research on Human-Imitative Autonomous Lane-Changing Method on Highways. In: Proceedings of China SAE Congress 2021: Selected Papers. Lecture Notes in Electrical Engineering, vol 818. Springer, Singapore. https://doi.org/10.1007/978-981-19-3842-9_59
Download citation
DOI: https://doi.org/10.1007/978-981-19-3842-9_59
Published:
Publisher Name: Springer, Singapore
Print ISBN: 978-981-19-3841-2
Online ISBN: 978-981-19-3842-9
eBook Packages: EngineeringEngineering (R0)