
Abstract
Explosive is a kind of semi-stable substance that exhibits different levels of chemical reaction (release of heat in the form of deflagration, explosion, and detonation) when initiated by external energy. Substances that are merely explosive but unstable can’t be called explosives, they are only considered some sort of explosive substance. In recent years, the general consensus is to use the term “energetic material” to denote materials that exhibit powerful chemical reaction and generate substantial quantity of heat and gas under certain conditions.
Access provided by Autonomous University of Puebla. Download chapter PDF
1 Basic Knowledge About Explosives
1.1 Types of Explosives
Explosive is a kind of semi-stable substance that exhibits different levels of chemical reaction (release of heat in the form of deflagration, explosion, and detonation) when initiated by external energy. Substances that are merely explosive but unstable can’t be called explosives, they are only considered some sort of explosive substance. In recent years, the general consensus is to use the term “energetic material” to denote materials that exhibit powerful chemical reaction and generate substantial quantity of heat and gas under certain conditions.
Categorized according to the scope of application and based on the reaction initiated, the form of transformation and explosion, and how explosion is manifested, explosives may be classified as primer (primary explosive), high explosive (secondary explosive), gun propellant (gunpowder, booster), and pyrotechnic composition. These substances all fall within the definition of the term energetic material.
Primer is highly sensitive in most cases, and striking with a pin (impact) or spark (fire) can both cause it to explode. Since the time between ignition and detonation is extremely short (10−8 to 10−6 s), its explosion transformation is usually detonation and primarily functions as a device responsible for initiating the detonation (deflagration) of other explosives. Several of the most common primers include: mercury fulminate Hg(ONC)2, lead azide Pb(N3)2, trinitroresorcinol C6H(NO2)3O2Pb · H2O, dinitrodiazophenol or DDNP C6H2(NO2)2N2O and tetracene C2H8N10O, among others.
High explosive is relatively less sensitive and requires a primer’s blast wave or high-speed impact from a metallic object (speed ≥1000 m/s) to detonate. The explosion transformation of high explosive is usually detonation. Since low-energy initiation usually isn’t enough to cause an explosion, it is relatively safe and convenient to use. However, high explosive does explode, it is very destructive to surrounding medium, which is why it is commonly applied in scenarios that require explosion or brisance. Based on the composition, high explosive may be classified as either single-compound explosive, or multi-compound explosive based on a single-compound explosive. Some of the more common single-compound explosives include: trinitrotoluene or TNT (C7H5N3O6), triamino-trinitrobenzene or TATB (C6H6N6O6), hexanitrostilbene or HNS (C14H6N6O12), Royal Demolition Explosive or RDX among other names (C3H6N6O6), octogen or HMX (C4H8N8O8), tetryl or CE (C7H5N5O8), pentaerythrite tetranitrate or PETN (C5H8N4O12), nitroglycerin or NG (C3H5N3O9) and nitrocellulose explosives or NC (C12H16N4O18), among others. Common multi-compound explosives (if categorized based on main constituent explosive or special additive) include: hexolite (a mixture of TNT and RDX), octol (a mixture of TNT and HMX), ammonal (a mixture of TNT and ammonium nitrate), aluminized explosive (a mixture of high-energy single-compound explosive and powdered aluminum) and polymer-bonded explosives (powdered high-energy explosive as main body, mixed with additives such as polymeric binder), among others.
Propellants react to heat, but are relatively insensitive to initiation from other forms of external energy. The explosion transformation of propellant is usually stable laminar burning, and substantial quantity of high-temperature exhausted gas substances and propulsion forces are created. Propellants include explosives used for producing gas in barrel-launched systems, or rocket propellants that generate propulsion in a rocket engine. Some common propellants include: gunpowder, single-base smokeless powder (nitrocellulose powder), double-base smokeless powder (nitroglycerine powder) and triple-base smokeless powder (Trail Boss powder), among others. Common rocket propellants include: liquid rocket propellants (liquid oxygen/liquid hydrogen, liquid oxygen/kerosene), solid rocket propellants (HTPB, CTPB, etc.), and hybrid solid/liquid propellants (HTPB/liquid oxygen, etc.).
Based on physical form, explosives may be categorized as solid explosive, liquid explosive, or gas explosive.
Based on application, explosives may be categorized as military explosive or civil/industrial explosive.
1.2 Characteristics of Explosives
The chemical reaction of explosive is a stimulated/initiated reaction (only reacts when needed), and may be categorized as either thermal decomposition, deflagration, or detonation. Thermal decomposition of explosive is similar to normal organic substance. Explosives decompose at an extremely slow rate in room temperature and may be safely stored for an extensive period. However, the deflagration of explosive is unlike the combustion of normal organic substance. Explosives do not need external source of oxygen to burn, and combusts also faster than normal organic substance, the rate of which hinges on environment temperature and pressure. Detonation is a chemical reaction unique to explosives. Detonation is a rapid reaction, and the high temperature and high pressure generated are unrivaled by other forms of chemical reactions.
The exothermicity of reaction, the speed of reaction, and the substantial volume of gases generated are the three major characteristics of explosive. (1) Exothermicity of reaction: For most commonly used high explosives, the heat of explosion generated ranges from 3.71 to 7.53 MJ/kg, while temperature during explosion could reach as high as 3000–5000 °C, and the heat of explosion is symbolic of how an explosive releases its energy and works externally. (2) Speed of reaction: The speed of propagation of detonation could reach several thousand meters per second, and one way to put it is that all the potential energy before the explosion are contained within the explosive, meaning that the released energy density is extremely high. (3) Substantial volume of gases generated: This is equivalent to volume expansion by a thousand times. Before the explosion, these gases are forcefully compressed within a volume about the size of the original explosive at the instant of explosion, which is why the result generated could become high-pressure, high-temperature gas several hundred thousand times the pressure of the atmosphere. The potential energy in an explosive is instantaneously transformed into mechanical energy of the blast, which is how it releases its energy and works externally in a powerfully destructive manner.
Explosives are also characterized by their relative instability and high energy density. Explosives are comprised of oxygen elements such as O and F, and combustible elements like C, H, Si, B, Mg, and Al. The redox reaction between combustible elements and oxygen elements releases heat, and therefore, the performance and explosion process of an explosive are contingent on the proportion of combustible elements and oxygen elements in the explosive. To demonstrate the proportionate relationship between combustible elements and oxygen elements in an explosive, the concept of oxygen balance was formulated. Oxygen balance refers to the surplus or shortage of oxygen, measured in grams, contained within 1 g of the explosive itself needed to completely oxidize all combustible elements within said explosive. Oxygen coefficient A is used to illustrate the oxygen saturation level of explosive molecules:
-
When A = 1, there is just enough oxygen in the explosive to completely oxidize all combustible elements, this is said to be zero oxygen balance and this type of explosive is called zero oxygen balance explosive.
-
When A > 1, there is more than enough oxygen in the explosive to completely oxidize all combustible elements, this is said to be positive oxygen balance and this type of explosive is called positive oxygen balance explosive.
-
When A < 1, there is not enough oxygen in the explosive to completely oxidize all combustible elements, this is said to be negative oxygen balance and this type of explosive is called negative oxygen balance explosive.
When synthesizing or formulating a new explosive, it is necessary to take into consideration oxygen balance.
Generally speaking, the following five parameters are used to determine the overall performance of an explosive: heat of explosion, critical temperature of thermal explosion, volume of explosion gases, explosive velocity/detonation velocity and detonation pressure.
The heat of explosion refers to the amount of heat released by a unit of explosive when it explodes. Since the explosive reaction is extremely fast, usually the constant volume method is employed to determine the heat of explosion. It is expressed as Qv and measured in kJ/kg. Charge density has a relatively obvious influence on the heat of explosion of negative oxygen balance explosives such as picric acid and tetryl. In order to elevate the heat of explosion, zero oxygen balance is the most ideal. The addition of powdered metals such as powdered aluminum or powdered magnesium will generate a second exothermic reaction and markedly increase the heat of explosion.
Critical temperature of thermal explosion is the highest temperature that the product of explosion reaches because of the heat of explosion. It is expressed as TB and measured in K. In equation \( {T}_{\textrm{B}}={T}_0+\frac{Q_{\textrm{v}}}{\overline{c_{\textrm{v}}}} \), T0 denotes the initial temperature of the explosive, and has a value of 298 K; \( \overline{C_{\textrm{v}}} \) denotes the average specific heat capacity of molecule of product of explosion. Clearly, adjusting oxygen balance and adding powdered metal that can generate high heat into the explosive can raise the critical temperature of thermal explosion. However, if the measure adopted results in an increase in Qv that is less than the increase in \( \overline{c_{\textrm{v}}} \), the desired outcome would not be achieved.
Volume of explosion gases refers to the volume of gaseous products generated by the explosive reaction of 1 kg of explosive under standard conditions (0 °C and 100 kPa). It is expressed as V0 and measured in L/kg. Volume of explosion gases reflects the efficiency at which the heat from an explosive reaction converts into mechanical force.
Explosive velocity or detonation velocity is the velocity at which the shock wave front propagates through a detonated explosive, and is expressed as DCJ. If the explosive diameter is much larger than the critical diameter, and charge density has reached the highest theoretical density, then the detonation velocity would only be affected by the explosive’s chemical composition and structure, and not contingent on external conditions. This would be called ideal detonation velocity. In actual conditions, the charge density, charge diameter, particle size of explosive, constraints of the charge, and other aspects all have an impact on detonation velocity.
Detonation pressure is the peak dynamic pressure of the shock wave fronts of shock waves, as in the pressure of the CJ plane of the detonation. It is expressed as PCJ. Experience shows that in \( {P}_{\textrm{CJ}}=\frac{1}{4}{\rho}_{\textrm{e}}{D}_{\textrm{CJ}}^2 \), when ρe represents charge density, for some explosives there is a linear relationship between PCJ and DCJ: PCJ = 93.3DCJ − 456.
1.3 Application of Explosives
Today, explosives have found widespread applications in many areas from national defense and arms industry to various aspects of the economy, and play a crucial role in promoting advancements in civilization and society. Although explosives have a large number of military applications, from the perspective of scholars and technicians engaged in the research and production of explosives, they hope that their achievements could serve the progress of modern civilization and economic development. The Nobel Peace Prize, conceived by founder of the Nobel Prize and inventor of dynamite Alfred Nobel, epitomizes this belief. In terms of the scope of application, explosives may be classified as either military usage, civil usage, or military-civil usage.
1.3.1 Military Usage
Due to the complications in the purpose of usage and environment of battlefield, usually explosives for military usage have very high requirements in terms of performance and safety. Different ammunitions with different purposes have different charge requirements. For examples: The jet penetration capacity crucial to anti-armor shaped charges is proportionate to the explosive’s detonation pressure, and therefore requires explosives with high detonation pressure; anti-ship missile warheads require penetration of the hull armor of vessel before detonation, and therefore require explosives that are not only powerful but also have specific demands in terms of sensitivities to impact and shock wave; bunker buster warheads are designed to penetrated targets buried deep underground, and therefore have even more stringent demands in terms of sensitivities to impact and shock wave; weapons used for underwater detonations usually desire more powerful shock wave and gas bubble, thus aluminized explosives with high heat of explosion and detonation velocity are chosen; blast and fragmentation warheads have to account for damage created by both blast and fragmentation, and therefore the explosives used commonly have to possess high charge density, high heat of explosion and detonation velocity; for explosives used in nuclear weapons, safety is of utmost importance, and must be extremely retarded against heat, mechanical force, and shock wave, with TATB-based polymer-bonded explosive (PBX) being the most frequent option.
1.3.2 Civil Usage
The quantity of explosives deployed for civil usage in China is enormous, upwards of millions of tons and still growing at a rapid pace. Civil or industrial explosives include emulsion explosives, powder emulsion explosives, expanded nitramine explosive and modified AN/FO, among other choices. Industrial explosives are often used in mining and construction, with the majority of around 80% deployed in the mining of coal, metals, and non-metal resources. Coal mines have to guard against gas explosion, and usually emulsion explosives or colloidal nitroglycerine explosives with good water-resistance, low heat of explosion, and shortened explosion duration are optimal; metal mining often takes place at sites with hard rocks, and therefore cheap and powerful explosives are desirable; for civil engineering, it is necessary to minimize impacts on surrounding people and structures, which is why non-explosive demolition agents are frequently used; moreover, explosives have also been widely applied to assist in oil and gas well drilling and to create seismic waves for investigation about the Earth’s structure and interior. China is administering increasingly strict requirements in the safety, reliability, and environment friendliness of industrial explosives. Effective from June 30th, 2018, China has banned the production, sales and usage of blasting fuse, flash detonator, and explosives contained ammonium nitrate and trinitrotoluene.
1.3.3 Military-Civil Usage
Many applications of explosives can be used in both the military and civilian sector. The propellants and initiator explosive for rockets could be military or civil, depending on whether the payload is intended for a military purpose or for peaceful purpose. The processing of explosives (synthesize, compress and connect, cut, form, etc.), emergency escape and ejection system, airbag and other applications may also fall under either military or civil usage depending on the intended user.
2 Basic Knowledge About Detonation
2.1 The Detonation Process
In the broad sense, explosion includes physical explosion, chemical explosion, and nuclear explosion. Characteristics of an explosion: A tremendous amount of energy is rapidly released or converted from a limited volume, leading to a jump and abrupt rise in the pressure and temperature of the medium surrounding the center of explosion. This kind of abrupt jump in pressure is the fundamental force behind the destructive power of an explosion. The detonation pressure of vapor cloud or dust explosion is usually measured in the MPa range and temperature around (3–5) × 105 K; for condensed explosives, detonation pressure is usually measured in the GPa range and temperature around (3–5) × 105 K; within a nuclear blast zone, detonation pressure is usually measured in the 1000 TPa range and temperature around 107 K; this book mainly focuses on the chemical explosion of explosives. The detonation process of an explosive is an extremely complicated process of chemical reaction accompanied by the rapid and violent release of energy, but may be roughly divided into two phases: In the first phase, the internal energy of the explosive is being released rapidly, and the high-temp, high-pressure detonation product starts to forcefully compress the medium in the surrounding, and this phase could be deemed a stage in which the internal energy of the explosive converts into the compressed energy of the detonation product; and in the second phase, the detonation product propagates through the surrounding medium in the form of blast wave, and this phase may be considered a stage in which the compressed energy is released, and expands and works externally. Since the propagation of detonation is the propagation of blast wave, it is therefore mandatory to first gain an understanding about the basics of shock waves and blast waves.
2.2 Basics About Shock Waves and Blast Waves
2.2.1 Basics About Shock Waves
A medium turns into a wave when disturbed, or to put it differently, a wave is the propagation of the disturbance in the medium. Take for example piston motion in a one-dimensional pipe filled with gas. When the piston moves with increasing speed and compresses the gas, it creates disturbances in the gas in the tube that are increasingly faster and stronger. Subsequent disturbances catch up to and add to previous disturbances, ultimately leading to abrupt jumps in the parameters of the state of the medium (pressure P, density ρ, and temperature T) and particle velocity u, creating a strong discontinuity surface. The strong discontinuity surface of a shock wave propagates through the medium, and this strong discontinuity surface causes the parameters of the state and particle velocity of the medium on the two sides to change abruptly, as in:
This strong discontinuity surface is the shock wave front. Its identifying property is the abrupt changes in the region of the front, and abrupt changes in the parameters of the state of the medium at the wave front are highly destructive.
Shock waves propagate through medium but can also propagate as a field (i.e., electromagnetic field).
-
1.
The relationship between the physical quantities upstream and downstream of the shock wave front. Assuming that the front of the shock wave is a plane, since the shock wave propagates extremely quickly, we can ignore the viscosity and heat transfer of the medium, or in other words, we can consider this propagation process an adiabatic process. The symbol D denotes the speed of propagation of the shock wave in the medium, subscript “0” represents the physical quantities upstream (in front) of the shock wave front, while subscript “H” indicates physical quantities downstream (behind) of the shock wave front (Fig. 1). For the sake of research convenience, coordinates are set on the shock wave front, as in the use of stationary relative coordinates on the shock wave front. In this coordinates system, the speed of the incoming shock wave is D − u0, while the speed of the outgoing shock wave is (D − uH), meaning that the physical quantities upstream and downstream of the shock wave front obey the conservation laws of mass, momentum, and energy. Assuming that u0 = 0, then the relationship may be expressed as:
Equation of mass conservation:
$$ {\rho}_{\textrm{H}}\left(D-{u}_{\textrm{H}}\right)={\rho}_0D $$(1)Equation of momentum conservation:
$$ {P}_{\textrm{H}}-{P}_0={\rho}_0D{u}_{\textrm{H}} $$(2)From Eqs. (1) and (2), particle velocity uH and shock wave velocity D may be respectively obtained:
$$ {u}_{\textrm{H}}=\left({v}_0-{v}_{\textrm{H}}\right)\sqrt{\frac{P_{\textrm{H}}-{P}_0}{v_0-{v}_{\textrm{H}}}} $$(3)$$ D={v}_0{\left(\frac{P_{\textrm{H}}-{P}_0}{v_0-{v}_{\textrm{H}}}\right)}^{1/2} $$(4)Equation of energy conservation:
$$ {P}_{\textrm{H}}{u}_{\textrm{H}}={\rho}_0D\left[\left({e}_{\textrm{H}}-{e}_0\right)+\frac{1}{2}{u}_{\textrm{H}}^2\right] $$(5)In the equation: ρ is density, u is particle velocity, P is pressure, and e is internal energy.
In combination with outcomes from the two aforesaid conservation laws, specific energy increases caused by compression of the shock wave or the Hugoniot energy equation may be derived:
$$ {e}_{\textrm{H}}-{e}_0=\frac{1}{2}\left({P}_{\textrm{H}}+{P}_0\right)\left({v}_0-{v}_{\textrm{H}}\right) $$(6)In the equation, v = l/ρ. The three conservation equations include the five parameters of PH, vH, eH, D, and uH5. To close the system of equations, two more equations are needed, with one being that of the state of the material. In order to avoid adding new variables, only equation related to the thermodynamics of the quantities of the state of the materials P, v, and e is used. It is expressed as P = f(e, v).
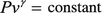
For ideal gas, the formula for its state is:
$$ P=\rho RT $$(7)The other equation needed is the adiabatic relationship of the shock. For an ideal gas that satisfies polytropic adiabatic process
 , the internal energy function may be expressed as:$$ e=\frac{Pv}{\gamma -1} $$(8)
In the equation: γ is the polytropic index, \( \gamma =\frac{c_{\textrm{P}}}{c_{\textrm{v}}} \), equation transformation (6) can obtain the polytropic gas shock adiabatic line, or the Hugoniot adiabatic line:
$$ \frac{P_{\textrm{H}}}{P_0}=\frac{\frac{\gamma_{\textrm{H}}+1}{\gamma_{\textrm{H}}-1}\frac{\rho_{\textrm{H}}}{\rho_0}-1}{\frac{\gamma_0+1}{\gamma_0-1}-\frac{\rho_{\textrm{H}}}{\rho_0}} $$(9)For a solid material, the Gruneisen equation of state is used:
$$ P-{P}_{\textrm{K}}(v)=\frac{r(v)}{v}\left(e-{e}_{\textrm{K}}\right) $$(10)In the equation: r is the Gruneisen parameter, and the subscript “K” represents absolute zero.
Shock adiabatic relationship of solid material PH = f(vH) was obtained through experimentation.
Equation for isentropic state is also a common equation of state.
$$ P=A(S){\rho}^n+B $$(11)For a specific material, A, B, and n are constants. Thus, in the isentropic state equation, the material’s pressure P is only associated with density ρ.
-
2.
Rayleigh line, Hugoniot curve, and isentropic line may be obtained from equation transformation (4)
$$ P-{P}_0=-\frac{D^2}{v_0^2}\left({v}_1-{v}_0\right) $$(12)This is expressed as a straight line with slope \( -\frac{D^2}{v_0} \) that passes by the points (P0, v0) on the plane (P, v). This is called the Rayleigh line or velocity equation of the waves. D will show straight lines with different slopes, as in the higher the shock wave velocity D, the steeper the straight line (Fig. 2).
As mentioned above, different material states of different medium have different equations, and therefore the Hugoniot adiabatic line also differs. \( \frac{\textrm{d}P}{\textrm{d}v}<0 \) and \( \frac{{\textrm{d}}^2P}{\textrm{d}{v}^2}>0 \) can be proven, showing how the Hugoniot adiabatic line is a concave curve on the plane (P, v), which is why the line is called the Hugoniot curve. For the same medium, the Hugoniot curve reflects the total of downstream states (PH, vH) of the shock wave for the corresponding upstream state (P0, v0). Therefore, the Hugoniot curve is not a line of process.
Equation (6) should be modified as:
$$ H\left(P,v\right)={e}_{\textrm{H}}-{e}_0+\frac{1}{2}\left({P}_{\textrm{H}}+{P}_0\right)\left({v}_{\textrm{H}}-{v}_0\right) $$(13)In combination with the first law of thermodynamics, it can be proven that at point (P0, v0), \( {\left.\frac{\textrm{d}S}{\textrm{d}v}\right|}_0=0 \), \( {\left.\frac{{\textrm{d}}^2S}{\textrm{d}{v}^2}\right|}_0=0 \) meanwhile \( {\left.\frac{{\textrm{d}}^3S}{\textrm{d}{v}^3}\right|}_0>0 \). In the equation, S represents entropy, indicating that upstream and downstream of the shock wave, the increase in entropy (S) takes place in third order small quantities, and the isentropic state equation (11) may be applied.
The isentropic state equation (11) mirrors the course of changes in the isentropic state, and this is called the isentropic line. \( \frac{\textrm{d}P}{\textrm{d}v}<0 \), \( \frac{{\textrm{d}}^2P}{\textrm{d}{v}^2}>0 \) can also be proven, indicating that the isentropic line on plane (P, v) is also a concave curve. The isentropic line is a process line that reflects changes in the state, and for the same upstream state (P0, v0), different entropy (S) value corresponds to different isentropic line (Fig. 3).
-
3.
Relationship between Hugoniot curve, isentropic line, and isotherm line. Thermodynamics theories prove \( {\left.\left[\frac{\textrm{d}{P}_{\textrm{H}}}{\textrm{d}v}-\frac{\textrm{d}{P}_{\textrm{S}}}{\textrm{d}v}\right]\right|}_0=0 \), \( {\left.\left[\frac{{\textrm{d}}^2{P}_{\textrm{H}}}{\textrm{d}{v}^2}-\frac{{\textrm{d}}^2{P}_{\textrm{S}}}{\textrm{d}{v}^2}\right]\right|}_0=0 \), and \( {\left.\left[\frac{{\textrm{d}}^3{P}_{\textrm{H}}}{\textrm{d}{v}^3}-\frac{{\textrm{d}}^3{P}_{\textrm{S}}}{\textrm{d}{v}^3}\right]\right|}_0\ne 0 \) at point (P0, v0) on the P − v plane, demonstrating that Hugoniot curve and isentropic line from the same initiate state [point (P0, v0)] are tangent at second order. Due to the rise in entropy during the shock’s compression, the A in the corresponding Eq. (11) increases, and when specific volume is the same, the pressure of Hugoniot curve is higher than that of the isentropic line, which is why the Hugoniot curve is located above the isentropic line. Meanwhile, the temperature of the isentropic line increases but that of the isotherm line remains the same. The work along the isentropic line is higher than that of the isotherm line, which is also why the isentropic line is located above the isotherm line. Theoretically speaking, under low pressure conditions, the Hugoniot shock adiabatic line and the isentropic line are very close, and during experimentation, due to some uncertainties in measurement, the Hugoniot shock adiabatic line and the isentropic line were difficult to distinguish under the pressure of 20 GPa as measured in actual experiment (Fig. 4).
-
4.
Relationship between shock wave velocity D and particle velocity downstream of the wave uH. Theoretical analysis and empirical experiment show that shock wave velocity D and particle velocity downstream of the wave uH share a linear relationship under a rather broad spectrum of pressure in many different materials.
$$ D={c}_0+\lambda {u}_{\textrm{H}} $$(14)In the equation, c0 and λ are constants. Table 1 shows the ρ0, c0, and λ values of several common materials.
-
5.
Shock wave front structure. When inferring the shock wave front upstream and downstream physical qualities in the above segment, the viscosity and heat transfer of the medium were ignored, holding that the parameters of states and parameters of motions on the front of the shock wave do not exhibit tiered jumps with slope, and considering the front of the shock wave as a plane with abrupt jump in pressure (Fig. 5). However, shock waves in the real world do not behave as such, and parameters of states and parameters of motions on the front of the shock wave do actually exhibit tiered jumps due to the influences of the viscosity (internal friction) and heat transfer of the medium, it’s just that the tiers are extremely steep. Therefore, shock wave fronts in the real world are not perfect planes but possess a narrow transition zone with width d (Fig. 6). Using system of molecular dynamics equations that take into consideration heat transfer and viscosity, in tandem with measurements from actual experimentation, it can be shown that the width d of shock wave front and mean free path γ of molecules upstream of the shock wave exist on the same order of magnitude, demonstrating that the transition zone is very narrow (roughly several γ). The patterns of changes of the various physical qualities upstream and downstream of the shock wave front also differ. Figure 7 reflects the distribution of electron temperature T0, ion temperature TH, and density ρ upstream and downstream of shock wave fronts in the real world.
The purpose of expounding the structure of shock wave front is to explain that the relationships between physical qualities upstream and downstream of the shock wave front established in the above segment are only applicable to the state of medium upstream and downstream of the shock wave front. To study about the changes in states of medium in the transition zone, it is necessary to also take into full account the influences of the viscosity and heat transfer.
-
6.
Relationship between shock wave front velocity and sound velocity. The velocity of sound is the speed of propagation of micro disturbances. The process of propagation of the velocity of sound is an isentropic process, and in a polytropic gas, sound velocity may be expressed as:
$$ c=\sqrt{kRT} $$(15)In the equation, k denotes the polytropic index of the isentropic equation of the polytropic gas. By applying (15) to the relational expression for physical quantities upstream and downstream of shock wave front, it can be demonstrated that relative to undisturbed medium (upstream of wave):
$$ D>{u}_0+{c}_0 $$(16)The front of the shock wave moves at supersonic velocity, and the front can catch up to any disturbances propagating ahead. After a shock wave propagates through a medium, the medium obtains the same velocity that moves in the same direction as the propagation of the wave, as in u − u0 > 0, and relative to the disturbed medium (downstream of wave):
$$ D<{u}_{\textrm{H}}+{c}_{\textrm{H}} $$(17)The front of the shock wave moves at subsonic velocity, and any disturbance behind the shock wave front could catch up to the front and change its power.
 , the internal energy function may be expressed as:
Relationship of physical quantities on the two sides of shock wave front

Velocity line of shock wave

Rayleigh line, Hugoniot curve, and isentropic line of shock wave

Hugoniot curve, isentropic line, and isotherm

Pressure jump in ideal shock wave

Pressure jump in real shock wave

Temperature and density distribution of shock wave
2.2.2 Basics About Detonation Wave
-
1.
The Chapman-Jouguet theory about detonation wave. Results from studies about disastrous gas explosions in coal mines between the end of the nineteenth century and the start of the twentieth century formed the foundation for classical theory of detonation wave fluid dynamics. In order to explain why different ignition conditions in experiment resulted in massive differences in the velocity of the propagation of flame inside channels filled with flammable gas that ranged from several meters per second to several thousand meters per second, Chapman (in 1899) and Jouguet (in 1905) respectively put forth the notion to simplify the detonation process into a one-dimensional propagation of strong discontinuity surface that includes chemical reaction, and they referred to this strong discontinuity surface as the detonation wave. The Chapman-Jouguet theory, or the C-J theory, is a fluid dynamics theory about detonation wave that simplifies the detonation wave into a strong discontinuity surface that includes chemical reaction. The C-J theory holds that detonation occurs on an infinitely thin shock wave front at an instant, it is unnecessary to account for chemical reaction process, the laws of conservation are still satisfied upstream and downstream of the wave front, effects of chemical reaction are summarized as an external and added energy, which is reflected in the fluid dynamics energy equation as the thermal effect at the termination state of the reaction. Thus, a detonation wave is a powerful shock wave that has a chemical reaction zone and that propagates as supersonic velocity.
-
(a)
Basic relational expression of detonation wave: The C-J theory simplifies the detonation wave into a strong discontinuity surface that includes chemical reaction, and may be understood as a kind of strong shock wave that propagates within the explosive medium. The mass conservation and momentum conservation relationships in physical quantities upstream and downstream of shock wave front are also applicable to detonation wave, but the difference is that the powerful impact and compression generate high temperature and high pressure, which in turn cause chemical changes in the explosive medium. The energy released in chemical reaction maintains and guides the shock wave’s self-sustaining propagation inside the explosive. In terms of the relationship of conservation of energy, it is necessary to consider the heat of reaction in the products of the chemical reaction (detonation products).
Similar to the analysis method for the front of shock wave, the origin of coordinates is set on the front of detonation wave, which means using stationary relative coordinates established on the detonation wave front (Fig. 8). With the propagation velocity of detonation wave established as D, in this coordinates system the velocity of incoming detonation wave is D, while the velocity of the outgoing detonation wave is (D − uH), meaning that the physical quantities upstream and downstream of the shock wave front obey the conservation laws of mass, momentum, and energy.
$$ {\rho}_{\textrm{H}}\left(D-{u}_{\textrm{H}}\right)={\rho}_0D $$(18)$$ {\rho}_{\textrm{H}}{\left(D-{u}_{\textrm{H}}\right)}^2+{P}_{\textrm{H}}={\rho}_0{D}^2+{P}_0 $$(19)$$ \left(\frac{P_{\textrm{H}}}{\gamma -1}+\frac{1}{2}{\rho}_{\textrm{H}}{\left(D-{u}_{\textrm{H}}\right)}^2-Q{\rho}_{\textrm{H}}+{P}_{\textrm{H}}\right)\left(D-{u}_{\textrm{H}}\right)=\left(\frac{P_0}{\gamma -1}+\frac{1}{2}{\rho}_0{D}^2+{P}_0\right)D $$(20)$$ {u}_{\textrm{H}}=\left({v}_0-{v}_{\textrm{H}}\right)\sqrt{\frac{P_{\textrm{H}}-{P}_0}{v_0-{v}_{\textrm{H}}}} $$(21)Then remove uH in the equation of mass conservation and energy conservation equation to obtain the Rayleigh line:
$$ {\rho}_0^2{D}^2-\left({P}_{\textrm{H}}-{P}_0\right){\left(\frac{1}{\rho_0}-\frac{1}{\rho_{\textrm{H}}}\right)}^{-1}=0 $$(22)Since ρ = 1/v and v is specific volume, the above equation may be rewritten as
$$ {P}_{\textrm{H}}={P}_0+\frac{v_0-{v}_{\textrm{H}}}{v_0^2}{D}^2 $$(23)$$ \textrm{Or}\ \textrm{rewrittenas}:\kern0.875em D={v}_0{\left(\frac{P_{\textrm{H}}-{P}_0}{v_0-{v}_{\textrm{H}}}\right)}^{1/2} $$(24)The Rayleigh line of detonation wave does not include energy, and its nature is identical to the Rayleigh line of shock wave. Based on the constancy hypothesis of the detonation process, D is constant, Eq. (23) is expressed as a straight line with slope \( -\frac{D^2}{v_0} \) that passes by the points (P0, v0) on the plane (P, v). This is called the detonation wave’s Rayleigh line or velocity equation of the waves. For the same state upstream of the wave (P0, v0), different shock wave velocities D will show straight lines with different slopes, as in the higher the shock wave velocity D, the steeper the straight line. When D = 0 the straight line is horizontal, and when D = ∞ the straight line is vertical, as in an instantaneous explosion.
When uH and D are removed from Eq. (20), and when the other two conservation conditions are applied, then the Hugoniot adiabatic line of the detonation wave may be obtained:
$$ {e}_{\textrm{H}}\left({P}_{\textrm{H}},{v}_{\textrm{H}}\right)-{e}_0\left({P}_0,{v}_0\right)=\frac{1}{2}\left({P}_{\textrm{H}}+{P}_0\right)\left({v}_0-{v}_{\textrm{H}}\right)+Q $$(25)In the equation, eH is the specific internal energy of the products downstream of the reaction zone; e0 is the specific internal energy of the explosive; and Q is the heat released by the explosive of a unit mass, equating to the specific heat QPv released by chemical reaction under constant pressure (P = P0) and constant volume (v = v0).
-
(b)
Hugoniot curve of detonation wave: The Hugoniot adiabatic line of the detonation wave is a concave line on the plane (P, v), and is also known as the Hugoniot curve of the detonation wave. For the same medium, Hugoniot curve of a detonation wave reflects the total of downstream states (PH, vH) under the effects of the detonation wave for the corresponding upstream state (P0, v0).
Although the Hugoniot curve of a detonation wave and the Hugoniot curve of a shock wave look similar, they are completely different in terms of physical significance. The Hugoniot curves of shock waves always begin at (P0, v0), but the right side of Eq. (25) includes the release of chemical energy, and the Hugoniot curve of a detonation wave expresses the curve of the state of energy increase in the detonation products. Therefore, it is located above the Hugoniot curve of shock wave, which does not possess chemical reaction, and does not necessarily pass through the point (P0, v0). Since the impact compression provides an activation energy that can initiate a reaction, when the explosive medium in a non-reaction layer is impacted and compressed by detonation wave from the layer above, it would be activated from its initiation state at point A (P0, v0) to point C (P1, v1) in the intermediate state of the shock wave Hugoniot curve, then undergoes chemical reaction along the Rayleigh line of the detonation wave. Heat of reaction is released (heat of explosion Q), and the chemical reaction final state point B (P2, v2) of this layer of explosive is the tangent point between the Hugoniot curve of the detonation wave and the Rayleigh line of the detonation wave (Fig. 9). When the chemical reaction of this layer of explosive finishes, it would activate chemical reaction in the next layer of explosive. Therefore, energy released in chemical reaction maintains and guides the shock wave’s self-sustaining propagation inside the explosive.
Next, let us discuss about the physical significance of the various branches of the Hugoniot curve of detonation wave. In accordance with the previous analysis, the Hugoniot curve of a detonation wave reflects the total of downstream states (PH, vH) under the effects of the detonation wave for the corresponding upstream state (P0, v0). Upstream states (P0, v0) are graphed as vertical line and horizontal line, and they respectively cross the Hugoniot curve at the points A and B (Fig. 10). Then graph two straight lines from point (P0, v0) that are tangent to the Hugoniot curve respectively at the points C and D.
At point A, with vH = v0 and Eq. (24), it can be known that D → ∞ corresponds to specific volume detonation.
At point B, with PH = P0 and Eq. (24), it can be known that D = 0 corresponds to specific pressure combustion.
At point C, with \( {\left(\frac{\textrm{d}P}{\textrm{d}v}\right)}_{\textrm{H}}={\left(\frac{\textrm{d}P}{\textrm{d}v}\right)}_{\textrm{S}}={\left(\frac{P_{\textrm{H}}-{P}_0}{v_{\textrm{H}}-{v}_0}\right)}_{\textrm{R}} \), the subscripts “H,” “S,” and “R” respectively denote the Hugoniot curve, isentropic curve, and Rayleigh line. Point C is the point of common tangent between the three lines, and since it corresponds to C-J detonation, it is generally referred to as the C-J detonation point.
For area PH > P0, vH < v0 above point C of detonation wave Hugoniot curve, with (21) and (24) it can be known that D > 0, u > 0, direction of motion of products is identical to the direction of propagation of detonation wave, and it is a detonation state known as detonation branch. Detonation branch may be sub-divided into strong detonation branch and weak detonation branch. At the segment CS, PH > PCJ is called strong detonation branch, and at segment CA, PH > PCJ is called weak detonation branch.
Point D, \( {\left(\frac{\textrm{d}P}{\textrm{d}v}\right)}_{\textrm{H}}={\left(\frac{P_{\textrm{H}}-{P}_0}{v_{\textrm{H}}-{v}_0}\right)}_{\textrm{R}} \) corresponds to C-J combustion point.
For area PH < P0, vH > v0 above point B of detonation wave Hugoniot curve, with (21) and (24) it can be known that D > 0, u < 0, direction of motion of products is opposite to the direction of propagation of detonation wave, and it is a combustion state known as combustion branch. The combustion branch too is divided into the strong combustion branch and the weak combustion branch. At the segment DW, vH > vCJ is called strong combustion branch, and at segment DB, vH < vCJ is called weak combustion branch.
At segment AB, PH > P0, vH < v0, with (21) and (24) it can be known that D and u are imaginary numbers, and do not correspond to any actual constant process (Fig. 11).
-
(c)
Conditions for steady propagation of detonation wave: Detonation branch is sub-divided into strong detonation branch and weak detonation branch, and the main difference between the two is the velocity of propagation. From O (P0, v0), mark three Rayleigh lines with detonation velocities DW, DCJ, and DS, and these three Rayleigh lines respectively does not intersect, is tangent to, and intersects with the Hugoniot curve (Fig. 11). The corresponding relationships are as below:
-
In case of detonation velocity DW < DCJ, there are no intersection point and no solution.
-
In case of DS > DCJ, there are two intersection points and two solutions:
Given a “strong” solution S: uH + cH > D, detonation wave velocity is subsonic compared to the medium downstream, and this is called strong detonation.
A “weak” solution W: Given uH + cH < D, detonation wave velocity is supersonic compared to the medium downstream, and this is called weak detonation.
This means that two different chemical reaction states in the explosive can achieve a uniform detonation velocity, which does not comply with physics principles.
-
In case of detonation velocity DCJ, there is only one point of tangent, and the only solution C: uH + cH = D. In other words, the flow of products downstream of the shock wave is equal to the local sonic velocity, and usually that point is called the C-J point. Following the Hugoniot curve of the detonation products, entropy reaches its smallest value at C-J point, as in dS = 0 and also uH + cH = D. This reflects the state of the constant detonation wave and is called the C-J condition.
Strong detonation is actually a kind of overcompressed detonation state. Due to uH + cH > D, the rarefaction wave downstream of the detonation wave will catch up to the wave front, causing unsteady motion in the wave front. Detonation at this phase is unsteady, until uH + cH = D, when a steady state could be maintained downstream of the wave front. Weak detonation is actually a kind of undercompressed detonation state. Due to uH + cH < D, the disturbance downstream of the detonation wave cannot catch up to the wave front, and the shock wave ahead won’t receive continual energy supply. The strength and velocity of the detonation wave will continue to weaken, and this is an unsteady state of detonation propagation. Only the C-J point can maintain a steady state downstream of the wave front, and this is the C-J condition that is a requisite for steady detonation propagation.
-
-
(d)
Calculation of detonation wave parameters: The six physical quantities that describe the explosive’s detonation process are PH, ρH, TH, eH, uH, and D, and they are calculated using the following six basic equations:
$$ {e}_{\textrm{H}}-{e}_0=\frac{1}{2}\left({P}_{\textrm{H}}+{P}_0\right)\left({v}_0-{v}_{\textrm{H}}\right)+Q $$(26)$$ D={v}_0\sqrt{\frac{P_{\textrm{H}}-{P}_0}{v_0-{v}_{\textrm{H}}}} $$(27)$$ {u}_{\textrm{H}}=\left({v}_0-{v}_{\textrm{H}}\right)\sqrt{\frac{P_{\textrm{H}}-{P}_0}{v_0-{v}_{\textrm{H}}}} $$(28)$$ \frac{P_{\textrm{H}}-{P}_0}{v_0-{v}_{\textrm{H}}}={\left(-\frac{\textrm{d}P}{\textrm{d}v}\right)}_{\textrm{S}}=\frac{k{P}_{\textrm{H}}}{v_{\textrm{H}}} $$(29)$$ {P}_{\textrm{H}}=F\left({\rho}_{\textrm{H}},{e}_{\textrm{H}}\right) $$(30)$$ {P}_{\textrm{H}}=f\left({\rho}_{\textrm{H}},{T}_{\textrm{H}}\right) $$(31)The last two equations are state equations for the detonation products, and depend on the medium through which the detonation wave propagates. For example, when a detonation wave propagates through a mixture of ideal gases, then the ideal gas state formula may be used:
$$ {P}_{\textrm{H}}={\rho}_{\textrm{H}}R{T}_{\textrm{H}} $$(32)Due to R = Cv(γ − 1), the above equation should be rewritten as:
$$ {P}_{\textrm{H}}={\rho}_{\textrm{H}}{T}_{\textrm{H}}{C}_{\textrm{v}}\left(\gamma -1\right) $$(33)Meanwhile, due to the isentropic line equation
 for product, thus e = Pv/(γ − 1), −dP/dv = γP/v and Eq. (26) should be rewritten as:$$ \frac{1}{\gamma -1}\left({P}_{\textrm{H}}{v}_{\textrm{H}}-{P}_0{v}_0\right)=\frac{1}{2}\left({P}_{\textrm{H}}+{P}_0\right)\left({v}_0-{v}_{\textrm{H}}\right)+Q $$(34)
When PH ≫ P0, eH ≫ e0, from the above relational expression, it may be obtained that:
$$ D=\sqrt{2\left({\gamma}^2-1\right)Q} $$(35)$$ {P}_{\textrm{H}}=2\left(\gamma -1\right){\rho}_0Q=\frac{\rho_0}{\gamma +1}{D}^2 $$(36)$$ {\rho}_{\textrm{H}}=\frac{\gamma +1}{\gamma }{\rho}_0 $$(37)$$ {T}_{\textrm{H}}=\frac{2\gamma }{\gamma +1}\frac{Q}{C_{\textrm{v}}} $$(38)$$ {u}_{\textrm{H}}=\sqrt{\frac{2\left(\gamma -1\right)}{\gamma +1}Q}=\frac{D}{\gamma +1} $$(39)Insert the state equation \( {T}_{\textrm{H}}=\frac{P_{\textrm{H}}{v}_{\textrm{H}}}{P_0{v}_0}{T}_0=\frac{P_{\textrm{H}}{v}_{\textrm{H}}}{C_{\textrm{v}}\left(\gamma -1\right)} \) into the above equation to obtain:
$$ D=\frac{\gamma +1}{\gamma}\sqrt{\gamma nR{T}_{\textrm{H}}}=\frac{\gamma +1}{\gamma }{c}_{\textrm{H}} $$(40)It can be seen that the velocity of detonation is (γ + 1)/γ times the sonic velocity cH of compressed detonation product. γ is the polytropic index, and it is associated with the pressure of expansion when the detonation product is in a high-pressure state. For most explosives, γ is 1.3–3 (Fig. 12).
The PH here is the pressure right after the detonation transition zone. Due to the expansion and exothermic effect of the reaction products downstream of the detonation wave, the pressure is already reduced by half compared with the pressure at the shock wave front ahead. C-J condition parameters are only associated with equations for initial state of unreacted explosive and fully reacted products. For most condensed explosives, the C-J point is approximately γ ≈ 3.
Taylor devised a flat, one-dimensional explanation for the flow field of products behind a C-J detonation wave, and this is called the Taylor wave. The flow field upstream of a C-J detonation wave is simplified into simple wave flow, comprised of the C-J detonation wave front ①, central rarefaction wave (fan-shaped zone) ②, constant area ③ (Fig. 13). The central rarefaction wave is comprised of a system of characteristic line that intersect at the point of origin. The equation for characteristic line is:
$$ \frac{\textrm{d}x}{\textrm{d}t}=\frac{x}{t}=u+c $$(41)Solution for the Taylor wave in a flat, one-dimensional detonation product flow field:
$$ u=\frac{2}{\gamma +1}\frac{x}{t}-\frac{D_{\textrm{CJ}}}{\gamma +1} $$(42)$$ c=\frac{\gamma -1}{\gamma +1}\frac{x}{t}+\frac{D_{\textrm{CJ}}}{\gamma +1} $$(43)The pressure, density, and other physical quantities of product may be obtained through sonic velocity c.
-
(a)
-
2.
Detonation wave’s steady structure — ZND model. Following advancements in empirical experimentation techniques, people discovered that there exists rather glaring differences in data analyzed and calculated in the aforesaid C-J theory versus data obtained in experiment, to the point that some experiment phenomenon could not be explained. For example, the C-J theory could neither explain the process of weak detonation, nor describe detonation in relatively wider chemical reaction zone. Therefore, it was necessary to carry out studies about the internal structure of detonation wave, and take into full account the energy release process of a detonation wave’s chemical reaction. Upon the basis of the C-J theory, Zeldovich, von Neumann, and Döring added considerations on limited reaction time. They argued that detonation wave is comprised of the shock wave ahead (shock wave front is still assumed to be strong discontinuity) and a continuous and irreversible chemical reaction zone that progresses at a limited speed. This is the ZND model (Fig. 14).
Compared with the C-J theory, the ZND model introduces reactivity λ, a thermodynamics quantity that expresses the reaction process. λ = 0 represents unreacted explosive; λ = 1 represents fully reacted explosive, and Q denotes heat of reaction released; incompletely reacted state is 0 < λ < 1, and the heat of reaction released is λQ.
Energy equation should be rewritten as:
$$ {e}_{\textrm{H}}-{e}_0=\frac{1}{2}\left({P}_{\textrm{H}}+{P}_0\right)\left({v}_0-{v}_{\textrm{H}}\right)+\lambda Q $$(44)If the polytropic gas state equation is used, then the above equation should be rewritten as:
$$ \frac{1}{\gamma -1}\left({P}_{\textrm{H}}{v}_{\textrm{H}}-{P}_0{v}_0\right)=\frac{1}{2}\left({P}_{\textrm{H}}+{P}_0\right)\left({v}_0-{v}_{\textrm{H}}\right)+\lambda Q $$(45)Unlike the C-J theory, the shock wave’s Hugoniot curve and detonation wave’s Hugoniot curve are not the only Hugoniot curves on the plane (P, v), but a family of Hugoniot curves associated with the functions of λ may be obtained (Fig. 15). Given a specific λ to draw the corresponding Hugoniot curve, any of 0 < λ < 1 is known as a frozen Hugoniot curve. λ = 0 corresponds to Hugoniot curve of a non-exothermic reaction, and it is actually the Hugoniot curve of the shock wave; λ = 1 corresponds to Hugoniot curve of a fully exothermic reaction, and this is called balanced Hugoniot wave or final state Hugoniot wave.
The C-J condition is also applicable to the ZND model. Steady detonation is the propagation process of a self-sustaining wave. When λ = 1, the point of final state of steady detonation is the C-J point, and a steady detonation propagates at a constant speed. Explosion is a special detonation phenomenon and is known as an unsteady detonation.
-
3.
Detonation product state equation. In accordance with the first law of thermodynamics, the equation of the state of a material includes the four thermodynamics parameters of pressure P, volume V, temperature T, and mass m, and a systematic state equation may be written as:
$$ \pi \left(P,V,T,m\right)=0 $$(46)When three parameters are known, the function of the fourth may be obtained, and therefore a broader expression should be:
$$ \pi \left(P,V,T\right)=0 $$(47)It is very difficult to provide a solution that solves a theoretical model, and most of the time an approximate solution is used.
Equation for an ideal gas state:
$$ PV= nRT $$(48)In this equation: P is the pressure of the gas, and V is the volume of the gas; n is the quantity of mass of gas; and R is the molar gas constant, which is 8.314 J/(mol · K).
For real gas in high-pressure state, gas molecules have the largest volume (Fig. 16). Modify the equation for ideal gas state, subtract molecule-occupied volume b in mixture volume from gas volume V, then obtain the equation for the state of real gas:
$$ P\left(V-b\right)= nRT $$(49)Another expression of the equation for real gas state:
$$ P=\frac{\rho nRT}{1- b\rho}-a{\rho}^2 $$(50)In the equation, a denotes parameter that controls the intermolecular attraction within the gas, while ρ represents density, and \( \rho =\frac{1}{v} \).
If ρ is expressed as a polynomial, then:
$$ P=\rho nRT\left(1+ bp+0.625{b}^2{\rho}^2+0.287{b}^3{\rho}^3+0.193{b}^4{\rho}^4+\cdots \right) $$(51)The virial equation for expressing the state of real gas:
$$ PV= RT\left(1+\frac{B_2}{V}+\frac{B_3}{V^2}+\frac{B_4}{V^3}+\cdots \right) $$(52)In the equation: Bi represents the coefficient in the i order.
-
(a)
JWL equation of state: The JWL or Jones–Wilkins–Lee equation of state is expressed as:
$$ P\left(E,v\right)=A\left(1-\frac{\omega }{R_1v}\right){\textrm{e}}^{-{R}_1v}+B\left(1-\frac{\omega }{R_2v}\right){\textrm{e}}^{-{R}_2v}+\frac{\omega E}{v} $$(53)In the equation, P is the pressure of product of detonation; v is relative specific volume, v = ρ0/ρH; ρ0 is the initial density of the explosive; ρH is the density of the detonation product; E is the internal energy in a unit volume; and A, B, R1, R2, and ω are undetermined parameters in the Jones–Wilkins–Lee equation of state. For C-J condition, Hugoniot condition, and isentropic condition, the JWL equation of state may be respectively written as:
$$ A{R}_1{\textrm{e}}^{-{R}_1{v}_{\textrm{CJ}}}+B{R}_2{\textrm{e}}^{-{R}_2{v}_{\textrm{CJ}}}+C\left(1+\omega \right){v}_{\textrm{CJ}}^{-\left(\omega +1\right)}={\rho}_0{D}_{\textrm{CJ}}^2 $$(54)$$ \frac{A}{R_1}{\textrm{e}}^{-{R}_1{v}_{\textrm{CJ}}}+\frac{B}{R_2}{\textrm{e}}^{-{R}_2{v}_{\textrm{CJ}}}+\frac{C}{\omega }{v}_{\textrm{CJ}}^{-\omega }={E}_0+\frac{1}{2}{P}_{\textrm{CJ}}\left(1-{v}_{\textrm{CJ}}\right) $$(55)$$ A{\textrm{e}}^{-{R}_1{v}_{\textrm{CJ}}}+B{\textrm{e}}^{-{R}_2{v}_{\textrm{CJ}}}+C{v}_{\textrm{CJ}}^{-\left(\omega +1\right)}={P}_{\textrm{CJ}} $$(56)Plus undetermined parameter C, although there are six undetermined parameters, only three are independent. The usual method is to give a specific group of values for R1, R2 and ω, then use the equation below to find the corresponding A, B and C. Then insert this group of A, B, R1, R2, ω and C parameters into fluid dynamic program for calculations in cylinder experiment or hemispherical shell experiment. If the calculated cylindrical wall velocity and steady-state flight time coincide with cylinder experiment and hemispherical shell experiment, then this group of parameters may be confirmed. Otherwise, it would be necessary to calculate with a new group of parameters until the required precision is satisfied. For the majority of explosives, R1 = 4–5, R2 = 1–2 and ω = 0.2–0.4.
The JWL equation of state is applicable to C-J isentropic line that describes detonation product when it expands from the C-J point to the 10−1 GPa range of pressure, but is not applicable to describe states that diverge from the C-J isentropic line.
-
(b)
BKW equation of state: The BKW equation of state of detonation product uses an exponential polynomial format:
$$ P=\rho nRT\left[1+\rho z{\left(T+\theta \right)}^{-\alpha}\exp \beta \rho z{\left(T+\theta \right)}^{-\alpha}\right] $$(57)$$ z=k\sum {x}_i{k}_i $$(58)In the equation: P is pressure, ρ is the density of gas product, R is the molar gas constant, and T is temperature; xi is the molar value for the gaseous components in the i order; ki is the geometrical residual capacity for components in the i order; and α, β, k, and θ are parameters confirmed through empirical experience. Table 2 shows the benchmark results for BKW parameters for the explosives RDX and TNT as given by Mader.
-
(c)
VLW equation of state: The first form of the virial equation corresponds to ideal gas; the second form takes into consideration the mutual actions between two molecules; the third form takes into consideration the mutual actions between three molecules, and so forth. When the detonation product gas mixture exists in a high-pressure state, it is necessary to consider the simultaneous collision between multiple molecules. Actual solution to virial coefficient of a high order is enormously complicated. Based on the virial theory and similarity theory, Wu Xiong expresses virial coefficient of a high order as a second virial coefficient, subsequently obtaining VLW detonation product state equation:
$$ \frac{Pv}{RT}=1+{B}^{\ast}\left(\frac{b_0}{v}\right)+\frac{B^{\ast }}{T^{\ast \raisebox{1ex}{$1$}\!\left/ \!\raisebox{-1ex}{$4$}\right.}}\sum {\left(n-2\right)}^{-n}{\left(\frac{b_0}{v}\right)}^{\left(n-1\right)} $$(59)In the equation, the Lennard-Jones 6–12 pair potential is used to express the second virial coefficient B∗, as in \( {B}^{\ast }=\left[-\frac{2^{j+1/2}}{4j}\varGamma \left(\frac{j}{2}-\frac{1}{4}\right){T}^{\ast -\left(2j+1\right)/4}\right] \), and B∗ may also be used to modify the Buckingham potential (Exp-6 potential) expression; T∗ is dimensionless temperature, and \( {T}^{\ast }=\frac{k}{\varepsilon }T;{b}_0=\frac{2}{3}\pi N{\sigma}^3 \); N is the Avogadro constant; k is the Boltzmann constant; and ε and σ are Lennard-Jones potential parameters. The VLW equation of state uses the parameters of detonation product gas component’s potential in its description, and holds that virial coefficients at different orders are similar under high temperature, of which, virial coefficients at higher orders are obtained through second virial coefficient. This kind of simplification has a certain degree of impact on the precision of the description of the thermodynamics state of detonation product gas component under high temperature.
-
(a)
 for product, thus e = Pv/(γ − 1), −dP/dv = γP/v and Eq. (
C-J detonation model

Hugoniot curve of detonation wave. (A) Initiate state of unreacted explosive; (B) state of reaction product of explosion; (C) jump conditions of impact and compression that did not initiate explosive reaction; (D) Hugoniot state of product; and (E) Hugoniot state of product when pressure decreases and volume increases

Hugoniot curve branches of detonation wave

C-J conditions of detonation wave propagation

Different values of gas expansion γ under high pressure

Flow fields behind the CJ detonation wave

ZND model of detonation wave

Frozen Hugoniot curves

Volume occupied by molecules in real gas under two pressure states. (a) Low pressure; (b) High pressure
2.3 Sensitivity of Explosives to External Effects
In previous section about knowledge on explosives, it was mentioned that primary explosives may be detonated with either pin (impact) or spark (flame), while condensed explosives require the shock wave from primary explosive explosion or high-speed impact of a metallic object to detonate. The sensitivity of an explosive reflects the lowest initiation energy required for set explosive to combust and detonate under certain conditions. It should be noted that reaction is very complicated, and even if charge conditions are given for the same type of explosives, the lowest initiation energy is not an invariant. In order words, sensitivity is not absolute, and other than the chemical and physical properties of the explosive, other influential factors include the type of the initial stimuli and how the energy of a given load is distributed in the explosive. Generally speaking, it is believed that a successful reaction requires energy from external stimuli to be concentrated on the explosive within an extremely short span. In contrast, if external energy is distributed evenly across the explosive, then a reaction would be difficult. An explosive’s sensitivity to external stimuli can be divided into three categories: heat sensitivity, mechanical sensitivity, and shock sensitivity.
2.3.1 Heat Sensitivity
If the heat released from a reaction is larger than heat loss, the accumulation of heat would induce a rise in temperature, and in turn speeding up the reaction and causing an explosion. The heat required for heat reaction might come from two sources: One is the use of flame, spark, or other heat to provide localized heat to an explosive, and this local heat pulse initiates local reaction of the explosive, which should have a self-sustaining reactive property to allow the reaction heat to spread to other parts of the explosive. The second source is the heating of the whole explosive (without clear flame), and at critical temperature the explosive would decompose in accordance with the rule of thermal explosion. When the heat balance is broken, as in the heat generated by the explosive is more than the heat loss in the environment, the explosive would explode.
Classic thermal initiation theory holds that the relationship between the heat release process of chemical reaction and the heat transfer process to surrounding medium (heat dissipation) determines whether or not a thermal initiation of the explosive could be achieved under the effect of heat, and the properties in the span between exothermic chemical explosion to the explosive reaction. System of equation for describing heat conduction in the heat process and chemical kinetics:
In the equation, cP, ρ, and λ respectively denote the constant-pressure specific heat, density, and coefficient of heat conduction of the energetic material; T is temperature; Q is heat of decomposition per unit volume; Λ represents the percentage of already reacted energetic material; \( \frac{\partial \varLambda }{\partial t} \) is rate of chemical reaction; k0 is constant; R is the molar gas constant; E denotes activation energy; λ∇2T equation expresses the heat inflow or outflow due to heat conduction, and \( Q\frac{\partial \varLambda }{\partial t} \) shows chemical reaction energy released from unit volume of energetic material within unit time; φ(Λ) represents rule of reaction in isothermal condition, and when φ(Λ) = 1, Eq. (60) changes to the Arrhenius equation of rate:
Any explosive has its own lowest explosion temperature, and when that explosive reaches that temperature, it doesn’t react right away, but there’s a delay before its explosion in what is called the explosion delay. The heat sensitivity of an explosive may be determined by using Wood’s metal bath experiment to measure the explosion delay time τ, Wood’s metal bath experiment thermodynamics temperature T, and use the Arrhenius equation to calculate activation energy E:
In the equation, R is the universal gas constant and A symbolizes the frequency factor that depends on the explosive; take the log of both sides of the above equation, and the above equation changes to:
When ln τ and (1/T) are on a plane, the result is almost a straight line, and then calculate E/R to obtain activation energy E.
Another qualitative index associated with heat sensitivity is flash point, which is the temperature required for the explosive to explode during a 5 s or 10 s delay period.
2.3.2 Mechanical Sensitivity
The mechanical sensitivity here refers to dynamic actions other than shock wave effects. Mechanical actions include impact sensitivity, friction sensitivity, and others. Understanding mechanical sensitivity is vital to both the safe production and usage of explosive, and reliable and desired detonation.
-
1.
Impact sensitivity. All instrument (equipment) that measures impact sensitivity work under pretty much the same principle, which is the drop hammer test. The dropped steel hammers respectively weigh 10 kg, 5 kg, 2 kg, and 0.6 kg. Main methods for expressing the mechanical sensitivity of explosives are:
-
(a)
Explosion percentage expression method: Change drop-height while hammer weight remains unchanged. Carry out ten attempts at each height and calculate the percentage of explosion initiated. The relationship between the different drop-heights of same weight and explosion percentage is expressed through an impact sensitivity curve.
-
(b)
Drop-height expression method: For a drop-height with 50% chance of explosion is recorded as H50; the lowest drop-height at which explosion initiation is 100% is marked as H100; and the highest drop-height at which explosion initiation is 0% (meaning that no explosion could be induced) is denoted as H0.
-
(c)
Impact energy expression method: Usually expressed as the energy for an impact with 50% chance of explosion:
$$ {E}_{\textrm{I}}={M}_{\textrm{d}} Hg $$(65)In the formula, EI is the impact energy; Md is mass of the dropped hammer; H is height; and g is gravitational acceleration.
-
(d)
Relative impact sensitivity expression method: Usually TNT is used as the reference explosive, and the impact sensitivity of the tested explosive is compared against TNT:
$$ {O}_{\textrm{R}}=\frac{E_{\textrm{IX}}}{E_{\textrm{ITNT}}}\times 100 $$(66)In the formula, OR is relative impact sensitivity; EIX is impact energy imparted on the tested explosive; and EITNT is impact energy of TNT.
The impact sensitivity tests stipulated in Explosive Test Method GJB772A-97 include the drop hammer test, Susan test, and slide test.
At present, the majority of studies opine that impact induces explosion through one of the four mechanisms below to convert mechanical energy into heat, creating localized hot spot in explosive for initiation: (1) Hot spot generated in local shear band created by impact initiates explosion; (2) hot spot generated in adiabatic compressed gas space; (3) hot spot generated from friction when the impacted service enters the explosive’s interior and rub against explosive crystals and/or impurity particles; and (4) hot spot generated in the viscosity between the impacted surface and particles when the surface of the explosive quickly protrudes after impact.
The general consensus is that the temperature, size, and sustained duration of the hot spot that causes ignition or detonation usually are characterized by: (1) temperature no less than 700 K; (2) hot spot diameter 0.1–10 μ0; and (3) sustained time 10−5 to 10−3 s.
During the production or utilization process, if the generated hot spot’s temperature was lower than 700 K, and the generated hot spot’s diameter was smaller than 0.1 μ0, while the sustained duration was less than 10−5 s, then ignition or detonation would not occur, and at most an unsustainable localized decomposition would take place.
-
(a)
-
2.
Friction sensitivity. During the production and utilization process of an explosive, it is common to see friction between particles within the explosive, or between the explosive and contact surface of other materials. This kind of friction could generate hot spot and ignite or detonate the explosive. Yet, whether or not a hot spot can ignite depends on the state of imbalance between the heat generated in chemical reaction and heat loss. As mentioned above, this kind of imbalance state is contingent on the temperature, size, and sustained duration of the hot spot. If a material melts, friction would no longer produce heat. Since an explosive’s melting point is always lower than ignition temperature, therefore, pure friction between explosive and other materials is not enough to cause an ignition. The common consensus is that the friction between particles with high melting point included in a charge, or the friction between particles and substrate with high melting point, could most possibly result in ignition.
Main instruments and methods for testing friction sensitivity used in China and abroad include: pendulum friction test, BAM friction device, Bowden-Kozlov device, torpedo friction test, solid explosive friction test, and liquid explosive friction test. The instrument stipulated in Explosive Test Method GJB772A-97 is the Bowden-Kozlov device, and the measurement taken was friction sensitivity of powdered explosives. To measure the friction sensitivity of packaged explosives, the USA created a friction sensitivity experiment and measurement method using small pieces of samples in order to ascertain the friction sensitivity of insensitive explosives. China is also undertaking similar studies.
2.3.3 Shock Sensitivity
The effect of a shock wave can initiate an explosion reaction in the explosive. Using the lowest shock wave pressure required for complete detonation of explosive as measurement of shock sensitivity, the Explosive Test Method GJB772A-97 stipulates the use of the card gap method to measure shock sensitivity.
-
1.
Initiation of explosion in homogeneous explosives by shock wave. Homogeneous explosive refers to air explosive, homogeneous liquid explosive (without air bubble or solid impurities), and single-crystal explosive. After a shock wave enters the explosive and evenly compresses and heats the explosive molecules, chemical reaction would be initiated. When the incident wave has a relatively high pressure, the complete reaction time of the explosive is extremely short, and thermal detonation would occur near the incident surface where the shock wave enters, creating a strong detonation. The detonation wave propagates with a velocity higher than a steady-state detonation, and when the strong detonation catches up to the initial incident shock wave, the unreacted explosive would gradually turn into steady detonation. When the incident wave has a relatively low pressure, if the sustained duration is long enough, then the reaction process upstream of the shock wave front would take place at a low rate. Thermal detonation would occur somewhere between the shock wave’s incident surface and the shock wave front, usually toward the end of the charge.
Figure 17 is a time-space diagram of detonation wave velocity based on analysis of shock initiation of nitromethane. Line OA is nitromethane’s loaded interface track, and line OD is track of incident wave, with velocity that is pretty much constant; line OA is the trajectory of nonreactive gap surface, as in the trajectory of mass point of explosive behind the shock wave front; line AD is the trajectory of strong detonation wave; and line DB is the trajectory of steady-state detonation wave. As the incident shock wave propagates through the explosive, it pre-compresses and heats the explosive. After explosion delay, strong detonation takes place at point A, then propagates at a velocity higher than steady detonation within the pre-compressed nitromethane, catching up to and overtaking incident shock wave, subsequently evolving into a steady detonation.
In the explosive compressed by shock, the propagation velocity of the subsequent detonation is associated with the density of the compressed liquid and the increase in velocity at local mass points:
$$ D=6.30+3.2\left(\rho -{\rho}_0\right)+{u}_{\textrm{P}} $$(67)In the equation, ρ is density of compressed liquid; ρ0 is undisturbed initial density; and uP is mass point velocity, which corresponds to line OA in the diagram. This relational expression shows that for each 1 g/cm2 increase in density, there is a corresponding 1 g/cm2 increase in velocity. When the pressure of shock wave reaches 80 kPa, measured detonation velocity reaches 10 km/s. Pressure on ultra high-speed shock wave front could reach upward of 250 kPa, while pressure upstream of the shock wave front would drop rapidly because of the dispersal of detonation products, which is a conclusion that complies with the detonation product one-dimensional dispersion theory.
Reaction rate for homogeneous explosive described per the Arrhenius theory would be:
$$ r=\frac{\textrm{d}\lambda }{\left(1-\lambda \right)\textrm{d}t}=Z\exp \left(-\frac{E_0}{RT}\right) $$(68)In the equation, λ is mass fraction of the reaction product; Z is frequency factor; E0 is activation energy; T is reaction product temperature; and R is gas constant.
At present, shock ignition mechanisms related to single-crystal explosive include: dislocation ignition mechanism of hot spot generated from dislocation pile-ups and dislocation slide; ignition mechanism based on molecular entanglement structural transformation resulting from shear steric hindrance; and ignition mechanism of hot spot generated at crystal molecule adiabatic shear band.
-
2.
Initiation of explosion in heterogeneous explosives by shock wave. Bubbles, gaps, and impurities formed during an explosive’s casting, pressing, crystallization and other processes create discontinuous internal structure and uneven density in the explosive. In general, solid explosives used in real life are all heterogeneous explosives.
When a shock wave enters a heterogeneous explosive, the bubbles and gaps inside the explosive are compressed adiabatically, creating hot spots inside the compressed bubbles with temperature higher than the crystal. Under the action of shock wave, the explosion processes of homogeneous explosive and heterogeneous explosive differ vastly. Figure 18 is a time-space diagram of detonation wave velocity of heterogeneous explosive under shock wave action. Compared with Fig. 17, it can be seen that in homogeneous explosive, the incident shock wave’s propagation is basically a process with constant velocity, but in heterogeneous explosive, incident shock wave’s propagation is a process that accelerates; in homogeneous explosive, strong detonation is formed in a jump manner, but no strong detonation has been observed in heterogeneous explosive; in homogeneous explosive, detonation usually occurs near the interface between the shock wave gap and the explosive, in heterogeneous explosive meanwhile, detonation is usually believed to take place near the front of the shock wave. Moreover, research shows that relative to homogeneous explosive, heterogeneous explosives are more sensitive to shock wave due to the existence of bubbles, gaps, and impurities that could form hot spots. Meanwhile, compared with heterogeneous explosive, the shock wave initiation process of homogeneous explosives is more sensitive to initial temperature and changes in the shock wave’s pressure. In Fig. 18, point D represents steady detonation occurrence. The intersection point between the reverse extension line of detonation trajectory and time axis is Δt, known as excess propagation time. tD and xD are respectively time and distance to detonation.
-
3.
Shock detonation model. It is generally believed that the explosion initiation of heterogeneous explosive is caused by hot spots created by shock wave in the explosive, which in turn gradually develop into detonation wave. There are five possible mechanisms for the generation of hot spot as listed below: (1) Hot spot generated from adiabatically compressing bubbles or gaps in the explosive; (2) hot spots generated in localized shear bands; (3) hot spots generated from friction between impurity particles inside the explosive; (4) hot spots generated from dislocation and imperfection in crystal; and (5) hot spots generated from cavity elasto-viscoplastic collapse.
Models related to shock initiated detonations in explosives include: Forest-fire model, JFT model, HVRB model, Lee–Tarver model and Kim model, among others. Here, we will take a look at the more popular Lee–Tarver model.
The earliest Lee–Tarver model included two parts, namely ignition and growth. The reaction rate equation is:
$$ \frac{\textrm{d}F}{\textrm{d}t}=I{\left(1-F\right)}^b{\mu}^x+G{\left(1-F\right)}^b{F}^g{p}^z $$(69)In the equation, μ = ρ/ρ0 − 1, F is mass fraction of the reacted explosive; and I, b, x, G, g, and z are coefficients. This is a two-part reaction rate model, and the first part on the right is the ignition part, which is assumed to be proportional to some compression capacity. The value of index x is associated with the assumed method of hot spot generation. Some methods hold that ignition is related to the square of particle velocity up, other methods believe that ignition is related to the square of pressure P. Since very similar relationships exist between P and μ2, and between up and μ3/2, which is why the values of 3 or 4 is frequently used for x in most calculations. The second part on the right is pressure related to combustion rate of layered particles, and pressure index z usually falls within the 1–2 range. Factor Fg is associated with combustion surface, and for spherical hot spot that burns outwardly, index is 2/3. Proportionality coefficient G needs to be confirmed through experiments on layered particle combustion rate. Factor (1 − F)b was inserted in order to ensure that when the proportion of solid explosive neared zero, reaction rate equals zero. When given index b is 2/9 and when F is 3/4, (1 − F)bFg reaches its greatest value.
Results of explosives calculated from said model fit closely with many experiments’ data. These experiment data include data obtained from embedded manometer, particle counter, velocity interferometer system for any reflector (VISAR) and card gap test, as well as data of detonation failure. Yet, when simulating short-pulse duration ignition, the reaction growth coefficient G in the model needs to be adjusted with two to three pressure-related factors. In order to adjust the model to more accurately fit ignition processes with a wider range of input pressure, growth duration, and pulse duration, the model was modified and a three-part reaction rate model was built:
$$ \frac{\textrm{d}F}{\textrm{d}t}=I{\left(1-F\right)}^b{\left(\mu -a\right)}^x+{G}_1{\left(1-F\right)}^c{F}^d{p}^y+{G}_2{\left(1-F\right)}^e{F}^g{p}^z $$(70)In the equation, I, G1, G2, a, b, e, d, e, g, x, y, and z are 12 undetermined coefficients; compared with the original model, the growth part was further divided into two parts. The first part describes the relatively slow reaction process of particles similar to deflagration, and at this time hot spots exist independently, and pressure index may be set at 1, while the second part describes hot spots coming together, and the remaining unreacted explosives decompose rapidly, and at this time pressure index may be set at 2 or 3. Another modification is changing the outward void combustion model to the inward particle combustion model so as to better fit the experiment results. In order to better restrict the respective application scopes of the three parts on the right, three constants have been introduced: Figmax, FG1max, and FG2min. When F > Figmax, ignition is set at zero when F > FG1max, the first growth part is set at zero; and when F < FG2min, the second growth part is set at zero. Table 3 lists the Lee–Tarver model parameters for some explosives.
-
4.
Explosive detonation from fragments. In experiments where fragments were used to detonate explosives including LX-04, TNT, PBX9404, and Comp B, the following relational expression was obtained:
 ((71))
In the equation, P represents shock wave pressure; τ is the time that shock waves propagate back and forth in fragment; Ue is velocity of shock wave in explosive; and ρe denotes density of explosive.
If impacts from changes in Ue are taken into account, the above equation may be evolved into criteria for one-dimensional plane short-pulse ignition:
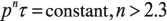 ((72))
If impacts from changes in Ue are ignored, criteria for heterogeneous explosive detonation from fragments is obtained:
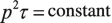 ((73))
Flat-face steel hammers with different diameters were used to deliver impact to PBX9404 explosive with diameter 25.4 mm, and the front of the explosives were covered with metal plates of varying thicknesses. Experiment results show that explosion initiation threshold velocity for explosive rises as diameter of projectile decreases or as covering plate thickness increases. In other words, thinner covering plate reduces the area of loading of explosive, or to put it differently, similar to using a projectile with smaller diameter to strike a cover-less explosive. However, at certain covering plate thickness the shock wave no longer acts like a flat plane, and it would be necessary to account for issues in detonation of shock wave with curved plane.
Criteria for velocity of projectile direct impact on explosive with cover plate:
$$ \frac{v_{\textrm{d}}}{2}=\left(1+k\right)\left[A+\frac{Bh}{d}\right] $$(74)In the equation, A is coefficient related to explosive and projectile material; B is coefficient related to cover plate material; k is coefficient related to projectile shape; h represents thickness of cover plate; and d refers to diameter of projectile.
Criteria for detonation threshold velocity obtained in experiments in which T/R (40/60) explosives covered with steel plate were detonated through impact from being struck with steel ball at different angles:
$$ \frac{v_{\textrm{d}}}{2}=\left(1+k\left(\theta \right)\right)\left[A+\frac{Bh}{d\cos \theta}\right] $$(75)$$ k\left(\theta \right)=0.5+0.2\left(\frac{1}{\cos \theta }-1\right) $$(76)In the equation, θ denotes the included angle between the trajectory of projectile and normal line of cover plate. In direct impact, when θ = 0 and k = 0.5, the above equation devolves to (74). For experiment results, please see Table 4.


Time-space diagram of detonation wave velocity of homogeneous explosive under shock wave action

Time-space diagram of detonation wave velocity of heterogeneous explosive under shock wave action
3 Propagation of Detonation
3.1 Propagation of Detonation in Condensed Explosive
The ZND fluid dynamics model for detonation assumes: The front of detonation wave is a flat plane, the flow in the reaction zone is one-dimensional, the terminal point of steady detonation is the C-J point, and detonation is a perfect detonation with no energy loss. Velocity of the detonation wave primarily depends on the energy released in the chemical reaction zone upstream of the shock wave ahead. However, in real life the velocity of detonation wave is also affected by shape of charge (cylindrical, flat, etc.), size (diameter, thickness, etc.), restricting conditions (shell, etc.), and other properties (density, structure, particle size, evenness, etc.) of the charge (condensed explosive).
Therefore, the detonation of a charge in real life is not perfect: The front of detonation wave is not a flat plane but curved, flow in the reaction zone is not one-dimensional, and the terminal point of steady detonation is not the C-J point. Studies on non-perfect detonation mostly look at situations with size limitations, for instance when the size of charge approaches infinitely big or when explosive is located in an ideal environment with rigid restrictions, detonation wave front may still be considered a flat plane, and flow in the reaction zone may still be treated as one-dimensional.
When detonation wave propagates in a cylindrical charge with a certain diameter, sideward rarefaction waves should cause certain explosive medium undergoing reaction to disperse outward from the chemical reaction zone, leading to loss of some energy that ought to support the front of detonation wave. When the charge diameter is large enough, the aforementioned energy loss would not have much of an influence, and detonation wave would basically propagate at an ideal detonation velocity. As the diameter of the explosive decreases, impact from energy loss increases, and when the diameter of the explosive shrinks pass a certain size (critical diameter), detonation velocity would drop significantly with any reduction in diameter. When charge diameter reaches the critical charge diameter, energy loss in the chemical reaction zone would prevent the self-sustaining propagation of detonation, resulting in unsuccessful detonation. The influence of charge diameter on detonation propagation is called the diameter effect (Fig. 19).

Relationship between detonation velocity and diameter
Sideward rarefaction wave in charge with limited diameter affects the reaction zone of detonation, causing detonation front to change from a flat plane to a curved plane. The timing of the end of chemical reaction inside the detonation front and the time for rarefaction wave to reach the central axis of the charge affect the curvature of the wave front. In other words, the diameter effect is related to the width of chemical reaction zone and diameter of charge (Fig. 20). Assuming that \( \frac{\partial u}{\partial t}=0 \) is the critical condition of constant propagation of a self-sustaining detonation, as in unsuccessful detonation would occur when velocity gradient of particles behind the shock wave front is zero, analyzing the flow field in the chemical reaction zone of the explosive behind the shock discontinuity would obtain the critical diameter’s expression:

Effect of detonation wave propagation diameter
In the equation, u is particle velocity upstream of the constant detonation wave front; c is the sonic velocity of impacted and compressed explosive, and is known as “frozen sound speed”; ϕc is sound velocity angle; QPv is heat of reaction under isobaric and isovolumetric conditions; Γ is the Grüneisen constant; and W is initial decomposition speed of explosive right after the shock wave discontinuity. Sonic velocity of impacted and compressed explosive c may be obtained from the equation below:
In the equation, λ is empirical constant.
The properties of the explosive, material of the shell containing the charge, initial temperature of the charge, particle size of the explosive, charge density, and other factors also affect critical diameter.
3.2 Propagation of Detonation in Gas Phase and Mixed Phase Explosives
Detonation propagation velocity and detonation pressure are associated with the composition of gas phase and mixed phase explosives. Each kind of gas phase and mixed phase explosive has a best composition ratio, and under such optimal ratio detonation propagation velocity and detonation pressure would reach their maximums.
There are upper and lower limits for the concentration of oxygen or combustibles in the gas phase mixture, and detonation cannot propagate steadily beyond the upper and lower limit concentration. Table 5 shows the concentration limit for several mixtures.
Unlike experimental results from normal gas phase mixtures (e.g., hydrogen, n-heptane), the nitromethane and oxygen gas mixture’s deflagration (or detonation) pressure P and speed u have multiple extreme values following increase in nitromethane concentration (Figs. 21 and 22). The predicted reason is perhaps that the energy that breaks the bond between the nitro group and the upper body is relatively high, and only when a certain energy level is achieved would steady and rapid detonation reaction be initiated.

Relationship between deflagration (or detonation) pressure P of the gaseous mixture of nitromethane and oxygen and the content of nitromethane φ

Relationship between deflagration (or detonation) velocity u of the gaseous mixture of nitromethane and oxygen and the content of nitromethane φ
4 Effects of Detonation
4.1 Drive and Loading of Detonation
4.1.1 Drive of Metal Cylinder by Internal Explosion Load
When an internal charge explodes, metal cylinder rapidly expands until breakage under the action of detonation product, creating a field where fragments disperse in all directions and in high speed. Thirty percent of the energy released from the explosion of an explosive is used to break apart the shell and drive the fragments. Taylor proposed the tensile fracture criterion in 1944, and he was of the opinion that cylindrical shell expands radially under the load from explosion of explosive contained inside. Initially, circumferential stress is in a state of compressive stress within the whole range of the thickness of the wall, and as the metal cylinder expands, inner wall pressure is reduced, and areas near the outer wall turn to a state of toroidal tensile stress. The inner wall areas meanwhile remain in a state of compressive stress, and inside the cylindrical shell exists a neutral surface with zero circumferential stress. Cracks emerge in the tensile stress areas on the outer surface of the cylindrical shell. It is assumed that radial cracks propagate only in the circumferential tensile stress area of the shell and can’t spread in areas with compressive stress. At first, the neutral surface is located on the exterior of the cylindrical shell, and thereafter, as the shell expands, the neutral surface moves inward, while cracks extend inward from the exterior of the cylindrical shell. When circumferential stress of the shell is fully stretched, neutral surface moves into the inner surface of the shell, or in other words cracks that propagate through the cylindrical shell (Fig. 23).

Tensile stress zone and compressive stress zone in expansion loop
R.W. Gurney derived a calculation formula for fragment initial velocity driven by shell charge explosion based on the energy conservation equation:
In the equation, Eg is Gurney energy, which is an assumption of kinetic energy of metal and expansion of detonation product directly converted from chemical energy inside the explosive charge prior to detonation, and reflects to a certain extent the capacity of explosive in driving objects; and me and mc are respectively the mass of the charge and mass of the shell.
Fragment velocity calculated from this equation is usually higher than initial fragment velocity actually measured, and this difference may be analyzed in a simplified manner using physical images of explosion-driven shell expansion and rupture: Blast wave that sweeps over the shell provides the shell with its initial acceleration, and for the cylindrical steel shell, when the shell’s radius expands to 1.2 times that of its initial radius, elastoplastic expansion would occur. At this time, the radial velocity of the shell reaches 60% of Gurney velocity. When fragments reach 1.6–1.8 times the shell’s initial radius, the fragments stop accelerating and reach their highest velocity, roughly 95–100% of Gurney velocity. And at this time, detonation product shoots out from cracks on the shell, and thereafter a continuously expanding cloud erupts from the ruptured shell. When fragments reach 20 times the warhead’s radius, the fragments also reach the last phase of their terminal flight, once again shooting out from the cloud of detonation product. However, due to the deceleration action of the resistance of the cloud, fragment velocity would be dragged down to 90% of Gurney velocity. Subsequent deceleration of fragment is attributed to continual resistance of medium in the environment. Therefore, Gurney velocity is the greatest velocity during the acceleration phase of fragments, and at this time, fragments of the expanded warhead shell reach a location about twice the initial radius of the warhead.
Gurney energy calculation method is usually associated with detonation parameters only, and does not take into consideration neither the effects of the expansion law of detonation product during the expansion process, nor the effects of the shell’s metal material on the expansion process. Based on the detonation product’s JWL equation of state and Taylor’s rupture criterion, Wang Xinying et al. proposed a Gurney energy calculation method that accounts for energy conversion of metal cylinder driven by detonation products, as derived from law of energy conservation with the introduction of parameters from the JWL equation of state and yield strength of metal material. Figure 24 shows curves of cylindrical experiment results and calculation results for pressed TNT cylindrical charge used respectively in oxygen-free copper, type 6061 aluminum and #45 steel.

Expansion velocity and relative volume curves of different material cylinders
With high enough detonation pressure, shear band is formed when inner wall of the cylinder is compressed by impact and shear stress is generated. The shear band extends toward the outer wall of the shell as the cylinder expands, and tensile stress causes cracks to form on the outer wall of the cylinder, with the cracks following the formed shear band and extending inward to the inner wall (Fig. 25). When the inner wall’s circumferential compressive stress and circumferential tensile stress are equal, and when the two sides of the shear band change from a state of compressive stress to a state of tensile stress, the cylinder would fracture and break. When detonation pressure is relatively low, there is no time for unsteady shear band to form on the inner wall of the cylinder, and Taylor’s tensile fracture criterion would be obeyed.

Shear failure of cylindrical shell
An increasing number of studies show that the destruction models of cylinder are tensile fracture, mixed tensile-shear fracture, or even purely shear fracture, but these depend on the detonation load pressure, size of cylinder, and expansion radius. Some materials show strain rate effect, and even plasticity peak during dynamic fracture.
When steel cylinder reaches a strain rate of around 104/s, fracture strains reach max value in what is known as the plasticity peak phenomenon (Fig. 26). Principle of fractures of cylindrical shell:

Plasticity peak in dynamic fracture
Assuming that flow stress satisfies the viscosity and flexibility relationships \( \overline{\sigma}=\overline{\sigma_0}+\eta \dot{\varepsilon} \), then steel cylinder fractures should satisfy:
In the equation, \( \mu =\frac{\eta }{{\overline{\sigma}}_0};\alpha =\frac{4 E\lambda}{3C{\overline{\sigma}}_0^2} \). When \( \varepsilon \ll 1 \), the above equation may be simplified as:
Fracture principle has existing strain ε and strain rate \( \dot{\varepsilon} \), and when \( \dot{\varepsilon}=\frac{1}{\mu } \), fracture strain is at maximum, as in \( \varepsilon =\frac{\alpha }{4\mu } \).
The Gurney equation calculates average initial velocity of detonation-driven fragments, but to calculate the distribution of initial velocity of fragments, a modified Gurney equation may be adopted:
In the equation, F(x) is correction factor; d denotes charge diameter; L symbolizes charge length; and x represents specific location along the axis of the warhead. Figure 27 shows initial fragment velocity distribution of American projectiles of four different calibers.

Initial fragment velocity distribution of projectiles of four different calibers
Fragment velocity distribution based on the principle of impulse distribution:
In the equation, i is explosion impulse; subscript α expresses relative position of observation; n is empirical correction factor; for the common form of detonation initiated from one end, explosion impulse is distributed along the length of the axis of the charge:
In the equation, i0 = (8/27)ρ0lD represents the impulse per unit area on the surface of end with the charge; ρ0 is initial density of charge; and D detonation velocity of charge. Relative position α of maximum impulse imax may be obtained based on \( \frac{\textrm{d}{i}_{\alpha }}{\textrm{d}\alpha }=0 \):
The said equation has no explicit solution, and approximate solution obtained from numerical method is α = 0.62927. Figure 28 illustrates distribution of explosive impulse along the axis.

Distribution of explosive impulse along the axis
4.1.2 Drive of Flat Plate by Detonation
-
1.
One-dimensional ejection of flat plate by detonation product. Assuming that flat plate is a rigid object, that detonation wave reflected from interface of flat plate is weak shock wave, and that adiabatic index of equation of state of detonation product is 3, then the relationship between motion distance and time of detonation-driven one-dimensional ejection process of flat plate is (Fig. 29):
$$ x= Dt\left(1+\frac{\theta -1}{\eta \theta}\right) $$(85)In the equation, x is distance of movement of flat plate; t denotes time; \( \eta =\frac{16m}{27M} \), of which, m is mass of charge, m = ρ0lS, ρ0 is density of charge, l is length of charge, and S represents cross-sectional area of flat plate; M is mass of flat plate; and \( \theta ={\left\{1+2\eta \left[1-2\eta \left(1-\frac{l}{Dt}\right)\right]\right\}}^{1/2} \). From \( u=\frac{\textrm{d}x}{\textrm{d}t} \), flat plate’s movement velocity u may be obtained:
$$ u=D\left(1+\frac{\theta -1}{\eta \theta}-\frac{l\theta}{Dt}\right) $$(86)Detonation-driven flat plate ejection velocity given by the Taylor model is:
$$ u=\sqrt{2{E}_{\textrm{g}}}{\left(\frac{\left(1+2\frac{m_{\textrm{p}}}{m_{\textrm{e}}}\right)+{1}^3}{6\left(1+\frac{m_{\textrm{p}}}{m_{\textrm{e}}}\right)}+\frac{m_{\textrm{p}}}{m_{\textrm{e}}}\right)}^{-1/2} $$(87)In the equation, mp is mass of flat plate; and me is mass of charge.
-
2.
Two-dimensional ejection of flat plate by detonation product. The one-dimensional ejection model can only analyze the movement velocity of flat plate, but if to understand the movement process and movement posture of ejected flat plate, then the flat plate can no longer be treated as a rigid object. Assuming that the flat plate is approximate to an incompressible fluid, that the thickness of the plate remains the same during its movement, that explosion product satisfies polytropic index equation
 , and that the flat plate is large enough that effects from rarefaction wave along the edges of the plate could be ignored (Fig. 30), then it may be derived that:$$ {V}_{\textrm{p}}=2D\sin \frac{1}{2}\left\{{\theta}_{\textrm{k}}\left[1-\exp \left[-\frac{m_{\textrm{e}}t}{\theta_{\textrm{k}}{t}_{\textrm{e}}D{m}_{\textrm{p}}\left(\gamma +1\right)}\right]\right]\right\} $$(88)$$ {V}_{{\textrm{p}}_{\textrm{max}}}=2D\sin \frac{1}{2}\left(\frac{1}{b+\overline{c}{m}_{\textrm{p}}/{m}_{\textrm{e}}}\right) $$(89)
In the equation: γ denotes polytropic isentropic index of detonation product; mp is mass of flat plate; and me is mass of charge; \( b=\frac{\sqrt{3}}{4}\frac{1}{\sqrt{1-\gamma \sqrt{\gamma^2-1}}} \); and \( \overline{c}=\frac{\sqrt{3}}{2}\sqrt{\frac{\gamma^2-1}{\gamma^2-\gamma \sqrt{\gamma^2-1}}} \).
Law of changes of deflection angle θ following changes in time t:
$$ \theta ={\theta}_{\textrm{k}}\left\{1-\exp \left[-\frac{m_{\textrm{p}} Dt}{\theta_{\textrm{k}}{t}_{\textrm{e}}{m}_{\textrm{e}}\left(\gamma +1\right)}\right]\right\} $$(90)Relationship between flat plate’s radial displacement x and deflection angle θ:
$$ x=\left(\gamma +1\right)\frac{\theta_{\textrm{k}}{t}_{\textrm{e}}{m}_{\textrm{p}}}{m_{\textrm{e}}}\int_0^{\theta}\frac{\cos \theta }{\theta_{\textrm{k}}-\theta}\textrm{d}\theta $$(91)
 , and that the flat plate is large enough that effects from rarefaction wave along the edges of the plate could be ignored (Fig.
One-dimensional ejection of flat plate by detonation product

Two-dimensional ejection of flat plate by detonation product
4.2 Explosion in Air
4.2.1 Formation of Blast Wave
After an explosive explodes in the air, explosion product rapidly expands, and when the blast wave propagates to the interface between the explosive and the air, the air would abruptly compress and create a strong shock wave. When the detonation product stops expanding, the air shock wave separates from detonation product and independently propagates forward. When the shock wave reaches a certain point, pressure would suddenly rise to overpressure peak value. At the same time, particle velocity and dynamic pressure, as well as other parameters of the medium, also jump because of the shock wave front and reach their peak values.
During the propagation process of a shock wave, the wave front propagates at supersonic velocity, while the tail of the positive pressure zone moves at a sonic velocity relative to static atmospheric pressure. Therefore, the positive pressure zone is continually being extended. What actually transpires is that after reaching peak value, overpressure would decline to zero at a rate approximate to exponential law, while dynamic pressure drops even faster. Expansion of air near the center of explosion causes the pressure here to continue to decline, so much so that pressure falls below static atmospheric pressure of wave front, thereby creating negative pressure. Particle velocity meanwhile changes from its original direction with shock wave movement to direction opposite of shock wave motion. Negative pressure gradually decreases to negative pressure peak value, and particle velocity running in the opposite direction also reaches near peak value, then gradually returns to zero, as in restoring the state of static atmospheric pressure. Dynamic pressure decreases even faster than overpressure, but at a specific location, the duration of action of dynamic pressure wind in the direction of propagation lasts longer than the positive pressure of overpressure (Fig. 31).

Changes in shock wave and dynamic pressure of air explosion over time
Shock wave propagates at supersonic velocity, and as the shock wave’s spherical front enlarges, energy is continually being depleted, and the velocity, pressure, and energy of the shock wave also attenuate very quickly as distance increases. The pressure, density, and other aspects upstream of the shock wave front gradually decline, and pressure and density a certain distance behind the shock wave decrease to the pressure and density of the pre-disturbance medium, may be even falling below the pressure and density levels of the pre-disturbance medium. At (10–15) r0 location away from the center of explosion, pulse propagation velocity nears the speed of sound (Fig. 32).

Pressure distribution of shock wave. Dotted line 1 represents the interface of product of explosion; dotted line 2 denotes interface between compressed zone and rarefaction zone; dotted line 3 is front of the shock wave; c0 symbolizes sonic velocity of undisturbed medium; and arrow is direction of particle movement upstream of the shock wave front
4.2.2 Similarity Theory in Explosion
When an explosive detonates in the air, due to the extremely short span of the detonation process, the influences of the medium’s viscosity and thermal effect on shock wave strength can be ignored, and the overpressure of the shock wave may be expressed as:
In the equation, E0 is energy of explosive; P0 denotes initial pressure of the air; ρ0 is density of the medium; κ represents adiabatic index; and R is distance from location of explosion.
Based on the π law, choose the respective unit of the mutually independent quantities of E0, P0, and ρ0 as basic units, and derive the following equation:
Expand the above equation in a polynomial manner:
Boundary conditions: R→ ∞, ΔP = 0, and A0 = 0.
In the equation, mR is TNT equivalent of the explosive. Given \( Z=\frac{R}{m^{1/3}} \), Z is called scaled distance. From the perspective of engineering, if a three-phase polynomial equation is obtained, then precision requirement is satisfied. Therefore, the above equation can be changed to:
In the equation, A1, A2, and A3 are coefficients confirmed through experiment. Shock wave peak value overpressure ΔP is only associated with scaled distance Z.
For spherical charge that explodes in infinite air medium, different researchers have put forth different suggestions with regard to the value of A1, A2, and A3 coefficients due to differences in test and analysis method. The following may be considered:
Similar to overpressure ΔP, a mid-air explosion blast wave’s positive pressure duration t+ and specific impulse i also satisfy similarity rate. Similarity theory of explosion is thus obtained. In other words, when explosives of the same type with similar geometrical shapes but different sizes explode under identical atmospheric conditions, they generate self-similar blast waves at equal scaled distance. According to similarity theory of explosion, outcomes of experiments conducted with small charges can predict the properties of blast waves generated from larger charges.
Finite reflex impulse measurements show that when Z < 0.16 m/kg1/3, similarity theory of explosion might become inapplicable.
The properties of blast waves from condensed, high-energy explosives are clearly similar to those generated by TNT, and the explosion parameters of other explosives may be calculated using explosives with explosion effects similar to spherical TNT. This is called TNT equivalent. In general, the equivalent factor is used in relative comparisons, and data are sourced from comparisons of air explosion data of different high-energy explosives. The changes in these data are not related to scaled distance, and do not rely on peak value overpressure or lateral impulse. When actually comparable explosion data do exist, averaging these data can confirm a specific TNT equivalent figure. When these data are unavailable, compare the values of heat of explosion Q of TNT and the target explosive to predict said explosive’s TNT equivalent. Table 6 lists TNT equivalent coefficients for the explosion of some explosives in infinite air medium, to be used for calculating overpressure and impulse. Pressure generated from movement of the air’s mass point itself, as in dynamic pressure of blast wave, is:
In the equation, ρ denotes air density, and u is blast wind (mass point) velocity. Figure 33 shows overpressure and dynamic pressure of 1 kg TNT explosion.

Overpressure and dynamic pressure of 1 kg TNT explosion
Experiments of impact of detonation parameters of RDX/Al and HMX/Al mixed explosives with different aluminum contents on overpressure of blast wave from air explosion show that the heat of explosion, detonation velocity, and volume of explosion gases have identical influences on air explosion blast wave overpressure. Overpressure is expressed as below:
In the equation, ∆Pm is shock wave overpressure of mixed explosive; Q, V, and D are respectively heat of explosion, volume of explosion gases, and detonation velocity of mixed explosive; QT, VT, and DT are respectively heat of explosion, volume of explosion gases, and detonation velocity of TNT; Z is scaled distance and denotes constants related to explosive type and detonation parameter calculation method, with a = 1 for TNT, a = 1.053 for RDX/Al, and a = 1.073 for HMX/Al.
4.2.3 Obstacle’s Reflection, Transmission, and Diffraction of Blast Wave
The blast wave air propagation circumstance given above does not include any obstacles, but when blast wave propagation in the air reaches obstacles, then reflection, transmission, and diffraction would occur just as any other waves would.
-
1.
Reflection of shock wave. Reflection of shock wave might be a positive reflection, oblique reflection, or Mach reflection.
The first type of reflection is positive reflection. When a shock wave vertically enters the plane of a rigid wall (normal direction of the incident wave front is perpendicular to the surface of the obstacle), the air mass point velocity at the surface of the wall would plunge to zero, air mass point would converge on the wall surface, causing rapid rise in pressure and density, and when these reach a certain extent, mass point would propagate in the opposite direction and create positive reflection (Fig. 34). Assuming that incident wave and reflection wave are constant, that parameter of air before disturbance is P0, ρ0, u0 = 0, that parameter of incident wave front is P1, ρ1, u1, and that incident wave velocity is D1, then incident wave overpressure is ΔP1 = P1 − P0; and assuming that parameter of reflection wave front is P2, ρ2, u2, that rigid wall’s boundary condition is u2 = 0, that reflection wave velocity is D2, and that its direction of propagation is opposite to incident wave, then reflection wave overpressure is ΔP2 = P2 − P1.
Overpressure of reflection shock wave:
$$ \varDelta {P}_2=2\varDelta {P}_1+\frac{6\varDelta {P}_1^2}{\varDelta {P}_1+7{P}_0} $$(100)For weak shock wave, since P1 − P0 ≪ P0, so \( \frac{\varDelta {P}_2}{\varDelta {P}_1}\approx 2 \); for strong shock wave, \( \frac{\varDelta {P}_2}{\varDelta {P}_1}\approx 8 \). In other words, under ideal conditions, when an air explosion’s blast wave encounters a rigid wall in its process of propagation, the generated reflection wave would have an overpressure two to eight times the overpressure of the incident wave. However, if influences of the high temperature and high pressure generated by strong shock wave are taken into account, air can no longer be treated as a perfect gas. Moreover, if dissociation, ionization, and other effects of the actual gas are also considered, \( \frac{\varDelta {P}_2}{\varDelta {P}_1} \) would be much larger, sometimes 20 times or even higher.
The second type of reflection is oblique reflection. When a shock wave does not vertically enter the plane of a solid wall and instead enters at an angle of incidence (included angle between normal direction of the incident wave and the surface of the reflecting solid wall), there exists a critical angle of incidence φcr. When φ1 < φcr, an oblique reflection of the shock wave would occur (Fig. 35).
In the diagram, φ1, φ2 represents angle of incidence and angle of reflection, and region (1) represents undisturbed region; (2) is region where incident wave has already propagated through, but not yet reached by reflection wave; and (3) denotes region where reflection wave has already propagated through. Overpressures of oblique reflection ΔP2 and incident wave ΔP1 are related to incident angle φ1:
$$ \varDelta {P}_2=\left(1-\cos {\varphi}_1\right)\varDelta {P}_1+\frac{6\varDelta {P}_1^2}{\varDelta {P}_1+7{P}_0}{\cos}^2{\varphi}_1 $$(101)Under normal circumstances, the value of reflection angle φ2 does not equal angle of incidence φ1.
The third type of reflection is Mach reflection. When oblique reflection φ1 > φcr, the solid wall first pushes the shock wave to a certain distance away from the wall, the incident wave and reflection wave combine to form the Mach wave in a phenomenon known as Mach reflection (Fig. 36). Wave combined on a vertical surface in front of a solid wall is called the Mach wave. The incident wave, reflection wave, and Mach wave’s point of intersection O1 is called triple point. The triple point is located at a certain distance from the wall surface, and slip line past the triple point is the boundary of area with the same pressure.
Figures 37 and 38 respectively show how the angle of incidence influence of reflected pressure peak value Prα and reflected impulse irα, of which, straight entry into the wall has an angle φ1 of 0° (as in normal direction), and propagation parallel to the wall has angle of 90°. A normal direction reflected blast wave usually has features that restrict the upper limit of explosion load on structure, and situations regarding oblique load should also be considered.
Blast wave generated a certain distance from the ground should have angle of incidence that changes from normal direction to one with a tilt. Figure 39 shows reflection of strong shock wave at a reflection surface. I1, I2, and I3 are expanding shock waves, and the contour lines of “R” respectively represent reflections of the various shock waves from plane. When I1 just came into contact with plane S, the strength of the reflection wave is twice that of the incident wave. As the shock wave continues to propagate outward, the respective intersections between each I and the corresponding R is shown as dotted line. Reflected shock wave and incident shock wave combine to form the Mach stem. As the shock wave expands, the Mach stem also continually elongates, ultimately surrounding the reflected shock wave and incident shock wave above.
Figure 40 also shows influence of reflection surface on shock wave, and illustrates shock wave waveforms at typical positions.
Critical angle of incidence φcr is not fixed because it is a function of the incident wave, or inversed proportional explosion height (Fig. 41).
When the explosion occurs on the ground or near the ground surface, calculation of blast wave parameters ought to account for the intensification effect from the ground reflection. A simple approximation calculation method is based on the hardness of the ground surface, namely multiplying the charge quantity in blast wave parameter equation by a factor of 1.8–2.
-
2.
Transmission of shock wave. If a shock wave encounters an obstacle that is not a solid wall but a medium with a certain degree of density during its propagation, the shock wave would transmit into said medium and create transmission wave. Based on the obstacle medium’s wave resistance, reflected shock wave or reflected rarefaction wave might be formed from the wall surface toward the original medium of propagation.
Under certain conditions, the transmission of air blast wave in a medium will create shock wave overpressure peak value in the cavity behind the surface of (inside) the target that could result in blast injury.
-
3.
Diffraction of shock wave. The reflections of shock wave mentioned previously assume that the obstacle is of infinite size. If during its propagation, a shock wave encounters an obstacle that is not of infinite size, other than creating reflected shock wave, the shock wave would also bend around the obstacle and create a diffracted shock wave (Fig. 42).
If a shock wave acts on a wide but not tall obstacle, a shock wave that enters the obstacle vertically would reflect upon hitting the front wall of the obstacle, causing the overpressure on the front wall to abruptly increase. However, when the incident wave does not encounter any more obstruction beyond the top edge of the front wall, overpressure would not increase, in turn creating overpressure difference, leading to generation of air flow and wave. While air flows from the high-pressure zone at the front wall toward the low-pressure zone outside the edge of the front wall, simultaneously air in the high-pressure zone is gradually attenuated from the edge area inward, creating rarefaction wave. Under the action of rarefaction wave, air at the surface of the wall moves upward, and the direction of this movement is changed because of air behind the incident wave at the top of the obstacle. This in turn creates moving vortex and circulation that propagates forward (Fig. 42a). When the circulation bends behind the diffracting obstacle and continues moving, it would collide with incident shock wave and result in higher pressure. Collision between diffracted shock wave and incident shock wave would create a new shock wave that continues to propagate. At this juncture, the circulation further develops, bends around the top of the obstacle and follows the back of the wall as it moves downward. Then, the back wall is put under increasing pressure, and due to the effect of the rarefaction wave at the front wall, pressure upstream of the reflection wave drops rapidly (Fig. 42b).
Circulation follows the back wall and continues to travel downward until reaching the ground. Thereafter, circulation follows the ground and moves forward, and forms Mach reflection behind the obstacle’s back wall at a distance roughly equal to two times that of the height of the obstacle (Fig. 42c).
On the other hand, if the shock wave acts on a high but not wide obstacle, circulation would occur at both sides of the obstacle. The two circulation flows that bend behind the obstacle would collide, and pressure in the area of collision would rise (Fig. 43). In the diagram, 1 is the shock wave, 2 is the vortex, 3 is the reflection shock wave, and 4 is the rarefaction wave.
For an obstacle that is neither high nor wide, diffraction would simultaneously occur at the top and two sides of the obstacle. An area where the three waves collide will build up very high pressure and appear at a certain distance behind the back wall of the obstacle.
In light of the above, diffraction(s) of shock wave would generate a high-pressure region at a certain distance behind the obstacle, and the damage of the shock wave within a certain area behind the obstacle might be even more powerful than if there was no obstacle. Therefore, when choosing obstacle to use as defense against shock wave, it is necessary to pay attention to the shape and size of obstacle, as well as the position of where personnel take shelter.
-
4.
Effects of external blast wave on architectural structures. When an explosive explodes on the ground a certain distance away from a structure, it would create a strong shock wave that propagates outward. The shock wave first arrives at the structure’s blast load face (the side of the structure facing the direction of the blast). From the previous section, it is known that the reflection of the ground would intensify the strength of the shock wave compared with an unobstructed blast in the air. The action of the shock wave’s load on the structure’s blast load face generates a pushing thrust on the wall surface and load-bearing structure. The shock wave would shatter glass, and the wall surface of the building might be damaged. A complex series of shock wave entry, reflection, and diffraction would occur inside the building, but the overall effect is that when the shock wave enters the interior, it would create upward pushing thrust on the floors and roof. Once the blast wave surrounds the whole building, the roof would have to bear downward pressure, while the four walls and load-bearing structure of the building have to handle inward pressure (Fig. 44). Generally speaking, blast wave would cause local failures of structural components, and this is acceptable as long as such local failures do not lead to the collapse of the entire building.
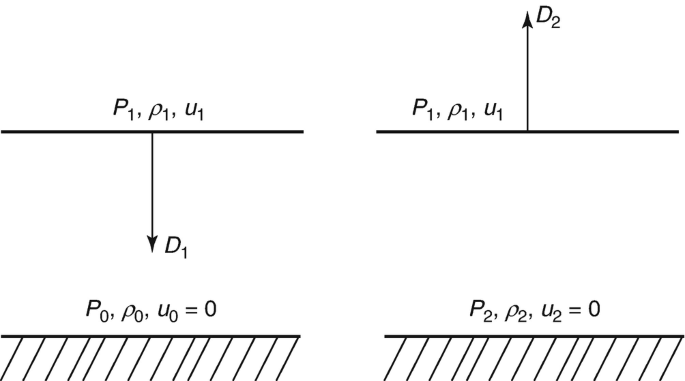
Normal reflection of shock wave

Oblique reflection of shock wave

Mach reflection of shock wave

Relationship between reflected pressure and incident angle

Relationship between proportional reflection impulse and incident angle

Effect of reflection front on strong shock wave

Reflection on ground of shock wave of air explosion

Relationship curve between the critical incident angle and inversed proportional explosion height

(a–c) Diffraction effect of wide but not high obstacles on shock wave

Diffraction effect of high but not wide obstacles on shock wave

Effect of shock waves of ground explosion on buildings
4.3 Underwater Explosion
-
1.
Basic circumstances of underwater explosion. When a charge explodes underwater, high-temperature and high-pressure detonation product is generated. Detonation product quickly expands outward, compresses the water medium and creates water shock wave, which propagates into the surrounding water environment at an extremely rapid manner while losing energy. This part of energy is termed shock wave energy, and makes up about 53% of the energy of the explosion. The rapid expansion of the detonation product thrusts the surrounding water to flow radially, expanding outward in the form of gas bubble while consuming energy. This part of energy is called bubble energy, which accounts for roughly 47% of energy of the explosion. When the internal pressure of a bubble exceeds the static pressure of the surrounding water medium, the bubble would continue to expand, the pressure meanwhile continues to drop as the bubble expands, until the bubble’s internal pressure falls to the same as the static pressure of the water medium. The bubble ought to stop expanding, but due to the effect of inertia it remains in a state of expansion until reaching its largest radius. Since the internal pressure of the bubble is below that of the pressure balance of the surrounding water medium, under the action of the external pressure, the surrounding water turns to move internally. The bubble also turns from expanding outward to contract inward, and as the bubble continues to contract, internal pressure inside the bubble increases until the pressure inside the bubble elevates to the static pressure of the surrounding water medium. Similarly, due to the inertia of water flow, the bubble ought to stop contracting, but continues to shrink until reaching its smallest radius. At this juncture, the pressure inside the bubble would again be greater than the static pressure of the surrounding water medium, which is why the bubble would once again expand, then repeat the previous expansion-contraction process. This is referred to as bubble pulsation, and this repeated cycle will also create a continuous pressure wave. The bubble gradually rises to the surface during this pulsation process of repeated expansion and contraction, until finally popping out of the water surface. How many times a bubble undergo the pulsation process is highly correlated to the depth at which the underwater explosion occurred.
Energy consumption during the course of the first pulsation is greatest, as roughly 60% of the explosion’s energy is transferred to the main shock wave. During the second pulsation, about 25% explosion’s energy is transferred to the second shock wave, while that for the third pulsation is approximately 8%. When calculating energy of an underwater explosion of an explosive, usually only the sum of shock wave energy and bubble energy from the first pulsation are taken into consideration. Figure 45 shows the time domain curve of a certain pressure point P in an underwater explosion, and the time domain curve of gas bubble pulsation radius R, along with the expansion-contraction process of its corresponding bubble.
With regard only to the effects of underwater blast wave alone, vessels on the surface are not impacted by the direct action of underwater shock wave, but also surface and bottom reflected shock wave, or even tsunami from the seabed due to the explosion, and the tsunami would in turn act on the vessels on water surface in the form of tidal wave (Fig. 46).
-
2.
Overpressure of underwater explosion shock wave. The equation for overpressure of underwater explosion shock wave is:
$$ \varDelta P(t)=\varDelta {P}_{\textrm{m}}{\textrm{e}}^{\left(1-1/\theta \right)\left[1-\left(R/{c}_{Z0}\right)\right]}{\sigma}_0\left(t-\frac{R}{c_{Z0}}\right) $$(102)$$ \theta ={10}^{-4}\sqrt[3]{m_{\textrm{e}}}{Z}^{0.24} $$(103)$$ {\sigma}_0\left(t-R/{c}_{Z0}\right)=\Big\{{\displaystyle \begin{array}{c}1,\kern0.875em t>R/{c}_{Z0}\\ {}0,\kern0.875em t<R/{c}_{Z0}\end{array}} $$(104)In the equation, ΔPm is peak overpressure in MPa; θ is time constant confirmed through experiment, shown in s; cZ0 denotes sonic velocity and is approximate to velocity of the front of the shock wave, shown in m/s; me is the explosive’s TNT equivalent and shown in kg; R is distance, shown in m; and \( Z=R/\sqrt[3]{m_{\textrm{e}}} \).
When the charge is not located at a very great depth (static water pressure less than 1 MPa), the overpressure of shock wave front could be expressed as:
$$ \varDelta P(t)=\varDelta {P}_{\textrm{m}}\Big\{{\displaystyle \begin{array}{l}\exp \left(-t/\theta \right),\kern0.875em t<\theta \\ {}0.368\theta /t,\kern0.875em \theta <t<\left(5\sim 10\right)\theta \end{array}} $$(105)In the equation, ΔPm is the overpressure of shock wave, shown in MPa; and θ is an exponential decay constant, shown in s.
-
3.
Similarity theory of underwater explosion. Like air explosion, similarity theory also exists for underwater explosion. Similar to the format of expression for peak overpressure of shock wave in air explosion, the polynomial equation for underwater explosion shock wave may be written as:
$$ \varDelta P=\frac{355}{Z}+\frac{115}{Z^2}-\frac{2.44}{Z^3},\kern0.875em 0.05\le Z\le 10 $$(106)$$ \varDelta P=\frac{294}{Z}+\frac{1387}{Z^2}-\frac{17.83}{Z^3},\kern0.875em 10\le Z\le 50 $$(107)P. Cole provided an empirical equation for peak overpressure of underwater explosion shock wave:
$$ \varDelta P=K{\left(\frac{1}{Z}\right)}^{\alpha } $$(108)In the equation, K and α are both empirical coefficients for commonly used high-energy explosives, with K being around 50–60, while α is 1.13–1.14, and Z is scaled distance.
-
4.
Energy of underwater explosion. Energy released by underwater explosion of an explosive converts into bubble energy, shock wave energy, and heat loss energy during its course of propagation. The relative energy assessment method for explosion of an explosive as given by GJB 7692-2012 is:
Equation for calculating bubble energy Eb:
$$ {E}_{\textrm{b}}=\left(0.6842{P}_{\textrm{h}}^{5/2}{\rho}_{\textrm{w}}^{-3/2}{T}_{\textrm{b}}^3\right)/\left(m\times {10}^6\right) $$(109)In the equation:
Eb—bubble energy, shown in MJ/kg.
Ph—sum of static water pressure at the center of explosion and local atmospheric pressure during time of experiment, shown in Pa.
h—underwater depth of center of explosive, shown in m.
Tb—difference between time corresponding to peak dynamic pressure of first bubble pulsation and time of arrival of shock wave, known as bubble pulsation period and shown in s.
Equation for calculating shock wave energy Es:
$$ {E}_{\textrm{s}}=\frac{4\pi {R}^2}{\rho_{\textrm{w}}{C}_{\textrm{w}}m}\int_{t_{\textrm{a}}}^{\tau }{P}^2(t)\textrm{d}t $$(110)In the equation:
Es—shock wave energy a distance away from center of charge at location R, shown in MJ/kg.
ρw—density of water, and value for fresh water at normal temperature is usually 1.0 g/cm3.
Cw—sonic velocity of water, and value for fresh water at normal temperature is usually 1460 m/s.
m—mass of explosive being experimented (including explosive equivalent mass of primer), shown in kg.
Explosion energy E is equal to sum of initial shock wave energy Es0 and bubble energy Eb, calculated as per the equation below:
$$ E={E}_{\textrm{s}0}+{E}_{\textrm{b}}=\mu {E}_{\textrm{s}}+{E}_{\textrm{b}} $$(111)In the equation:
μ—correction factor of shock wave.

Shock waves and bubble pulsation of underwater explosion

Effect of underwater explosion shock waves on surface warships
4.4 Explosion in Rock and Soil
The rock and soil medium is a type of medium that varies greatly in properties, and one that is uneven and filled with a large number of gaps. Therefore, analysis of explosion in rock and soil is much more difficult than air or underwater explosion.
Effects of explosion in rock and soil also satisfy similarity theory of explosion and are mainly associated with mass of explosive and buried depth of charge. Through the use of dimensional analysis, the relationship between buried depth and cube root of mass of charge is obtained:
In the equation, Z represents scaled buried depth; d is charge’s buried depth; and mTNT represents TNT equivalent of charge.
Studies show that there is a critical scaled buried depth Zcr, and when Z ≥ Zcr, all energy of the explosion is absorbed by rock and soil. This type of explosion is usually called hidden explosion or enclosed explosion. The value of Zcr is related to the property of the rock and soil. Zcr is 2 m/kg1/3 for dry loess or sandy soil, while Zcr is 2.5 m/kg1/3 for more packed soil.
-
1.
Creation of cavity from enclosed explosion. During an enclosed explosion, the blast wave and high-pressure, high-temperature detonation product forcefully compress the surrounding rock and soil medium, creating a cavity roughly several hundred or even a thousand times the size of the volume of the charge. The result is called an explosion cavity. Water content and cavities in the rock and soil medium immediately adjacent to the explosion cavity are forcefully compressed, and particle structures in the earth body are completely destroyed, creating a powerful compression zone also known as destruction zone. Shock wave outside the destruction zone has diminished into a stress wave, and though it can no longer destroy particle structures in the earth body, it can still cause radial displacement of rock and soil medium to a certain extent, instigating the formation of radial cracks. At the same time, unloading wave created from the rapid drop in expansion pressure of detonation product in the surrounding rock and soil medium would generate relatively strong radial tensile stress in the rock and soil medium, forming tangential cracks in a fracture zone crisscrossed with cracks and fissures. Outside the fracture zone, the stress wave diminishes to a seismic wave that propagates at the speed of sound, and it could only stimulate vibration in the rock and soil medium, but not enough to cause any structural destruction in said medium. Due to the relatively far distance of the seismic wave, this “vibration zone” is relatively large in area.
Radius of the explosion cavity may be obtained through quasi-static theory analysis:
$$ R=0.794{P}_{\textrm{k}}^{0.139}{\rho}_{\textrm{w}}^{1/9}{D}^{2/9}{\left({p}_{\textrm{a}}+g\sum \limits_{i=1}^n{\rho}_i{h}_i\right)}^{-1/4}r $$(113)In the equation, R denotes radius of the explosion cavity, shown in m; Pk is expansion pressure of detonation product when it expands and reaches conjugate point k, shown in Pa; ρw represents charge density and is shown in kg/m3; D is detonation velocity of the explosive and is shown in m/s; Pa is atmospheric pressure and shown in Pa; ρi symbolizes natural density of the i layer of earth body, and is shown in kg/m3; hi is the thickness of the i layer of earth body, and is shown in m; g is gravitational acceleration, shown in m/s2. Pk can be obtained via Hugoniot equation of the detonation wave, or more simply using the TNT explosive’s conversion ratio e:
$$ e=\frac{p_{\textrm{k}\textrm{TNT}}}{p_{\textrm{k}i}} $$(114)In the equation, PkTNT is pressure of TNT at conjugate point k, PkTNT = 2.8 × 10⁸ and shown in Pa, while Pki denotes pressure of the i type of explosive at conjugate point k, shown in Pa. For the e of industrial explosives, please see Table 7.
Similarity theory of explosion may also be used to obtain empirical equation for radius of explosion cavity:
$$ R=k{r}_0\kern0.875em \textrm{or}\kern0.875em R={k}^{\ast }{m}_{\textrm{TNT}}^{1/3} $$(115)In the equation, R denotes explosion cavity and is shown in m; r0 is radius of charge and is shown in m; mTNT represents TNT equivalent of charge and is shown in kg; and k and k∗ are respectively scale factors obtained during explosion of No.9 ammonium nitrate.
-
2.
Creation of crater from explosion. When Z < Zcr, the values of Z from big to small respectively create shallow buried explosion and ejection explosion. Since the interface between the rock and soil medium and the air medium is a free surface, when the radial compression wave generated by the explosion in the rock and soil medium reaches the free surface, it would turn into a reflected rarefaction wave. The destructive power generated from the overlapping of the compression wave and rarefaction wave creates a funnel-shaped fracture zone above the charge, and when coupled with the expansion action of the detonation product, the free surface of the rock and soil medium would break up or bulge and protrude. If no rock and soil medium is ejected, this would be called a shallow buried explosion. For soil that is relatively less resistance to shearing forces, the empty cavity created by a shallow buried explosion would likely create explosion craters as the result of the weight of the soil itself and the collapse of the wall of the cavity. If Z further reduces, the fractured rock medium would be ejected upward and to the sides by the detonation product, creating an explosion funnel termed ejection explosion (Fig. 47).
There are numerous empirical equations for predicting diameter of explosion crater, and if influences of the earth body’s density and strength parameters are taken into account, explosion crater diameter predictions are usually accurate with 10% deviation. Through dimensional analysis, an approximate opinion is that the scaled explosion crater diameter D/d is a function of W7/24/d, and the explosion crater diameter function relationship may be expressed as:
$$ \frac{D}{d}=F\left(\frac{(QW)^{7/24}}{\rho^{7/24}{G}^{1/8}{c}^{1/3}d}\right) $$(116)In the equation, D represents diameter of explosion crater; d is depth of charge buried; QW denotes energy of the explosive; ρ is earth body density; G is horizontal acceleration parameter; and c denotes velocity of propagation of seismic wave in said earth body.
Figures 48, 49, 50, and 51 depict numerical simulations of different explosion and destruction effect of explosives with same mass and size on multiple layers of medium (from top to bottom the layers are respectively concrete, rubble, rammed earth and natural soil) buried at different depths. The Euler calculation method is adopted for explosives and their products, and Lagrange calculation method is adopted for multi-layer board.
-
3.
Earthquake effects of explosion. When the blast wave of an explosive’s explosion propagates in the rock and soil medium, the energy of the shock wave near the point of explosion is immense, and the shock wave front has a steep head that propagates at supersonic velocity. During its propagation process, the shock wave loses a tremendous amount of energy and quickly diminishes into a stress wave. The front edge of the stress wave becomes less steep and propagates at sonic velocity, while energy loss is relatively low and diminishes at a slower rate. As the propagation distance increases, disruption energy gradually weakens, and stress wave diminishes to a periodic seismic wave and diminishes at an even slower rate. The seismic wave has low pressure, and its propagation energy only makes up 2–6% of the total energy of the explosion. The seismic wave causes periodic vibration in the medium, but does not destroy the internal structure of the medium. Waveforms at different stages of propagation (Fig. 52).
Due to the existence of gaps and holes in the earth body, the explosion product and shock wave propagation conditions in earth bodies differ vastly from propagation conditions in liquid medium. Attenuation law of shock wave with propagation distance is:
$$ P={\sigma}_r={P}_0{\left(\overline{r}\right)}^{-a} $$(117)In the equation: P0 denotes initial detonation pressure, \( \overline{r}=r/{r}_0 \), r is distance from center of explosion, r0 is diameter of blast hole, σr is radial peak pressure, and a represents attenuation coefficient.
After a shock wave diminishes into a stress wave, although it can no longer destroy the particle structure of the earth body, it can still cause radial displacement of rock and soil medium to a certain extent. The stress wave propagates at the sonic velocity of the medium, and this velocity has nothing to do with wave amplitude. Attenuation law of stress wave with propagation distance is:
$$ {\sigma}_r={\sigma}_0{\left(\overline{r}\right)}^b $$(118)In the equation: σ0 denotes initial peak pressure, and b represents stress attenuation coefficient, but it should be noted that this coefficient is different from the coefficient in the shock wave attenuation law.
Compared with natural seismic waves, a seismic wave created by an explosion has less energy, higher frequency, shorter wavelength, acceleration that is higher but also diminishes faster, and shorter vibration time. Blasting applications usually have to account for safety hazards on surrounding environment and structures caused by seismic waves of a blast explosion. Assessment of safe distance of blasting earthquake stipulated in China’s Safety Regulation for Blasting uses peak particle velocity. In general, the Sadovski empirical equation is used to calculate the peak velocity of particle vibration:
$$ {v}_{\textrm{s}}={k}_{\textrm{s}}{\left({Q}^{\frac{1}{3}}/R\right)}^{a_{\textrm{s}}} $$(119)In the equation, ks and as- are respectively blast earthquake attenuation coefficient and attenuation index, and are respectively associated with site of blast and properties of rocks; Q is charge quantity and is shown in kg; and R is distance from center of explosion, shown in m.
Calculation equation for vibration frequency of particle at ground surface caused by a blast’s seismic wave:
$$ f=k{\left({Q}^{1/3}/\log R\right)}^{1/2} $$(120)In the equation, k represents a coefficient, of which, k for coyote-hole blasting has a value of 0.8–5.0; k for bench blasting has a value of 5.0–50; and k for demolition blasting has a value of 1.0–100. When explosive quantity is big, use a smaller coefficient, and vice versa.
The most common opinion at present is that the vibration intensity and vibration frequency of a blast are the two main factors that affect safety of structures, therefore, the criteria for judging safety of blasting vibration should consider the joint effects of vibration velocity and frequency. Figure 53 shows safety standards for blasting vibration as stipulated by the USMB and OSMRE. The blasting vibration safety standards of Germany (BRD-DIN4150) divides structures into three categories, namely industrial building, residential building, and sensitive building (Fig. 54).

Diagram of formation of explosion crater. d is the distance from center of explosion to ground surface

Destruction of explosion at a depth of 0.35 m

Destruction of explosion at a depth of 0.75 m

Destruction of explosion at a depth of 1.25 m

Destruction of explosion at a depth of 2.00 m

Wave shape at different stages

USMB and OSMRE safety standards

DIN4150 blasting vibration safety standards
4.5 Thermal Effects of Explosion
4.5.1 Temperature of Detonation Product
The chemical reaction in explosive releases thermal energy, which sustains the steady propagation of detonation wave. The detonation reaction zone has extremely high temperature, reaching several thousand degrees. However, detonation also has an extremely short reaction duration (about 10−7 s) and the temperature drops very rapidly. The equation for the decay of detonation product temperature with time is expressed as:
In the equation, ln v = − ln (0.33616 + 59.70427 e−τ/0.5832) and 32.85152 ≤ τ ≤ 50.88161.
Figure 55 shows decay of detonation product temperature with time.

Attenuation of detonation product temperature with time
4.5.2 Temperature Increase Effect of Adiabatic Compressed Air Behind Blast Wave
After the explosion of an explosive, the surrounding air is abruptly impacted and compressed, and parameters for medium at the wave front change and jump. As entropy in medium elevates during the formation process of the shock wave, the extent of temperature increase with the rise in pressure far exceeds that of the isentropic process. For an ideal gas:
In the equation, the subscript “sw” represents parameters of the medium at the front of the shock wave; the subscript “is” represents parameters of gases in the isentropic process; and k0 and kH are isentropic indexes on the two sides of the shock wave front. For a strong shock wave, due to the dissociation and ionization processes in gases, the isentropic indexes on the two sides of the shock wave front are not equal. For a shock wave that is not too strong, k0 = kH = k and the above equation may be simplified as:
Table 8 lists related parameters upstream of an air shock wave.
From data in Table 8, it is abundantly clear that temperature of gases upstream of the front of a shock wave that propagates in gases rapidly rises. However, compared with the damages caused by the overpressure and specific impulse of a shock wave, the temperature increase duration of blast wave of condensed explosive is very short, and its scope of effect is limited. In addition, due to the relatively fast decay of temperature in the air, thermal effect might not be that obvious.
4.5.3 Thermal Radiation Effects of Fuel/Air Mixture Explosion
Unlike the explosion of condensed explosive that occurs at an approximate spot, the explosion of fuel/air mixture could take place within a large geometric space of fuel and air mixture, and could happen in different kinds of forms such as rapid flame propagation or stationary combustion. For gas explosion, on the one hand, the spread of high-temperature detonation product and temperature increase effect of adiabatic compressed air behind blast wave could generate high-temperature thermal effect within a large geometric space surrounding the blast field, and on the other hand, it would also create massive explosion fireball that emits radiant flux, or thermal radiation, consisting of ultraviolet waves (wavelength less than 0.38 μm), visible lights (wavelength between 0.38 and 0.78 μm) and infrared waves (wavelength longer than 0.78 μm).
-
1.
Shape and duration of fireball. At present, existing calculation models for shape and duration of fireball pretty much ignore the fireball’s dynamic formation process, and does not include energy loss in the atmosphere. In other words, the models assume that the greatest diameter, the height and surface heat flux of the fireball all occurred at an instant, and that they remain the same during the duration of the fireball’s existence. Almost all empirical equations derived from experiments consider fuel quantity M as a function of the fireball’s greatest diameter R, the fireball’s height H, and the fireball’s duration of existence t:
$$ R=A\times {M}^a $$(124)$$ t=B\times {M}^b $$(125)$$ H=C\times {M}^c $$(126)A, B, C, a, b, and c are coefficients related to the type of fuel.
Empirical equation derived from explosion of the Mars V rocket (fireball temperature around 3600 K):
$$ D=3.86{M}^{0.32} $$(127)$$ t=0.299{M}^{0.32} $$(128)In the equation, M is mass of propellant and is shown in kg; and t is the duration of existence of fireball, shown in s. This empirical equation is applicable to explosion of liquid propellant with fuel mass larger than 20 kg.
Empirical equation derived from explosion of liquid propellant with fuel mass less than 10 kg (fireball temperature around 3600 K) is:
$$ D=5.25{W}^{0.314} $$(129)$$ t=1.07{W}^{0.181} $$(130)Empirical equation derived from deflagration and detonation of diesel, kerosene, and gasoline within concentration range of 20–30 g/m3:
-
(a)
For deflagration of diesel and kerosene
$$ D=2\times \left(26\pm 1\right){M}^{0.33\pm 0.02} $$(131)$$ t=\left(4.63\pm 0.1\right){M}^{0.177\pm 0.012} $$(132) -
(b)
For deflagration of gasoline
$$ D=2\times \left(23.4\pm 0.5\right){M}^{0.34\pm 0.01} $$(133)$$ t=\left(4.77\pm 0.19\right){M}^{0.086\pm 0.015} $$(134)-
(c)
For detonation of diesel, kerosene, and gasoline
$$ D=2\times \left(34\pm 4\right){M}^{0.32\pm 0.04} $$(135)$$ t=\left(1.8\pm 0.3\right){M}^{0.33\pm 0.05} $$(136)
Fireball’s height H usually refers to the distance between the ground surface and the center of the fireball, and may be calculated using this empirical equation:
$$ H=6.48{M}^{0.35} $$(137) -
(a)
-
2.
Thermal radiation parameters. Generally speaking, thermal radiation parameters include heat flux density q and thermal dose Q. Heat flux density refers to heat that passes over a unit area within a unit time, and is measured in W/m2. Heat flux density is also known as thermal flux. Thermal dose may be understood as the cumulative heat flux density over a unit area within a certain period of time and is measured in J/m2. Heat flux density q chiefly hinges on type of fuel and combustion mechanism and is not directly related to quantity of fuel.
Heat flux density may be expressed as:
$$ q={c}_{\textrm{p}}(T)\rho (T) Tu $$(138)In the equation, cp(T) represents specific heat at constant pressure; ρ(T) is density of medium inside the fireball; T denotes temperature of the fireball; and u is heat flux propagation velocity.
Thermal dose may be expressed as:
$$ Q=\int_0^t{c}_{\textrm{p}}(T)\rho (T) Tu $$(139)Also ignoring the fireball’s dynamic formation process, and not including energy loss in the atmosphere, empirical equation for thermal radiation propagation is:
$$ \frac{q}{T^4}=\frac{G\frac{D^2}{R_2}}{F+\frac{D^2}{R_2}} $$(140)$$ \frac{Q}{(bG){M}^{\raisebox{1ex}{$1$}\!\left/ \!\raisebox{-1ex}{$3$}\right.}{T}^{\raisebox{1ex}{$2$}\!\left/ \!\raisebox{-1ex}{$3$}\right.}}=\frac{\frac{D^2}{R_2}}{F+\frac{D^2}{R_2}} $$(141)In the equation, q is heat flux density, shown in W/m2; T denotes fireball’s temperature, shown in K, and is given a value of 2200 K for unconfined vapor cloud explosion; D is diameter of fireball, shown in m; R is distance to center of fireball, shown in m; G represents a constant, of which Baker gave a value of G = 5.26 × 10⁻⁵, while some Chinese scholars opine that the value ought to be G = 0.958 × 10⁻⁷; F is a constant, F = 1617; Q denotes thermal dose, shown in J/m2; bG is a constant, bG = 2.04 × 10⁴; and M symbolizes mass of fuel consumed in the fireball, and is shown in kg.
Under the same experiment conditions as mentioned above, the fireball is deemed a gray body, and the gray body radiant relationship equation is obtained:
$$ q={q}_0\varepsilon ={q}_0\left[1-\exp \left(- kx\right)\right] $$(142)In the equation, q0 = σT4, T denotes blackbody’s temperature, σ is the Stefan–Boltzmann constant, ε is radiation coefficient (level of emissivity), x represents size of flame (optical thickness, and k is extinction coefficient.
Data from the thermal imagery are fitted using the above equation to obtain heat flux density’s empirical equation:
$$ q=\left(110\pm 10\right)\left[1-\exp \left(-2.6R\right)\right] $$(143)In the equation, the unit for q is kw/m2, and the unit for R is m.
Based on the equation above, calculation results for heat flux density q are: For deflagration of diesel and kerosene, q = 80–200; for deflagration of gasoline, q = 150–300; and for detonation of diesel, kerosene and gasoline, q = 200–350.
Total thermal radiation energy E may be empirically expressed as:
$$ E=F\times {M}^f $$(144)In the equation, the unit for E is J, and F and f are coefficients related to the type of fuel. From Eq. (145) it can be seen that as long as the fuel type and fuel quantity are confirmed, the total thermal radiation energy E listed for the three situations above won’t deviate significantly.
-
3.
Thermal radiation damage and injury criteria. Next, let’s look at three common criteria related to thermal radiation damage and injury:
-
(a)
The q criterion: The q criterion uses heat flux density to evaluate the damage and injury effect on target, as different heat flux density causes different damage and injury. Table 9 lists damage and injury threshold values on humans based on experiment experiences.
The q criterion is applicable in situations when time of effect of heat flux density is longer than the time it takes for target to reach thermal equilibrium.
-
(b)
The Q criterion: The Q criterion uses heat dose to evaluate the damage and injury effect on target, and can be applied to assess damage caused by heat dose in situations when time of effect of heat flux density is so short that radiated target doesn’t have enough time to lose heat (Table 10).
-
(c)
The q–Q criterion: The q–Q criterion takes into account damage and injury effects from both heat flux density and heat dose. Specifically, this method respectively plots heat flux density and heat dose as x and y coordinates, and then on this on the q–Q plane, the target’s critical damage status curve, known as critical damage curve, is graphed.
-
(a)
-
4.
Dynamic model for calculation of fireball thermal radiation consequence. The fireball’s actual course of development is a dynamic process, and so too is the course of effect of fireball thermal radiation. Dynamic model for calculation of fireball thermal radiation consequence may be expressed as:
$$ {I}_{\textrm{d}\textrm{ose}}(x)=\int_0^{t_{\textrm{d}}}\left(x,t\right)\textrm{d}t=\int \tau \left(x,t\right)F\left(x,t\right)E\left(x,t\right)\textrm{d}t $$(145)In the equation, τ is atmospheric transmittance rate, F denotes the target’s maximum geometric view, E represents radiation energy on the fireball’s surface, t is the duration of the fireball’s existence; and I is thermal radiation dose, shown in KJ/m2.
Bibliography
Орленко ЛП. Explosion physics. Translated by Sun Chengwei. Beijing: China Science Publishing &Media Ltd.; 2011.
Agrawal JP. Propellants, explosives and pyrotechnics. Translated by Ouyang Xiang. Beijing: National Defense Industry Press; 2013.
Japanese Society for Gunpowder Prohibition. Basic knowledge of gunpowder. Beijing: Qunzhong Publishing House; 1984.
Zhang G. Fundamentals of shock waves. Explos Shock Waves. 1983;3(2):90–6.
Zhang S. Explosion and shock dynamics. Beijing: Ordnance Industry Press; 1993.
Ning J, Wang C, Ma T. Explosion and shock dynamics. Beijing: National Defense Industry Press; 2010.
Дремин AH. Detonation waves in condensed matters. Translated by Shen Jinhua. Beijing: Atomic Energy Press; 1986.
Henrych J. The dynamics of explosion and its use. Translated by Xiong Jianguo. Beijing: Science Press; 1987.
Jonas AZ, William PW. Explosive effects and applications. New York: Springer; 1997.
Lee EL, Tarver CM. Phenomenological model of shock initiation in heterogeneous explosives. Phys Fluids. 1980;23(13):2362–72.
Wilfred EB. Explosions in air. Austin: University of Texas Press; 1973.
Long X, He B, Jiang X. On the VLW equation of state. Chin J High Press Phys. 2003;17(4):247–54.
Wu X, Long X, He B, et al. A review and perspective of the VLW equation of state. Chin J High Press Phys. 1999;13(1):55–8.
Han Y, Long X, Guo X. Prediction of methane PVT relations at high temperatures by a simplified virial equation of state. Acta Phys Sin. 2014;15:50–5.
Wang X, Wang S, Xu Y, et al. The energy conversion and fragment initial velocity model of metal cylinder driven by detonation. Acta Armamentarii. 2015;36(8):1417–22.
Baker WE, Cox PA, Westine PS, et al. Explosion hazards and evaluation. Amsterdam: Elsevier; 1983.
Hoggatt CR, Recht RF. Fracture behavior of tubular bombs. J Appl Phys. 1968;39(3):1856–62.
Fickett W, Davis WC. Detonation. Berkeley, CA: University of California Press; 1979.
Sun C, Wei Y, Zhou Z. Applied detonation physics. Beijing: National Defense Industry Press; 2000.
Dong H, Zhou F. Properties of high energetic explosives and relatives. Beijing: Science Press; 1989.
Johnson JN, Tang PK, Forest CA. Shock-wave initiation of heterogeneous reactive solids. J Appl Phys. 1985;57(9):4323–34.
Barker JA, Leonard PJ, Pompe A. Fifth virial coefficients. J Chem Phys. 1966;44(11):4206–11.
Hu D, Wang Y. Study on deflagration and detonation for gaseous mixture of nitromethane and oxygen. Chin J Energ Mater. 1994;2(2):13–8.
Meng T. A study of the explosion performance of FAM containing aluminum. 1994;1:64–9.
Deng C, Shen C, Fan X, et al. Test on the friction sensitivity of PBX tablet. Chin J Explos Propellants. 1912;35(5):22–4.
Niu Y, Feng X, Li Y, et al. Explosive detonation parameters and the relationship between the air explosive wave overpressure. Chin J Explos Propellants. 1913;36(4):42–5.
Wang W, Chen Y, Yang G, et al. Field tests and numerical simulations of blast-induced crater in wet sands. J Rock Mech Geotech Eng. 2016;35(1):68–75.
Tang C, Yu Y, Wang J. Elementary study of safety criterion for blasting vibration. Trans Nonferrous Metals Soc China. 2001;53(1):1–3.
Kan J, Liu J, Zeng X, et al. Characteristics of thermobaric explosive blasting fireballs. Chin J Explos Propellants. 2007;30(2):55–8.
Yu D, Feng C, Zeng Q, et al. Failure criterion for thermal radiation and damage radius of pool fire. China Saf Sci J. 1996;6(2):5–10.
Li W. One-dimensional nonsteady flow and shock waves. Beijing: National Defense Industry Press; 2003.
Author information
Authors and Affiliations
Editor information
Editors and Affiliations
Rights and permissions
Copyright information
© 2023 The Author(s), under exclusive license to Springer Nature Singapore Pte Ltd.
About this chapter

Cite this chapter
Liu, T. (2023). Explosion Physics. In: Wang, Z., Jiang, J. (eds) Explosive Blast Injuries. Springer, Singapore. https://doi.org/10.1007/978-981-19-2856-7_2
Download citation
DOI: https://doi.org/10.1007/978-981-19-2856-7_2
Published:
Publisher Name: Springer, Singapore
Print ISBN: 978-981-19-2855-0
Online ISBN: 978-981-19-2856-7
eBook Packages: MedicineMedicine (R0)