
Abstract
Additive manufacturing (AM) was commonly used for rapid prototyping, to visualize, test and authenticate designs, and then the production begins. The ability to build complex parts layer by layer, minimizing cycle time of production is only possible with the help of Additive Manufacturing’s fused deposition modelling (FDM). Thickness of material-layers, orientation, width, angle of raster and the air gap have significant effect on mechanical properties and thus surface quality of parts. Optimization and selection of process parameters for FDM are very important in having enhanced mechanical properties for printed parts under wear. Taguchi’s signal to noise (S/N) ratio and Artificial Neural Network (ANN) are utilized in order to find a set of parameters having great results for their respective response characteristics. Impact of each parameter is found using analysis of variance (ANOVA). Material under consideration is Poly lactic acid (PLA). This study intends to analyze the wear characteristics of the PLA specimen by finding optimal process parameters of 3-dimensional (3D) printing with FDM process. Thickness of layer, angle orientation, printing speeds are the process variables considered for this study.
Access provided by Autonomous University of Puebla. Download conference paper PDF
Keywords
59.1 Introduction
AM construct parts layer by layer directly from data available from CAD software. In conventional manufacturing techniques, the material need to be removed to obtain required objects. AM creates 3D parts by applying material in layer-by-layer manner. This enables AM very flexible to print all kind of geometry with any level of complexity with lower time and cost of production [1]. Almost all AM techniques have similar working principle, i.e., layering a material in predefined track for creating a desired part. The process binds together the 2-dimensional layers of material to create a 3D object. AM is currently compatible for a wide range of materials from precious metals to low grade polymers [2, 3]. One of the widely used consumer focused 3D printing technologies is FDM which offers ease to set up and print in comparison to other AM technologies [4]. The most researched and used biodegradable as well as renewable polyester (aliphatic) is poly lactic acid or polylactide. It has proven potential in order to replace traditional petrochemical based polymers for application in industries or Biomaterial for medical purposes [5, 6].
59.1.1 Fused Deposition Modelling (FDM)
Stratasys Inc. was the developer of FDM process in USA in the 1990s. It was introduced as a rapid prototyping technique. FDM uses thermoplastics like acrylonitrile–butadiene–styrene (ABS) and PLA as its materials [7]. Material spools are installed in the machine from where material is then extracted using drive wheels into the liquefier section of machine in which the material melts and gets spread upon the bed with the help of a nozzle moving on a predefine track. The nozzle temperature has been found affecting the mechanical properties of the material significantly and therefore design of nozzle for FDM require serious considerations [8]. Depending on the requirement and geometry of parts to be printed more than one material can be used in FDM (see Fig. 59.1) [9].

Schematic diagram of FDM printer
FDM has the ability to produce parts made of thermoplastics having a complex geometry with high dimensional accuracy. FDM allows the manufacturer to freely control the characteristics of printed parts with the help of a wide range of changeable parameters called process parameters. Many research have been conducted on FDM printed parts to study their physical properties on changing the process parameters. Figure 59.2 can be referred to achieve better response characteristics on printed parts by controlling the significant process parameters.

Experimental process layout
59.1.2 Process Parameters
Process parameters are the variables which can be altered during any process so that to obtain significant change in the result. The FDM machine offers control over various machining process parameters which have significant impact on efficiency of production and characteristics of parts. Common process parameters are orientation of build, density infill, thickness of layer, printing speed, width and orientation of raster, air gap, temperature of extruder, pattern infill, shells number and heat treatment temperature. The details of some important process parameters are [10,11,12,13,14,15,16,17]:
-
1.
Layer Thickness is the height of layer poured by the tip of nozzle as seen in the Fig. 59.3. The nozzle diameter and material have significant effect on the amount of layer thickness.
Fig. 59.3 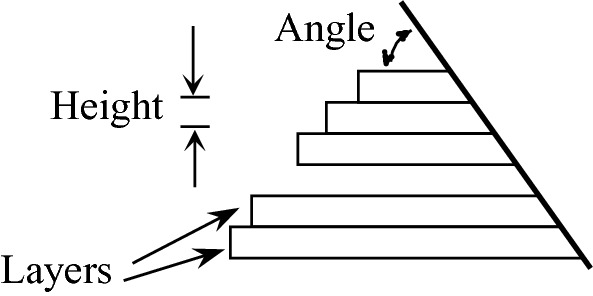
Layer thickness and orientation
-
2.
Raster Angle is the angle subtended between raster model with respect to X-axis on underside part layer. The usual raster angle varies from 0° to 90o (see Fig. 59.3).
-
3.
Raster Width is breadth of material bead used for raster. The higher value of raster width, the component will be built more vigorous interior. The nozzle tip diameter has the effect on amount of raster width.
-
4.
Orientation Build is the angle subtended by the part with the build platform with respect to x, y and z-axis.
-
5.
Air Gap is defined as gap between two contiguous raster tool conduits on the same layer.
-
6.
Contour Width is the width of contour tool part that encloses coils of the component.
-
7.
Contour to Contour air gap is the gap between contours when the packing style of components is set to various contours.

59.1.3 Various Responses Characteristics of Interest
This property is used to define the texture of the outer surface of the part. Surface roughness plays a very important role in processes like moistening and wetting. Rougher surface means it retains moisture on itself and in case of metals it means faster corrosion.
Whenever the thermoplastics settle on the bed and cools down, they show shrinkage in size. Also, since the FDM printed parts are printed layer wise so they don’t exactly have a curved surface instead they have a stair like structure. These factors lead to inaccuracies in dimensions of the part after printing.
-
3.
Tensile Strength [23]
The maximum load a material can support without yielding while being stretched. An important property which determines if the printed part can withstand the forces, it is being designed to handle.
Time required by the printer to print a single part is called the “Build time” of the part. Various researches have been made to decrease the time for build to increase amount of part production.
59.2 Research Findings on the Effects of FDM Process Parameters
In AM, values of parameters are always given higher interest by the researchers in the field in comparison to material properties of the part and this is in contrary to almost all of the processes of manufacturing. Identical parts from same material when printed under different sets of parameters have been seen to offer entirely different property. Every set of process parameters like thickness of layer, pattern infill and temperature of bed would generate a unique part structure and leads to varying values of mechanical properties [25]. Sood et al. conducted experiments with five parameters, namely thickness of layer, width of raster, angle of raster, air gap and orientation to analyze the changes in tensile, impact and flexural strengths of the specimen under test [21]. They observed shrinkage along the length of the part whereas increase in the thickness of the printed parts. Lanzotti et al. have performed tests to measure variations in ultimate tensile strength (UTS) and nominal strain on parts printed out of 3D printing process [26]. Gorski et al. performed flexural, impact and tensile tests on the specimens made of ABS having unique orientations [27].
Chacon et al. performed the analysis on bending strength and tensile strength of PLA part under different sets of orientation build, thickness of layer and rate of feed [28]. They observe increase in ductility with rise in thickness of layer and rate of feed. Apart from changing the process parameters the physical properties of printed part can be enhanced by improving the interface bonding of the adjacent layers by reheating the last layer so that it can bond well with next layer. Seth Collins P. used hot air flow to heat the layer [29], Ravi et al. employed lasers to heat layers [30] and Kishore et al. used infrared radiations to reheat the deposited layer [31].
In the year 2001, Anitha et al. analyzed effects of FDM parameters on surface roughness with ABS printed parts using Taguchi and ANOVA [18]. In the year 2004, Thrimurthulu et al. utilized a technique called genetic algorithm (GA) for the prediction of optimal orientation [19]. In year 2007, Wang et al. used statistics to study effect of process parameters like thickness of layer, deposition style, structures for support and orientation [20]. They concluded that orientation and thickness of layers play a crucial role for dimensional accuracy of printed parts.
In this research optimum parameters were different for different conditions so no optimum parameters were concluded in the research. So, in later work all the different responses were combined into one response to obtain optimum parameters. Nancharaiah et al. in their research resulted in thickness of layer and air density of infill were two process variables which affect the accuracy for dimensions the most [22]. Ahn et al. focused on tensile and compressive strengths of the printed parts in their research where it was concluded that optimum values of thickness of layer and orientation can lead to higher tensile and compressive strengths [23].
Thrimurthulu et al. in the year 2004 used a mathematical model for predicting and optimizing time for the build [19]. This model was also found successful in predicting the build time of the parts printed by other publishers in their respective researches. In the year 2011 in another research Nancharaiah et al. used Taguchi L9 technique to determine the relation between air gap, thickness of layer and time for build of parts. Thickness of layer affected time for build by around 66.57% and air gap around 30.77%. A thickness of layer of 0.330 mm and an air gap of 0.020 mm were found optimum in their research [24].
59.3 Wear Property
Surface property of the material to get worn out due to continuous exposure to other surfaces is called wear. Wear in a part gives the time for the part to get used in a particular environment. Wear can be caused through surroundings and touching parts. Long duration of exposure to wind and flowing water can also cause a part to wear off.
59.3.1 Recent Research Findings on Effect of FDM Process Parameters on Wear Property
In the year 2010 Srinivasan et al. conducted their research on effect of FDM process variables on wear strength of carbon-fibre infused PLA material. Parameters included thickness of layers, percentage infill and pattern in infill [32]. It is found that thickness of layer and infill percentages were the parameters which affected wear the most. Increased density of infill and minimal thickness of layers provided the best results. For similar values of thickness of layer and percentage of infill, parts printed with grid pattern as pattern of infill showed lesser wear in them.
In the year 2020, Mohamad Nordin et al. used response surface modelling (RSM) to optimize the parameters for ABS material. They conducted tests on three parameters; thickness of layer, pattern infill and temperature of nozzle. They found in their research that thinner layers result in less wear rate. Using ANOVA and RSM the optimum value for layer thickness was 0.10 mm with triangle pattern and 234 °C nozzle temperature. This research did not include the grid pattern [33]. Researchers in 2021 use Box Behnken-based design of experiment to conduct tests to achieve optimize input parameters for wear. RSM is used to set up a mathematical model between combinations of input parameters and obtained output. As a result of ANOVA, it was concluded that thickness of layer and the infill density were more significant in comparison to print speed [34].
Kumar et al. in 2021 studied the effect of sliding wear on the specimen made of PLA and ABS material. They found that wear rate reaches to a maximum for 90° build orientation [35].
There are certain tools and techniques, like Taguchi and ANN, known to optimize the constraints and provide the results which can help in saving time, money, material and can lead to better optimized results.
59.4 Taguchi Method
Taguchi method can be easily applied with the software MINITAB; this helps in generating plots and can obtain results under given optimized conditions. Table 59.1 shows the sequence of steps followed in Taguchi methodology:
59.4.1 Orthogonal Array
There are a lot of possible combination of factors and their levels. Taguchi helps in selecting the special arrangement of combinations of levels of key factors known as orthogonal array [36].
59.5 S/N ratio and ANOVA
S/N ratio is utilized to calculate robustness, signal indicates the controllable factors while the noise depicts the uncontrollable factors [37, 38]. There are various options available to select for plotting data points as per the need. For example, in wear testing “smaller is better” is used while for tensile strength “larger is better” can be used.
The analysis of variance (ANOVA) technique is utilized to find linear plot between input and output factors [37]. It also helps in determination of p-values and F-values that determine which factors are actually affecting the output, and which factor(s) have no effect on the output result. It also predicts the r-square values (0–100) which determine the closeness of the derived curve’s fitness with the obtained data. The response table also gives delta values and rank of dominance of factor.
There are certain limitations with Taguchi design [37] like
-
Difficulty in accounting interactions between various parameters.
-
Method is not appropriate for dynamically changing process.
Thus, ANN is used to obtain better validations.
ANN (Artificial-Neural-Network)
ANN is human simulation of neurological system. The diverse connection between these elements helps in better approximation of any non-linear functions and thus called universal function approximators [39]. The ANN model is trained between input and output parameters [40]. The neurons from one layer can interact with neurons from another layer; there interconnections are assigned with weights and biases [41]. In ANN 70% of data is used for training while rest of the data is being used for the purpose of testing [42]. The flow chart, given in Fig. 59.4 below, depicts the proposed working of the ANN system [37] using MATLAB tool. Different methods such as feed forward backdrop, feed forward delay, Hopfield, generalized regression, learning vector quantization (LVQ), etc. are available. The most commonly used is feed forward backdrop method [37], there are options in transfer functions as well namely PURELIN, TANSIG, LOGSIS.

The flow chart
59.6 Conclusions
It is observed that in certain conditions where dynamically changes take place, Taguchi method fails to give better predictions. For same data set ANN gives more appropriate results in comparison to Taguchi. In ANN more data is required for the purpose of training and validation and testing while in Taguchi predictions can be made with relatively lesser data. ANN is capable of predicting results for larger data set easily as compared to Taguchi. Taguchi method provides a variety of options as compared to ANN, like information regarding rank of factors, their effectiveness and ineffectiveness, tells which factor is more significant thus Taguchi method is informative, while for working on larger data set and better accuracy in result, ANN dominates Taguchi.
59.6.1 Future Aspects in the Research
-
Using more process parameters can give a more accurate answer for the optimum values for least wear rate.
-
Since the use of different infill patterns showed different results in above researches it can be inferred that using a wide range of levels within the parameter can also help to narrow down the optimum parameters.
-
Applying more than single optimizing techniques can help to determine which techniques have a better prediction rate for the wear rate. Results from different techniques and models can be compared to each other.
-
For same data results can be predicted and compared using different transfer functions to know at which transfer function the error is least.
-
Regression equation in Taguchi method can be obtained from ANOVA analysis and prediction, these equations are different and analysis can be done so as to compare which equation gives more accurate results.
References
Mohamed, O.A., Masood, S.H., Bhowmik, J.L.: Optimization of fused deposition modelling process parameters: a review of current research and future prospects. J. Adv. Manuf. 3, 42–53 (2015)
Mellor, S., Hao, L., Zhang, D.: Additive manufacturing: a framework for implementation. Int J Prod Econ. 14, 194–201 (2014)
Ngo, T.D., Kashani, A., Imbalzano, G., Nguyen, K.T.: Additive manufacturing (3D printing): a review of materials, methods, applications and challenges. Compos. B Eng. 143, 172–196 (2018)
Jackiewicz, J.: Manufacturing of instructional aids for students at low cost by means of 3D printing. Mater. Manuf. Process. 32, 1116–1130 (2017)
Savioli Lopes, M., Jardini, A.L. MacielFilho, R.: Procedia Eng. 42, 1402–1413 (2012)
Yadav, A., Srivastav, A., Singh, A., Mushtaque, M.D., Khan, S.A., Kumar, H., Arora, P.K.: Investigation on the materials used in additive manufacturing: a study. Mater. Today: Proc. 43, 154–157 (2021). https://doi.org/10.1016/j.matpr.2020.10.975
Kumar, H., Khan, S.A., Arora, P.K.:Retrospective investigation on emergence and development of additive manufacturing. Indian J. Eng. Mater. Sci. (IJEMS), 28(2), 115–124 (2021)
Kedare, P.K., Khan, S.A., Kumar, H.: 3D Printer nozzle design and Its parameters: a systematic review. In: Yadav S., Singh D., Arora P., Kumar H. (eds) Proceedings of International Conference in Mechanical and Energy Technology. Smart Innovation, Systems and Technologies, vol. 174. Springer, Singapore (2020). https://doi.org/10.1007/978-981-15-2647-3_73
Alafaghani, A., Qattawi, A., Alrawi, B., Guzman, A.: Experimental Optimization of Fused Deposition Modelling Processing Parameters: A Design-for-Manufacturing Approach. Procedia Manufacturing 10, 791–803 (2017). https://doi.org/10.1016/j.promfg.2017.07.079
PLA vs ABS Filament: Plastic Strength, Flexibility Compared! Which Is Better For 3D Printing? Available online: https://www.allthat3d.com/pla-vs-abs/ (accessed on 21 June 2019).
Panda, S.K., Padhee, S., Anoop Kumar, S., Mahapatra, S.S.: Optimization of fused deposition modelling (FDM) process parameters using bacterial foraging technique. Intell. Inf. Manag. 1, 89–97 (2009)
Akande, S.O.: Dimensional accuracy and surface finish optimization of fused deposition modelling parts using desirability function analysis. Int. J. Eng. Res. Technol 4, 196–202 (2015)
Gurrala, P.K., Regalla, S.P.: Multi-objective optimisation of strength and volumetric shrinkage of FDM parts: a multi-objective optimization scheme is used to optimize the strength and volumetric shrinkage of FDM parts considering different process parameters. Virtual Phys. Prototyp. 9, 127–138 (2014)
Rao, R.V., Rai, D.P.: Optimization of fused deposition modeling process using teaching-learning-based optimization algorithm. Eng. Sci. Technol. Int. J. 19, 587–603 (2016)
Mohamed, O.A., Masood, S.H., Bhowmik, J.L.: Optimization of fused deposition modeling process parameters: A review of current research and future prospects. Adv. Manuf. 3, 42–53 (2015)
Popescu, D., Zapciu, A., Amza, C., Baciu, F., Marinescu, R.: FDM process parameters influence over the mechanical properties of polymer specimens: A review. Polym. Test. 69, 157–166 (2018)
Raju, M., Gupta, M.K., Bhanot, N., Sharma, V.S.: A hybrid PSO–BFO evolutionary algorithm for optimization of fused deposition modelling process parameters. J. Intell. Manuf. 2018, 1–16
Anitha, R., Arunachalam, S., Radhakrishnan, P.: Critical parameters influencing the quality of prototypes in fused deposition modelling. J Mater Process Technol 118(1–3), 385–388 (2001)
Thrimurthulu, K., Pandey, P.M., Reddy, N.V.: Optimum part deposition orientation in fused deposition modeling. Int J Mach Tools Manuf 44(6), 585–594 (2004)
Wang, C.C., Lin, T.W., Hu, S.S.: Optimizing the rapid prototyping process by integrating the Taguchi method with the gray relational analysis. Rapid Prototyp J 13(5), 304–315 (2007)
Sood, A.K., Ohdar, R.K., Mahapatra, S.S.: Parametric appraisal of mechanical property of fused deposition modelling processed parts. Mater. Des. 31(1), 287–295 (2010)
Nancharaiah, T., Raju, D.R., Raju, V.R.: An experimental investigation on surface quality and dimensional accuracy of FDM components. Int J EmergTechnol 1(2), 106–111 (2010)
Ahn, S.H., Montero, M., Odell, D., et al.: Anisotropic material properties of fused deposition modeling ABS. Rapid Prototyp J 8(4), 248–257 (2002)
Nancharaiah, T.: Optimization of process parameters in FDM process using design of experiments. Int J EmergTechnol 2(1), 100–102 (2011)
Gorski, F., Kuczko, W., Wichniarek, R.: Influence of process parameters on dimensional accuracy of parts manufactured using fused deposition modelling technology. Adv. Sci. Technol. Res. J. 7(19), 27–35 (2013)
Lanzotti, A., Grasso, M., Staiano, G., Martorelli, M.: The impact of process parameters on mechanical properties of parts fabricated in PLA with an open-source 3-D printer. Rapid Prototyping Journal 21(5), 604–617 (2015)
Gorski, F., Wichniarek, R., Kuczko, W., Zawadzki, P., Bun, P.: Strength of ABS parts produced by fused deposition modelling technology – a critical orientation problem. Advances in Science and Technology Research Journal 9(26), 12–19 (2015)
Chacon, J.M., Caminero, M.A., Garcia-Plaza, E., Núñez, P.J.: Additive manufacturing of PLA structures using fused deposition modelling: effect of process parameters on mechanical properties and their optimal selection. Mater. Des. 124, 143–157 (2017)
Seth Collins, P.: Fused deposition modeling with localized pre-deposition heating using forced air. Montana State Univ 41(10):1975–1975 (1985)
Ravi, A.K., Deshpande, A., Hsu, K.H.: An in-process laser localized pre-deposition heating approach to inter-layer bond strengthening in extrusion based polymer additive manufacturing. J Manuf Process 24, 179–185 (2016)
Kishore V, Ajinjeru C, Nycz A, Post BK, Lindahl JM, Kunc V, Duty CE (2016) Infrared preheating to improve interlayer strength of big area additive manufacturing (BAAM) components. AdditManuf 14:321–324
Srinivasan, R., Aravindkumar, N., Aravind Krishna, S., Aadhishwaran, S., & George, J. (2020). Influence of fused deposition modelling process parameters on wear strength of carbon fibre PLA. Materials Today: Proceedings.doi:https://doi.org/10.1016/j.matpr.2020.03.738
Norani, M. N. M., Abdollah, M. F. B., Abdullah, M. I. H. C., Amiruddin, H., Ramli, F. R., Tamaldin, N.: 3D printing parameters of acrylonitrile butadiene styrene polymer for friction and wear analysis using response surface methodology. In: Proceedings of the Institution of Mechanical Engineers, Part J: Journal of Engineering Tribology (2020). 135065012092560. https://doi.org/10.1177/1350650120925601
Kumar, H., Sharma, A., Shrivastava, Y., Khan, S. A., & Arora, P. K. (2021). Optimization of process parameters of pin on disc wear set up for 3D printed specimens. Journal of Engineering Research, (EMSME Special Issue), pp.133–145. https://doi.org/10.36909/jer.emsme.13899
Kumar, A., Choudhary, A., Tiwari, A., James, C., Kumar, H., Kumar Arora, P., Akhtar Khan, S.: An investigation on wear characteristics of additive manufacturing materials. Materials Today: Proceedings 47, 3654–3660 (2021). https://doi.org/10.1016/j.matpr.2021.01.263
Srivastava, M., Rathee, S.: Optimization of FDM process parameters by Taguchi method for imparting customized properties to componentsVirtual and Physical Prototyping 13, 203–210 (2018)
Pant, M., Singari, R.M., Arora, P.K., Moona, G., Kumar, H.: Wear assessment of 3–D printed parts of PLA (polylactic acid) using Taguchi design and artificial neural network (ANN) technique. Mater. Res. Express 7, 115307 (2020). https://doi.org/10.1088/2053-1591/abc8bd
Darbar, R., Patel, D.M., Patel, J.: International Journal of Engineering, Process Parameters Optimization Of FDM Process And Application Of Taguchi Approach And ANN – The Review, Research and Applications (IJERA) ISSN: 2248-9622 www.ijera.com Vol. 3, Issue 1, January -February 2013, pp 743–746
Deshwal, S., et al.: Exercising hybrid statistical tools GA-RSM, GA-ANN and GA-ANFIS to optimize FDM process parameters for tensile strength improvement. NULL (2020). https://doi.org/10.1016/j.cirpj.2020.05.009
Yadav, D., Chhabra, D., Kumar Garg R., et al.: Optimization of FDM 3D printing process parameters for multi-material using artificial neural network, Mater. Today: Proc. https://doi.org/10.1016/j.matpr.2019.11.225
Weake, N., Pant, M., Sheoran, A., Haleem, A.: Optimising parameters of fused filament fabrication process to achieve optimum tensile strength Using artificial neural network pp. 373–381 (2020) http://hdl.handle.net/2324/4068614
Kustrin, S.A., Beresford, R.: Basic concepts of artificial neural network (ANN) modeling and its application in pharmaceutical research. J. Pharm. Biomed. Anal. 22(5), 717–727 (2002)
Author information
Authors and Affiliations
Corresponding author
Editor information
Editors and Affiliations
Rights and permissions
Copyright information
© 2023 The Author(s), under exclusive license to Springer Nature Singapore Pte Ltd.
About this paper

Cite this paper
Gupta, S., Gupta, S., Pandey, K.K., Dwivedi, K.S., Khan, S.A., Arora, P.K. (2023). Influential Effects of Process Parameters of Fused Deposition Modelling on Wear of a PLA Specimen: A Comprehensive Review. In: Yadav, S., Haleem, A., Arora, P.K., Kumar, H. (eds) Proceedings of Second International Conference in Mechanical and Energy Technology. Smart Innovation, Systems and Technologies, vol 290. Springer, Singapore. https://doi.org/10.1007/978-981-19-0108-9_59
Download citation
DOI: https://doi.org/10.1007/978-981-19-0108-9_59
Published:
Publisher Name: Springer, Singapore
Print ISBN: 978-981-19-0107-2
Online ISBN: 978-981-19-0108-9
eBook Packages: EngineeringEngineering (R0)