
Abstract
This paper is mainly based on the author’s several years of experience in enterprise digitalization projects, and designs a set of data visualization systems for the production digital scene of discrete manufacturing, aiming to help discrete manufacturing practitioners quickly realize a data visualization system that meets management requirements. In addition to the characteristics of general data visualization system, this system also makes targeted design and optimization for the characteristics of production planning of the discrete manufacturing industry, such as multiple varieties and small batches, relatively frequent changes of production plan, and multiple types of work involved, especially for real-time data and dynamic monitoring, some optimization algorithms have been made. The design plan includes, but not limited to the overall system architecture, functional module division, innovative functional design, partial implementation contents and several sample effects. And based on this design principle, the author has successfully implemented a visualization system for many local companies and received good feedback.
Access provided by Autonomous University of Puebla. Download conference paper PDF
Keywords
1 The Discrete Manufacturing
The manufacturing industry can be divided into process manufacturing and discrete manufacturing according to the organizational characteristics of the production process. In process manufacturing, the materials (raw materials) continue to go through the processing equipment, resulting in changes in the morphological and chemical properties of the materials, and get the finished products ultimately. For example, pharmaceuticals industry and chemicals industry are typical process manufacturing industries. Comparably, the process of discrete manufacturing is more complex. Generally, discretely manufacturing products are composed of multiple parts, each component may have independent processing and assembly processes, and there could exist sequential relationships between these processes. Furthermore, these parts need to be assembled after processing process has been completed to get the finished products. For instance, auto parts, electronics manufacturing, plastic production are discrete manufacturing. These characteristics often lead to more complex production management in discrete manufacturing. The production of discrete manufacturing has some characteristics as well as problems: (1) The degree of dependence on production (semi-)automation is relatively high. As China’s labor costs keep rising and automation technology continues to develop, the concept of replacing labor with machines in discrete manufacturing has now become a general consensus. (2) Product bill of material (BOM) is critical. Since the finished product of discrete manufacturing is assembled from various parts, and the BOM is fixed for a specific finished product, which is also one of the most critical basic data for production management. (3) The process flow of discrete manufacturing is more complex and diverse. The production process of discrete manufacturing has the characteristics of multitasking, and also multiple devices are producing simultaneously. There are even scenarios where one device produces different processes, and the same process is produced on different devices. (4) Production plan changes frequently. In fact, discrete manufacturing will start only when there comes an order, multi-variety production, small batch production and single-piece production are tricky issues as well. Thus the production plan is comparably difficult to develop and execute. The traditional manufacturing model cannot meet the changes in new markets and new environments. It is necessary to realize the transformation from mass manufacturing to mass customization [1]. At present, the industry is able to solve these problems in stages through digital transformation of discrete manufacturing workshops, partially.
2 Production Digitalization
Production digitalization mainly refers to the use of various advanced technologies such as automation, computers, big data, and the Internet of Things, to do information collection, processing, reorganization, optimization of workshop production resources (devices, production materials, personnel, production processes, etc.), to provide management-related application functions of production site. Besides, it would integrate the existing information systems and display all kinds of production-related data, and results in the form of reports, charts, data kanbans, etc., thereby to enhance the transparency of workshop production process, realizing paperless office, achieving agile production information transmission and accurate production decision making as well. Use big data technology to analyze and optimize data, which will eventually realize automated, intelligent, and customized intelligent manufacturing [2]. The overall framework for the digitizing production in discrete manufacturing is shown in Fig. 1.

The overall framework for the digitizing production in discrete manufacturing
In the digital transformation and upgrading of the discrete manufacturing industry, the system will collect massive amounts of data. How to correctly and effectively display these data and then deliver its in-depth value to users is an very important mission of data visualization.
How to quickly dive below the surface of the information contained in data is a key problem to be solved in the era of big data, so the importance of data visualization in this process is undoubted.
3 Data Visualization
Data visualization is the use of computer graphics and image processing techniques to transform raw data sets and convert them into understandable and interactive graphical processes. Data visualization is an emerging discipline that can provide people with the opportunities to observe data and explore the value behind the data [3]. Data visualization transforms boring words or numbers into more understandable graphical and colorful data visualization graphics, helping users to understand the value contained in the data. It can be divided into 3 processes: (1) data exchange: the original data is converted into a data structure table, and the data will be de-dried and cleaned before the conversion, thereby improving the validity of the data, while the traditional data model is easily affected by the error of the original data. (2) visualization mapping: this process is the key to the visualization process. In this process, the data table maps the abstract values, geographic coordinates, data relationships and other information in the data into visualization elements through specific mapping rules, which will be more easily accepted and understood by users and help them discover the laws behind the data. (3) view transformation: transform visual elements into views of terminal devices, thereby users can access information and perceive data laws through the web interactive interface.
There are already a number of general-purpose and commercial data visualization tools in the industry, such as Baidu’s Sugar, FanRuan’s FineBI, Alibaba’s AntV, Tableau’s Tableau, etc.
These commercial tools have been popular in the market because of their great graphical presentation and compatibility with different types of data, whereas they do not make targeted optimization solutions for discrete manufacturing currently. Therefore, this paper designs a data visualization system based on B/S architecture especially for digital workshop management of discrete manufacturing, adding some functional modules applicable to discrete manufacturing such as real-time monitoring of equipment and dynamic supervision of production tasks on the basis of general-purpose visualization system.
4 The Design of the Data Visualization System
This data visualization system consists of four major functional modules: data access and storage module, data analysis module, data visualization module and real-time interaction module. The system architecture is shown in Fig. 2.

The data visualization system architecture
-
1.
Data access and storage module. The system can directly access the device side IOT terminal, SCADA system, ERP system, MES system and other information system data. The system designed a set of data middleware, which can support socket protocol direct connection, Sql file import, excel format import, and intermediate table reads and writes, API gateway access and other forms. After data conversion, different types of connected data are stored in different types of databases based on the characteristics of the data types, including time series databases, relational databases, non-relational databases, key-value databases and other basic databases.
-
2.
Data analysis module. The system is designed with a set of data analysis modules that can be dynamically loaded into the algorithm models and all algorithm models are designed with a unified data interface, that is, the input content and output results are data tables in the database, where the input table is a temporary table that can be deleted after the analysis is completed, and the output table is a permanent table that will not be deleted. The system will have several classic algorithms built-in for users to call, such as regression models, neural network learning modules, etc. Among them, the built-in regression model algorithm training diagram is shown in Fig. 3.
Fig. 3 
Regression model algorithm training diagram
The built-in algorithm can support cloud upgrades. Users can customize the relevant algorithms and introduce them into the system as dynamic codes for dynamic invocation.
-
3.
Data visualization module. The system will encapsulate commonly used visualization components, including but not limited to dynamic tables, bar charts, pie charts, line charts, maps, card flops, gauges as basic components for users to call, and a number of visualization layout templates will be built in the system. Users can also customize the design of the visualization view and embed it into the module for use. The design of the visualization module will follow the web framework principle of model-template-view, where the model connects to the database, the template handles the business logic, and the view displays the data effect. In terms of human–computer interaction, the habits of discrete manufacturing industry practitioners will be fully considered to reduce the complexity of operation as much as possible, so that the data display will be shown to users in the most intuitive and convenient form. The module should be compatible with PC terminal and mobile terminal.
-
4.
Real-time interaction module. Since in the process of workshop production, users often give feedback, modify and adjust visualization data according to the actual progress of production, the operation may be in the form of buttons, embedded panels, web pages, mobile terminals, etc., thereby the real-time interaction module is the last piece of the business closed-loop version of the entire visualization system. In order to meet a variety of business scenarios, the real-time interaction module should have the compatibility of underlying communication and the real-time data feedback, so the core data of the real-time interaction module should be stored in memory and use a memory database to improve feedback efficiency.
-
5.
Features of the system. One of the features is the real-time monitoring of equipment: the system distinguishes the real-time production status of equipment by different colors in the form of graphics. What is more, it can make logical grouping and logical group line for the equipment and inform users about the status of the equipment they manage at a glance, thereby they can have comprehensive awareness of the equipment information quickly. The design sketch is as in Figs. 4 and 5.
Fig. 4 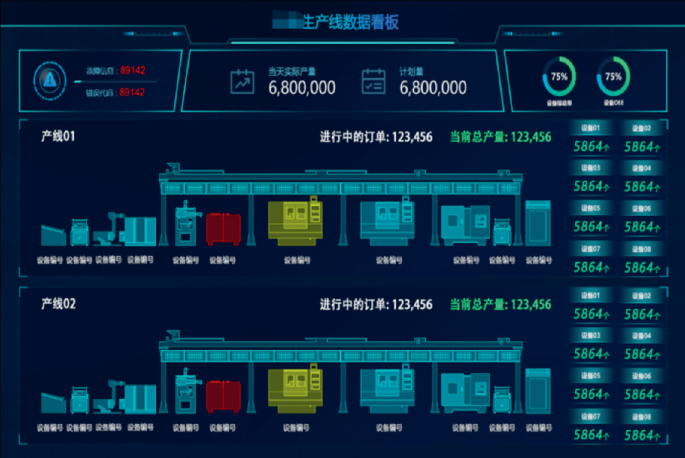
Production line Kanban demo
Fig. 5 
Equipment Kanban demo


Another feature is the dynamic monitoring of production tasks. Real-time monitoring of the order tasks being produced, in addition to displaying the basic information of the order. It also dynamically calculates and displays the estimated delivery time, warning status, equipment capacity consolidation calculation, etc., assisting front-line production personnel and management personnel to grasp the production situation in a timely manner (Fig. 6).

Production tasks Kanban demo
5 Conclusion
The author has been engaged in digital transformation services for discrete manufacturing workshops for a long time, and has implemented and deployed data visualization systems for more than 30 local discrete manufacturing companies. Based on years of practical engineering experience along with professional knowledge, this set of visualization system for the digitalization of discrete manufacturing production has been designed, and some functions have been realized. Currently, the system has been deployed to several customer project sites and has received relatively positive user feedback. In the future, we will continue to improve the design and implementation of the system, and strive to bring value to more discrete manufacturing data visualization scenarios.
References
Hu, S.J.: Evolving paradigms of manufacturing: from mass production to mass customization and personalization, pp. 3–8 (2013)
Lee, J., Bagheri, B., Kao, H.A.: A cyber-physical systems architecture for industry 4.0-based manufacturing systems. Manuf. Lett. 3, 18–23 (2015)
Bostock, M., Ogievetsky, V., Heer, J.: D3 data-driven documents. IEEE Trans. Visual Comput. Graphics 17(12), 230–2301 (2011)
Author information
Authors and Affiliations
Editor information
Editors and Affiliations
Rights and permissions
Copyright information
© 2022 The Author(s), under exclusive license to Springer Nature Singapore Pte Ltd.
About this paper

Cite this paper
Yan, J., Zhao, Y., Wang, W., Xu, F., Zhu, W., Jin, L. (2022). Design of Visualization System for Digitalization of the Discrete Manufacturing Industry. In: Yao, J., Xiao, Y., You, P., Sun, G. (eds) The International Conference on Image, Vision and Intelligent Systems (ICIVIS 2021). Lecture Notes in Electrical Engineering, vol 813. Springer, Singapore. https://doi.org/10.1007/978-981-16-6963-7_48
Download citation
DOI: https://doi.org/10.1007/978-981-16-6963-7_48
Published:
Publisher Name: Springer, Singapore
Print ISBN: 978-981-16-6962-0
Online ISBN: 978-981-16-6963-7
eBook Packages: EngineeringEngineering (R0)