
Abstract
This paper deals with the adsorption of 2-picoline from aqueous solution to tea waste activated carbon (TWAC). The characteristics and effects of the adsorbent on different parameters of adsorption have been examined. Initial pH (pH0), adsorbent dose (m), contact time (t), initial concentration (C0), and temperature (T) are the adsorption parameters tested using a batch adsorption sample. In the present analysis, the adsorbent used comprises approximately 48% fixed carbon and a porous structure revealed from morphological research. Maximum 2-picoline removal was found to be 83% and 56% TWAC for lower (50 mg/L) and higher (500 mg/L) 2-picoline concentrations, respectively, with a dose of 15 g/L 303 K, pH0 of 6.54, and a contact time of 60 min. Adsorption was found to be very quick, and in the initial 5 min of contact time, about 55% of 2-picoline removal was observed. The adsorption equilibrium analysis was also carried out using the isothermal equations of Langmuir and Freundlich. Compared to Langmuir adsorption isotherm, the adsorption data showed reflecting Freundlich isotherm as well. 16.47 mg/g was found to be the highest monolayer adsorption power. Strong potential for removing contaminants from wastewater has been identified by the activated carbon generated from tea waste.
Access provided by Autonomous University of Puebla. Download conference paper PDF
Keywords
1 Introduction
2-Picoline (α-picoline) is one of the derivatives of pyridine. 2-picoline is a colorless liquid with a strong sour odor, and it is used to avoid ammonia depletion from fertilizers in several agrochemicals and pharmaceuticals. It is also used as a solvent and a raw material for various chemicals in the manufacturing of different polymers, textiles, oils, pesticides, medicines, and dyes. Antituberculosis, respiratory stimulants, local anesthetics, and analgesics function as various pyridine derivatives. It is water-soluble and alcohol-ether miscible. When the 2-picoline is exposed to the blaze, the vapors are a fire and explosion. It emits highly radioactive NOx gases in an oxidative environment when heated for decomposition. It is harmful when in contact with the skin and eye, absorption, and breathing [1,2,3].
Wastewaters containing 2-picoline are derived from manufacturing units processing of pyridine and its chemical derivatives. Typical 2-picoline concentration in wastewater produced by multidrug intermediate plant processing of pyridine and its chemical derivatives ranges from 20 to 200 mg/L. The concentration will grow considerably during spill episodes. Odor nuisance causes due to multidrug intermediate plants are a cause of odor nuisance, and this strong odor originates either from sewage lines or from storage facilities [4].
For the treatment of wastewater which contains 2-picoline, different treatment strategies such as adsorption [5] and biodegradation [6] may be employed. Adsorption, given that the adsorption procedure is cost-effective, may be the desired treatment method. Tea waste (TW) is a waste material collected from VNIT campus hostels that are tossed down during use as waste. TW requires no costs, except for its processing and transfer to the point of utility. TW has been used for the removal of various pollutants as an adsorbent, owing to its excellent sorption properties by many researchers [7,8,9,10,11,12,13,14].
The characteristics of the adsorbent and the influence of the initial pH of the solution range from 2 to 12, the adsorbent dosage 2–25 g/L, the contact time 0–360 min, the initial 2-picoline concentration 50–500 mg/L, and the temperature 283–323 K of the 2-picoline adsorption on TW have been studied and presented in the following sections.
2 Materials and Methods
2.1 Adsorbate
In the present analysis, all the chemicals used were analytical reagent grade. Upper India Science Company, Nagpur, India, supplied the adsorbate, 2-picoline (Loba Chemie, CAS-109-06-8, formula = C6H7N, molecular mass = 93.13 g/mol and λmax = 262 nm). 1000 mg/L concentration of the 2-picoline stock solution was prepared by taking the right amount of 2-picoline and mixed with double-distilled water (DDW), to achieve the desired test concentrations of 2-picoline obtained by successive dilution of stock solution with DDW.
2.2 Adsorbent
Tea waste was collected from hostels in VNIT, Nagpur, washed several times to extract dirt with DDW, and then kept at 378 K for 48 h for oven drying. 1:0.5 proportions (g:ml) of dried tea waste are combined with orthophosphoric acid [H3PO4]. This blender was later heated for 1 h in the muffle furnace at 823 K for carbon preparation. The prepared carbon was washed with DDW again for complete acid removal. The expulsion of acid completely from the prepared activated carbon was washed with DDW. In the hot air oven, the washed activated carbon was dried at 378 K for 2–3 h. The proximate analysis of TWAC was conducted using IS 1350 (I), 1984. Using SEM JEOL JSM-6380A, SEM (scanning electron microscopy) of TWAC before and after adsorption was performed.
2.3 Analytical Measurement
UV–VIS spectrophotometer was used for the reading of the residual 2-picoline concentration at the wavelength (λmax = 262 nm) (model: UV-2450, SHIMADZU, Japan). By plotting 2-picoline concentrations versus absorbance, the calibration graph was prepared. The concentrations of 1–0 mg/L, the 2-picoline solutions were prepared, and the absorbances were noted down and the calibration curve was plotted. To calculate the 2-picoline concentration in an uncertain solution, this calibration graph was used. Solutions were diluted and analyzed for higher 2-picoline concentrations (>10 mg//L). All test were conducted in Erlenmeyer flasks of 250 ml.
2.4 Batch Adsorption Study
An experimental batch analysis was conducted to determine the ability of TWAC for aqueous solution adsorption of 2-picoline. The tests were carried out using a 50 ml 2-picoline solution with known concentration and the quantity of adsorbent taken into 250-ml stoppered Erlenmeyer flasks and shook at 150 RPM in an orbital shaker. 0.1 N NaOH and 0.1 N HCl solutions were used to get the necessary initial pH of the 2-picoline solution. To filter the samples, Grade 1 Whatman filter paper was used. The filtrate analysis was conducted with the UV–VIS spectrophotometer at λmax = 262 nm. The depletion of the 2-picoline solution was examined during the trial. No loss of 2-picoline concentration was detected during the experiments. The adsorbed 2-picoline per unit weight of TWAC and the 2-picoline percent extracted were determined using the following equations:
where
-
C0 = initial 2-picoline (mg/L) concentration
-
Ce = 2-picoline equilibrium concentration (mg/L)
-
m = quantity of TWAC (g)
-
qe = quantity of 2-picoline adsorbed by TWAC (mg/g)
-
V = 2-picoline solution volume (ml).
3 Result and Discussion
3.1 Adsorbent Characterization
The proximate analysis of TWAC was conducted, and the results having moisture content 9.16%, ash 27.52%, volatile matter 15.13%, and fixed carbon 48.15% were found. There is a fair volume of fixed carbon in the adsorbent TWAC, which increases the absorption potential of the adsorbent. TWAC’s BET surface area was estimated to be 342.64 m2/g.
SEM micrographs analyzed the surface morphology of TWAC. Figure 1a shows the uneven and permeable particles of unloaded TWAC that increase the surface adsorption of 2-picoline. Figure 1b shows the 2-picoline TWAC-loaded SEM micrograph. It is possible to closely observe the pores filled with 2-picoline molecules, making the surface evener and smoother.

SEM micrographs at 200X magnification, a unloaded TWAC, b TWAC loaded with 2-picoline
3.2 Effect of Dose (m) of TWAC
Adsorption of 2-picoline by TWAC from the aqueous solution was studied using various TWAC doses with an initial 50 mg/L concentration. Figure 2 shows that with the increased dosage of TWAC from 2 to 15 g/L, the percent elimination of 2-picoline was observed to rise steadily (38.4–89.89%). The further increase in the TWAC dosage from 15 to 25 g/L shows a small increment in the adsorption of 2-picoline. With an increase in dose, the 2-picoline adsorption increased due to the existence of a higher number of unoccupied surface spots and a wider surface area. Then again, it decreases with an increase in the dose as a result of site saturation and solid accumulation due to particle–particle interaction [4, 15, 16]. However, there is a marginal improvement in the percentage of reduction after 15 g/L of the TWAC dosage. Thus, the ideal dosage of TWAC is 15 mg/L and upcoming experiments are performed using the same dose.

Effect of TWAC dose on removal of 2-picoline and qe (initial concentration (C0) = 50 mg/L, pH = 6.54, time of contact (t) = 60 min, Temperature (T) = 303 K, RPM = 150, volume of sample (V) = 50 ml)
3.3 Effect of pH0
A significant parameter affecting the mechanism of adsorption is the initial pH of the solution. Solution pH0 influences charge on the adsorbent surface, speciation, and degree of ionization of the solution [17]. The impact of pH0 on 2-picoline adsorption for C0 = 50 mg/L with m = 15 g/L was assessed at natural pH and different pH values ranging from 2 to 12 for 1 h contact time at 303 K, and the results are shown in Fig. 3.

Effect of initial pH0 on 2-picoline removal (C0 = 50 mg/L, V = 50 ml, t = 60 min, RPM = 150, m = 15 mg/L, T = 303 K)
It is observed from the pH analysis that more than 83% of the adsorbate is adsorbed at the normal pH after it decreases. The reduction in pH-increasing adsorption is due to ion repulsion.
In the present analysis, the point of zero charge (PZC) has also been tested. The pH at which no charge is borne by the adsorbent surface is known as the point of zero charge. Figure 4 illustrates the surface of TWAC has a PZC of 6.4, and thus, the surface at this pH will behave as neutral. Increasing the pH above 6.4 will make the surface negative and make the surface favorable by reducing the solution pH from 6.4. It is observed that the removal of 2-picoline is greater at pH below PZC.

TWAC point of zero charge in the 0.1 KNO3 solution
3.4 Effect of Contact Time (t)
The purpose of the time analysis is to assess the effect of contact time on the adsorption of 2-picoline and deciding the equilibrium contact time. The effect of contact time studied for C0 = 50, 100 and 200 mg/L at 303 K and the outcomes are shown in Fig. 5. Due to the presence of more surface sites, 2-picoline removal improves steadily with the contact time initially up to 79% and achieves equilibrium after 60 min. Thus, because of the repulsive force among the 2-picoline on the TWAC surface and that in the solution, certain surface sites remain unoccupied. The research lasted for 360 min, but no substantial improvement in 2-picoline adsorption after 60 min of touch time was found. Therefore, 60 min was known as the touch time of equilibrium. Figure 5 also shows the effect on TWAC of the concentration of 2-picoline on its adsorption.

Contact time effect on 2-picoline removal by TWAC (C0 = 50 mg/L, 100 mg/L and 200 mg/L, m = 15 g/L, T = 303 K, pH0 = 6.54, RPM = 150, V = 50 ml)
It is observed that 2-picoline removal decreases at any time with a rising concentration of C0 (mg/L), but with increasing concentration, the adsorptive potential of qt (mg/g) increases.
This can be due to the rise in driving force as the solution resistance to 2-picoline molecule adsorption decreases with an increase in the concentration of 2-picoline [18, 19].
3.5 Effect of Initial Concentration (C0) and Temperature (T)
The effect of the initial concentration (50 mg/L ≤ C0 ≤ 500 mg/L) on the removal and absorption potential of 2-picoline on TWAC along with the temperature (283 K ≤ T ≤ 323 K) was investigated at a dose of 15 g/L and the contact time of 60 min, and the outcomes are shown in Fig. 6. The outcomes revealed a decline in the removal of 2-picoline with increasing C0 since TWAC adsorbs a constant volume of 2-picoline at a fixed dose. TWAC adsorptive capacity, i.e., qe (mg/g), also increases as the C0 increases as a result of less resistance to 2-picoline mass transfer from the solution. Figure 6 further shows that the adsorption of 2-picoline decreases with the increase in temperature of the solution from 283K to 323K. At high temperature, 2-picoline molecules consist of high kinetic energy which causes very tough to bound on the surface of TWAC.

Concentration and temperature effect on 2-picoline removal and adsorption capacity by TWAC (m = 5 g/L, C0 = 50–500 mg/L, pH0 = 6.54, RPM = 150, t = 60 min, V = 50 mL)
3.6 Adsorption Isotherms
Adsorption equilibrium analysis has been conducted at an equilibrium temperature and time to determine the relationship between 2-picoline adsorbed on TWAC and remaining in solution. By creating a systematic link between equilibrium curves [16], the adsorption mechanism for 2-picoline removal can be optimized. Isothermal models such as Langmuir and Freundlich have been researched to resolve equilibrium properties of the phase of adsorption.
The isothermal model of Langmuir is given by the equation [20]:
where
-
Ce = concentration of 2-picoline at equilibrium (mg/L)
-
KL = adsorption energy (L/g)
-
qe = the sum at equilibrium (mg/g) of 2-picoline adsorbed on TWAC
-
qm = maximum capability of adsorption (mg/g) (Fig. 7).
Fig. 7 
Langmuir isotherm graph Ce versus Ce/qe

The Langmuir constants were calculated from the above graph as KL = 0.04 L/g, and the maximal adsorption power was qm = 16.47 mg/g.
The isothermal model of the Freundlich is given by the equation [21]:
where
-
KF = adsorbent power (L/g)
-
1/n = adsorption intensity (Fig. 8).
Fig. 8 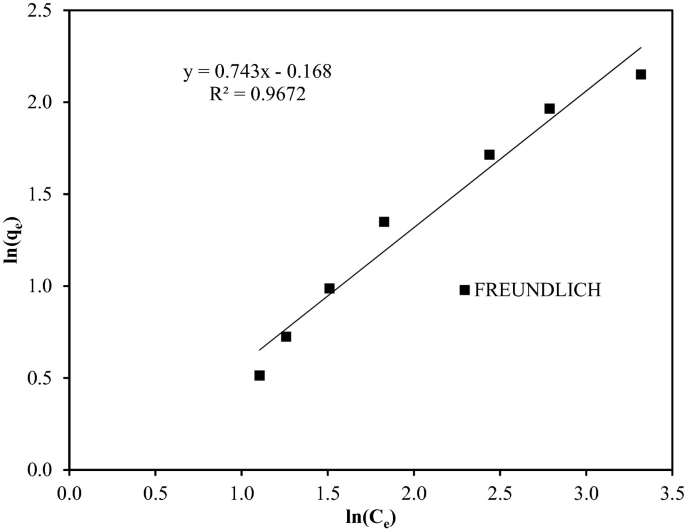
Freundlich isotherm graph ln Ce versus ln qe

KF = 0.85 L/g and 1/n = 0.744 were the Freundlich constants obtained from the graph.
4 Conclusions
It can be inferred from the present analysis that tea waste can be used as a cost-effective adsorbent for 2-picoline treatment from the wastewater. Tea waste is an agricultural waste that, if not properly treated, will produce environmental emissions due to its oxidation in the atmosphere. It can then be used as an adsorbent and, by using one waste substance for the disposal of another waste, the world can be preserved. Thus, there is no additional expense for this commodity for tea waste available at the throwaway expense, and therefore, it is very economical relative to activated charcoal. The characteristic analysis of adsorbent showed that TWAC has fixed carbon about 48%, which boosts its effectiveness for the removal of other pollutants from water or wastewater. SEM analysis verified the aqueous solution of 2-picoline adsorption, which revealed that after adsorption there is a change in morphology. The batch adsorption analysis showed that for the concentration of 50 mg/L at 303 K 15 g/L is the optimum dose. For the present analysis, the optimum pH was found to be 6.54. 2-picoline adsorption increases with the solution initial pH increasing. It was found that the equilibrium time for 2-picoline removal was 60 min. For the initial concentration of 50 mg/L and 500 mg/L, the percentage removal and adsorption capacities were 83 percent and 2.64 mg/g and 56% and 16.06 mg/g, respectively. According to the equilibrium analysis, the optimum potential for adsorption is 16.47 mg/g. Compared to the Langmuir equation, the Freundlich isothermal equation was found to describe the adsorption data as well. Therefore, TWAC is cost–cost adsorbent for the removal of 2-picoline and can also be recommended for other hazardous materials as an adsorbent. The effective usage of organic waste has a greater potential for commercial purpose as an adsorbent.
References
Yates FS (1984) Pyridine and their benzo derivatives: (vi) applications. In: Katritzky AR, Rees CW (eds) Comprehensive heterocyclic chemistry: the structure, reaction, synthesis and uses of heterocyclic compounds, vol 2, Part 2 A, Chapter 2.09. Pergamon Press, Oxford, pp 511–524
Kirk RE, Othmer DF (1968) Pyridine and pyridine derivatives. In: Encyclopedia of chemical technology, 2nd edn, vol 16, pp 780–806
Lewis RJ Sr (2004) Sax’s dangerous properties of industrial materials, 11th edn. Wiley, Hoboken, New Jersey, p 3106
Lataye DH, Mishra IM, Mall ID (2006) Removal of pyridine from aqueous solution by adsorption on bagasse fly ash. Ind Eng Chem Res 45:3934–3943
Mohan D, Singh KP, Sinha S, Gosh D (2005) Removal of pyridine derivatives from aqueous solution by activated carbons developed from agricultural waste materials. Carbon 43:680–1693
Sims GK, Sommers LE (1985) Degradation of pyridine derivatives in soil. J Environ Qual 14:580–584
Abbas MN (2014) Application of used tea leaves for multi functions. Eur Acad Res 2:8660–8690
Adachi A, Loku A, Taniyama K, Okano T (2008) Use of tea or coffee lees as adsorbent for removal of benzene from wastewater. J Health Sci 54(4):478–481
Ahluwalia SS, Goyal D (2005) Removal of heavy metals by waste tea leaves from aqueous solution. Eng Life Sci 5:158–162
Ahmaruzzaman M, Gayatri SL (2010) Activated tea waste as a potential low-cost adsorbent for the removal of p-nitrophenol from wastewater. J Chem Eng Data 55:4614–4623. https://doi.org/10.1021/je100117s
Akar E, Altinişik A, Seki Y (2013) Using of activated carbon produced from spent tea leaves for the removal of malachite green from aqueous solution. Ecol Eng 52:19–27. https://doi.org/10.1016/j.ecoleng.2012.12.032
Auta M, Hameed BH (2011) Optimized waste tea activated carbon for adsorption of Methylene Blue and Acid Blue 29 dyes using response surface methodology. Chem Eng J 175:233–243. https://doi.org/10.1016/j.cej.2011.09.100
Duran C, Ozdes D, Gundogdu A, Imamoglu M, Senturk HB (2011) Tea-industry waste activated carbon, as a novel adsorbent, for separation, preconcentration and speciation of chromium. Anal Chim Acta 688:75–83. https://doi.org/10.1016/j.aca.2010.12.029
Lin D, Wu F, Hu Y, Zhang T, Liu C, Hu Q, Hu Y, Xue Z, Han H, Ko TH (2020) Adsorption of dye by waste black tea powder: parameters, kinetic, equilibrium, and thermodynamic studies. J Chem 2020, Article ID 5431046, 13 p. https://doi.org/10.1155/2020/5431046
Lataye DH, Mishra IM, Mall ID (2008) Pyridine sorption from aqueous solution by rice husk ash (RHA) and granular activated carbon (GAC): parametric, kinetic, equilibrium and thermodynamic aspects. J Hazard Mater 154:858–870
Lataye DH, Mishra IM, Mall ID (2008) Adsorption of 2-picoline onto bagasse fly ash from aqueous solution. Chem Eng J 138:35–46
Srivastava VC, Swamy MM, Mall ID, Prasad B, Mishra IM (2006) Adsorptive removal of phenol by bagasse fly ash and activated carbon: equilibrium, kinetics and thermodynamics. Colloids Surf A Physicochem Eng Asp 272:89–104. https://doi.org/10.1016/j.colsurfa.2005.07.016
Lataye DH, Mishra IM, Mall ID (2009) Adsorption of α-picoline onto rice husk ash and granular activated carbon from aqueous solution: equilibrium and thermodynamic study. Chem Eng J 147:139–149
Lataye DH, Mishra IM, Mall ID (2011) Removal of 4-picoline from aqueous solution by adsorption onto bagasse fly ash and rice husk ash: equilibrium, thermodynamic, and desorption study. J Environ Eng 137:1048–1057
Langmuir I (1918) The adsorption of gases on plane surfaces of glass, mica and platinum. J Am Chem Soc 40:1361–1403
Freundlich HMF (1906) Over the adsorption in solution. J Phys Chem 57:1100–1107
Author information
Authors and Affiliations
Editor information
Editors and Affiliations
Rights and permissions
Copyright information
© 2022 The Author(s), under exclusive license to Springer Nature Singapore Pte Ltd.
About this paper

Cite this paper
Darla, U.R., Saini, D., Lataye, D.H. (2022). Adsorption of 2-Picoline on Tea Waste: Studies on Characteristics of Adsorbent and Effects on Various Adsorption Parameters. In: Laishram, B., Tawalare, A. (eds) Recent Advancements in Civil Engineering. ACE 2020. Lecture Notes in Civil Engineering, vol 172. Springer, Singapore. https://doi.org/10.1007/978-981-16-4396-5_37
Download citation
DOI: https://doi.org/10.1007/978-981-16-4396-5_37
Published:
Publisher Name: Springer, Singapore
Print ISBN: 978-981-16-4395-8
Online ISBN: 978-981-16-4396-5
eBook Packages: EngineeringEngineering (R0)