
Abstract
Today, the most commonly used composites, with the largest market share, are resin matrix composites. Glass-fiber-reinforced plastics (GFRPs) have excellent performance/price ratios and weathering properties and can be easily molded into complex shapes. They also perform better in many applications and have lower densities, than metals.
Access provided by CONRICYT-eBooks. Download chapter PDF
Today, the most commonly used composites, with the largest market share, are resin matrix composites. Glass-fiber-reinforced plastics (GFRPs) have excellent performance/price ratios and weathering properties and can be easily molded into complex shapes. They also perform better in many applications and have lower densities, than metals.
The appropriate design, manufacture, and choice of GFRP depend on an understanding of this type of composite. Firstly, coordination between the resin and reinforcing fiber is needed. For example, the elongation at rupture of glass fibers is about 5.3% and the resin should have at least the same elongation to give the composite the optimum properties. The resin and fiber also must be adhered firmly. Resistance to environmental factors, water, and other corrosive media, and the ability to withstand a constant stress cycle are essential properties of resin systems. For a given resin–fiber system, the higher the fiber volume fraction is, the better the mechanical properties of the composite are. However, the fiber volume fraction is limited by the manufacturing technique. In the shipbuilding industry, the fiber volume fraction of a composite produced by hand lay-up is generally about 30–40%. In the aerospace industry, the fiber volume fractions of composites produced using complicated and precision processes can be up to 70%. The orientation of the fibers in a composite depends on the composite loading method. This anisotropy can be an important advantage of a composite or may be a shortcoming if dealt with poorly.
Secondly, the personnel who fabricate the final structures can do almost nothing to change the inherent properties of metals. However, composite materials and structures are made simultaneously with the composites. An appropriate and reasonable choice of manufacturing process is therefore the most important step in determining the composite structures and properties. It is difficult to draw up a national composite material standard, and only a composite products standard has been compiled. Because of the anisotropy of composites and the close relationship between the composite properties and manufacturing process, methods for testing composites are complicated. Methods for property testing and composite characterization are important aspects of resin matrix composites.
2.1 Core Materials
According to engineering theory, the bending stiffness of a panel is directly proportional to the cube of the thickness, so increasing the panel thickness is an effective way of enhancing its bending stiffness. This concept is widely used in the design of engineering structures. A low-density core material is used as a core board for addition to a composite laminate to increase the thickness and stiffness of the laminate.
Figure 2.1 shows a sandwich core laminated with a core board under a bending load. The sandwich-core laminate can be regarded as an I-beam. The laminate skin acts as the flange of the I-beam, and the sandwich core acts as a web and is subjected to shear. In this loading model, the top skin is under compression, the bottom skin is under tension, and the core is under shear. The most important property of the core material is therefore the shear strength or shear stiffness. In addition, when lightweight and thin laminate skins are used, the sandwich board can be subjected to a compressive load to avoid damaging the thin skins, stabilizing the structure surfaces to protect the sandwich structure from premature failure.

Sandwich laminate under bending load
Sandwich structures are widely used in various environments, from the seabed to outer space, and many processing methods are available. Designers therefore have to select core materials with appropriate properties based on the service requirements and process. The properties required for sandwich structures and core materials are listed in Table 2.1. One or more core material properties must meet every property requirement of the sandwich structure. The properties of a sandwich structure should therefore be guaranteed, and appropriate related core materials must be selected.
2.1.1 Types of Core Material
2.1.1.1 Foam Core
Foams are the most popular core materials. They can be fabricated from various synthetic polymers such as poly(vinyl chloride) (PVC), polystyrene (PS), polyurethane (PU), poly(methyl metha-crylamide–acrylic) (PMMA), polyetherimide (PEI), and styrene–acrylonitrile. All these can be supplied with densities over a wide range, from 30 to 300 kg/m3. For composite structures, the most popular density range is 40–200 kg/m3. Various thicknesses can be chosen, and the typical thickness is 5–50 mm [1].
-
(1)
PVC foam
Closed-pore PVC foam is a core material that is used in a wide range of high-performance sandwich structures. Strictly speaking, this type of foam is a blend of PVC and PU, but is usually simply referred to as PVC foam. The PVC foam properties depend on the static, dynamic, and water absorption properties of the foam. In general, foams can be processed at a wide range of operating temperatures, i.e., −240 to 80 °C, and have good resistance to many chemicals. Although PVC foams are usually flammable, flame-resistant products are also available and are generally used in applications with higher fire-resistant requirements, such as train parts. When foam is used as the core material in a GFRP skin sandwich structure, it must be resistant to styrene, to enable its safe use with polyester resins. PVC foam is therefore used in many industries and is usually supplied in the form of ordinary or grid sheets to facilitate shape formation.
There are two main types of PVC foam: cross-linked and non-cross-linked. The former, which is often called “linear” (e.g., Airex R63.80), is softer and easier to heat-set. However, some of the mechanical properties of such foams, e.g., density, and heat and styrene resistances, are poorer than those of cross-linked PVC foams. Cross-linked PVC foam is hard and brittle, and a panel made of such foam is much stiffer, hard to soften, and has low creep under heating. Typical cross-linked PVC products are Herex C series foam, Divinycell H and HT-class, Polimex Klegecell, and Termanto.
A new generation of toughened PVC foams is available. For these foams, some of the mechanical properties of cross-linked PVC are sacrificed to improve the stiffness of the linear foam. Typical products are Divinycell HD-class ones.
Because of the chemical structures of PVC/PU, such foams must be coated and sealed with resin to enable curing of the cross-linked PVC foam with prepreg tape at low temperatures. The foam can be treated specifically for thermostability, but the treatment merely improves the foam dimensional properties and reduces the amount of gas during high-temperature processing.
-
(2)
PS foam
PS foam is lightweight (40 kg/m3), cheap, and easily ground; it is therefore widely used in the manufacture of sailing boats and surfboards. It is not suitable for high-performance components because of its poor mechanical properties. This foam cannot be used in combination with polyester resin because styrene can dissolve in polyester resin.
-
(3)
PU foam
PU foam has medium mechanical properties. The foam surface at the resin/core material interface tends to deteriorate with time, resulting in delamination between the skin and core materials. Usually, PU foams are only used in the manufacture of models and skeletons, and the sideboards of strengthened components in various structures. However, PU foam can also be used in sandwich panels that are subjected to small loads. These panels are widely used as insulating boards. PU foams have good high-temperature properties, good sound-absorbing properties and can be easily cut to required contours.
-
(4)
Polyacrylamide foam (acrylic foam)
Acrylic foam has the highest strength and stiffness for a given density, and excellent dimensional stability. In addition, it is easy to use with commonly used high-temperature-cured prepreg tape. However, it is expensive and its use is limited to the manufacture of aeronautic composite parts such as the rotor wings of helicopters and aircraft covers.
-
(5)
SAN foam
The properties of SAN foam are similar to those of toughened cross-linked PVC foam, but SAN foam has a higher elongation and toughness. Its impact-absorbing ability is therefore superior to that of toughened PVC foam. The difference between the stiffness of SAN foam and that of toughened PVC foam is that the SAN stiffness is inherent, whereas a toughener is added to the PVC. The stiffness of SAN foam therefore does not change significantly over time.
Because SAN foam has the same toughness and elongation as linear PVC foam, and it has better heat-resistant and static properties, it is now replacing linear PVC foam in many applications. In addition, SAN foam can be hot-formed to produce curved parts. Thermally stable SAN foam does not interfere with the inherent chemical structure of PVC and can therefore be used with PVC in low-temperature-cured prepregs. Typical SAN foam products are ATC Core-cell series.
-
(6)
Other thermoplastic foams
New techniques for preparing thermoplastic foams are constantly being developed; therefore, the number of types of available foam cores is increasing. Typical products are PEI foam and polyetherimide (PEI), which combine excellent fire-resistant properties and high service temperatures. Although they are relatively costly, they are used in heat- and fire-resistant structures with service temperature in the range −194 to 180 °C. They are particularly suitable for the inner decoration of aircrafts and trains to meet the most stringent fire-resistant specifications.
2.1.1.2 Honeycomb Core
Various materials can be used to make honeycomb cores for sandwich structures. The core can be made of paper or cardboard for applications that need lower strength, stiffness, and smaller loads, such as interior doors.
Aluminum honeycomb can be used to make high-strength, high-stiffness, and lightweight parts of aircraft structures. Planar and curved surface composite structures can be fabricated based on honeycombs. The honeycomb can be made to conform to a complex camber without using excessive mechanical force and heating.
Thermoplastic honeycombs are usually produced by extrusion molding, and then worked to a required thickness. Other honeycombs such as paper and aluminum honeycombs are produced using a multistep process. In this process, many adhesive strips are first attached to many large and thin material sheets, and then the stacked materials are loaded on a hot press to cure the adhesive strips. For an aluminum honeycomb, the stacked materials are cut to the size of the core sheets based on the required thickness of the core material. The core sheet is then slowly stretched, resulting in a continuous honeycomb sheet with a hexagonal grid.
For a paper honeycomb, the core sheet is stretched slowly and enlarged to give a large honeycomb stack of thickness several Chi (1 Chi = 1/3 m) in thickness. This brittle honeycomb core is then immersed in a resin pan, while maintaining the stretched hexagonal structure. The excess resin is drained away, and the honeycomb is cured in an oven. Once the impregnated resin has been cured, the honeycomb core stack is sufficiently strong and can be cut to a honeycomb core sheet of a required thickness.
For both paper and aluminum honeycombs, the honeycomb grid contours can be regulated by changing the stretching level, to give regular hexagonal grid or over-stretched structures. The mechanical properties and processing conformations can be varied by changing the grid contours. Because the honeycomb is a bonding structure, it has different mechanical properties in directions 0° and 90° to the core sheet.
The skin of the sandwich structure is usually made of a fiber-reinforced plastic (FRP) material. Any sheet material with appropriate properties can be used, including wood, plastics (such as melamine), and metals (aluminum or steel). The grid holes in honeycomb structures can also be filled with hard foam. This increases the binding area of the skins and the stability of the grid walls, and the mechanical, insulating, and sound-proofing properties of the core sheet are improved accordingly.
The properties of honeycomb materials depend on the grid size, and the thickness and strength of the web materials. Generally, the thickness of honeycomb core board is 3–50 mm, and the board dimensions are 1200 mm × 2400 mm, but honeycomb core sheets of size up to 3 m × 3 m can be manufactured.
Honeycomb core sheets can be used to produce high-performance and lightweight laminates. However, because of the small binding surfaces of the skin and core sheets, high-performance resin systems such as epoxy resins have to be used to ensure binding between the laminate skin and core materials as required.
-
(1)
Aluminum honeycomb
Aluminum honeycomb can be used to produce structural materials with optimum strength/weight ratios. Aluminum foil adhesion can be achieved in various ways; therefore, honeycombs with different grid contour patterns can be obtained by changing the thickness of the aluminum foil and the grid size. Honeycomb materials are normally supplied as unstretched stacks, which are stretched out into sheets on site.
Although aluminum honeycombs have good mechanical properties and are fairly cheap, they should be used carefully in some applications such as large marine structures. There are potential corrosion problems in briny environments. It is therefore necessary to ensure that the aluminum honeycomb is not in contact with carbon composite skins because the conductivity of the skin will aggravate electrochemical corrosion. Another problem with aluminum honeycombs is that they do not show a mechanical memory effect. If the sandwich structure is subjected to an impact, the honeycomb is deformed irreversibly, but the FRP skin recovers because of its flexibility. As a result, the skin debonds and the mechanical properties deteriorate.
-
(2)
Nomex foam
A Nomex honeycomb is made from Nomex paper, which consists of Kevlar fibers. Generally, this raw paper honeycomb is impregnated with phenolic resin to make Bakelite and honeycomb cores with high strength and heat resistance. This foam is combined with a phenolic resin skin to make light wallboards inside aircraft. To meet the flame-resistant requirements for applications such as the inner wallboards of public transport vehicles, and to produce special-grade honeycomb cores, the core cells are filled with phenolic foam to increase the binding area and enhance the insulating properties. Because of its good mechanical properties, low density, and good long-term stability, Nomex combs are being increasingly widely used in high-performance non-aerospace parts. However, it is more expensive than other core materials, as shown in Fig. 2.2.

Comparison of various core prices
-
(3)
Thermoplastic honeycomb
Honeycombs made of other thermoplastics are lightweight, useful for enhancing some properties, and recyclable. The main drawbacks are difficulties in achieving a firmly bonded interface, and low stiffness. Such honeycombs are generally used in structures bearing heavy loads and in ordinary inner wallboards.
The following polymers are used for general purposes.
-
1.
ABS resin: This is used in structures that require high stiffness, toughness, impact strength, surface hardness, and dimensional stability.
-
2.
Polycarbonate: This is used in structures that require good UV stability, transparency, heat resistance, and self-extinction.
-
3.
Polypropylene: This is used in structures that require good chemical resistance.
-
4.
Polyethylene: This is used in general structures that must be cheap.
2.1.1.3 Wood
Wood can be considered as a natural honeycomb. The microscopic structure of wood is similar to the hexagonal porous structures of man-made honeycombs. When sandwich structures are produced with wood in such a way that the direction of the grain is perpendicular to the skin plane, the performances of manufactured components are similar to those of man-made honeycomb components. Although various chemical treatments can be used to give moisture resistance, all wood core materials are sensitive to moisture. If the wood is not well packed with laminate board or resin, it will be easily corrupted.
-
(1)
Light wood
The most common wood core material is end-grained light wood. Light wood cores were first used in 1940 as airship shells. Aluminum skin–light wood sandwiches are used to withstand repeated shocks when landing on water. End-grained light wood core materials are used in FRP structures in the marine industry because of their shock-resistant properties In addition to having high compressive strength, light wood is a good insulating material and its absorption properties are good. The material does not deform when heated, and in a flame it is involved in the insulation and ablation layers. When the core material is slowly burned, the skin that is not exposed can still maintain its structural integrity. In addition, it can float and can be processed using simple tools and equipment.
Light wood cores can be produced in accordance with a specific contour size, of thickness 3–50 mm, and coated with fabric. The thickness of a hard end-grained core material can be up to 100 mm. This core material can be easily coated with resin and can be processed using vacuum bag or prepreg methods or manufactured under pressure, e.g., by resin transfer molding (RTM).
A disadvantage of light wood is its high density; the minimum density is usually 100 kg/m3. This results in deterioration caused by absorption of excess resin during lamination, although this can be reduced by using presealed foam. However, it is often used in structures where weight is not a serious consideration, or in local high-stress areas.
-
(2)
China fir
China fir is also commonly used as a core material. In the marine industry, it often serves as the core of lath structures, with composite skins on both sides. The grain direction of China fir is parallel to the laminate surface. The fiber orientation of China fir is arranged along the ship length to achieved vertical stiffness. The FRP skin is laminated at ±5 to obtain stiffness and protect the wood.
2.1.1.4 Other Core Materials
Although other materials are not usually used as the cores of sandwich structures, there are many thin and low-density fabric materials that can be used to reduce the density of solid laminated structures. These materials such as COREMAT and SPHERETEX consist of a hollow ball filled with a nonwoven mat fabric; this reduces the density. Their thickness is usually 1–3 mm. They are laid on the middle of the laminate board, like another layer of reinforcing material, and leached with laminating resin during laying. However, although the middle layer consisting of a hollow ball instead of resin is heavier than a foam or honeycomb core, its density is lower than that of glass-fiber laminated board of similar thickness. This type of sandwich material is very thin and easy to lay up on a double-curvature surface. Methods for its use are convenient and fast.
2.1.2 Comparison of Mechanical Properties of Core Materials
Figures 2.3 and 2.4 show the changes in shear strength and compressive strength with density of some of the core materials discussed above [2].

Relationship between compressive strengths and densities of core materials

Relationship between shear strengths and densities of core materials
The figures show that the properties of the core materials improve with increasing density. However, checking the weight of the core materials in the sandwich shows that other factors in addition to the density are involved. For example, a low-density foam core accounts for a small portion of the weight of a sandwich structure, but it absorbs a large amount of resin at the binding interfaces between the skin and the core because of its porous surface, and this increases the weight of the structure. The larger the pores are, the lower the foam density is, and the more serious the effect is. In contrast, for a honeycomb, this problem can be solved by painting an adhesive around the grid walls of the honeycomb to form a small adhesion gap, as shown in Fig. 2.5.

Two types of binding between skin and core
Finally, the shape of the core material must be considered, and it must completely match the component shape. Any mismatches and large gaps must be filled with adhesive, resulting in a considerable increase in weight, which can be prevented by using an appropriate core material. For example, small square pieces of core material can be placed on a light and loose fabric. A foam or balsa core with a loose fabric can be easily matched with curved surfaces. Slots can be cut in the back of core materials to form contours that match the components, achieving the same results as above. These core sheets need large quantities of adhesive to fill the gaps between square foam pieces to enhance the structural properties.
When the weight required for components is critical, thermo-formed core materials have to be considered. For example, linear PVC and SAN foams can be heated to above their softening points and prebent to match a mold. For a honeycomb core, a common method used to match the core material with curved surfaces is to stretch the honeycomb core by expansion. Different expanded forms can be made to meet the needs of various configurations.
2.2 Forming Processes
2.2.1 Hand Lay-up Processes
Hand lay-up processes are low-pressure contacting and forming processes. They are performed mainly by hand, and equipment and tools are only needed to complete auxiliary work. Hand lay-up is simple, easy to learn, and easy to grasp. The equipment used is simple, needs low investment, and is quickly started. The product size and shape are not limited. However, hand lay-up processes have the drawbacks of low efficiency, poor working conditions, and high labor intensity. The product quality relies greatly on the worker’s operational skill and is difficult to control. The product structure is inferior to those of products obtained using other techniques. Nevertheless, the hand lay-up process is still irreplaceable, especially for small quantities, and large or complex-shaped GFRP products. A large proportion of GFRP products are produced using hand lay-up processes. Most medium and small GFRP mills focus on production using hand lay-up processes. For large-lot producers, it is difficult to replace this process.
Because of the strong relationship between product quality and the worker’s operational skill, much effort is expended on operator training and operating procedures and methods. All the details of the impact on product quality must be understood to produce reliable and stable products.
2.2.1.1 Materials
-
(1)
Reinforcing materials
The main reinforcing materials used in hand lay-up processes are glass-fiber plaid, cloth, chopped strand mats, and chopped fibers. Other types of fiber fabric can also be used, depending on demand.
These reinforcing materials must be suitable for use in molds and set in surfaces without folds.
Tables 2.2 and 2.3 list the performance requirements of reinforcing materials used in hand lay-up processes.
Plaid is the main reinforcement used in hand lay-up processes. The advantages of this material are good shape variability, easy resin infiltration, thickening efficiency, and high stiffness and strength. Chopped fiber-glass mat is mainly used for anti-cracking on both sides of GFRP structures or anti-corrosion layers of anti-corrosive structures. The product structure can also be enhanced using chopped fiber glass if high strength is not required. Chopped fiber-glass mat has good soaking properties, air bubbles are easily removed, it is conformal, construction is convenient, and it contains 60–80% rubber.
Surface mat is used on the outer layer of GFRP products. It has good soaking properties and good conformality and contains 90% rubber. It is also used to decorate the surface and improve the surface corrosion resistance of anti-aging materials.
Unidirectional cloth and GFRP cloth are used for local reinforcement.
Fiber roving or chopped fibers are sometimes used to fill local corners. Other types of fiber and fabric products can also be used to meet the structural performance requirements of products.
-
(2)
Resin systems
Several types of resin are used in resin systems, such as polyester resins, vinyl ester resins, phenolic resins, and furan resins. Polyester resins, vinyl ester resins, and epoxy resins are most commonly used. Phenolic resins are not generally used because of the need for pressure curing. In China, phenolic resins that can be cured under normal pressure are currently used in winding and hand laying. However, they are rarely used because of their instability. Because their manufacture produces toxins and pollutants, furan resins are not often used except for specific temperature- or corrosion-resistant applications.
The resin systems used in hand lay-up processes must have low viscosity, good immersion properties, be curable at room temperature and normal pressure, have low flow during curing, and the curing process must be non- or low-toxic. Polyester and vinyl ester resins are suitable, and Table 2.4 lists the properties of several polyester and vinyl ester resins. Gel-coating resins are also used as hand lay-up resins. Gel-coating resins are applied to product surfaces to decorate the surface and make it hard, corrosion resistant, and anti-aging.
-
(3)
Supplementary material
The supplementary materials used in hand lay-up processes are reactive materials that form curing systems with resins, and fillers that constitute functional systems with resins. For epoxy resins, the components of the curing system are curing agents (amine curing system) and catalysts (acid anhydride curing system). For polyester resins and vinyl ester resins, the curing system contains components such as initiators and promoters.
The supplementary materials that constitute functional systems with GFRPs include tougheners, thinners, defoamers, air cutoff agents, coloring agents, release agents, and fillers.
With the development of composite molding techniques and the composite materials industry, supplementary materials such as flexibilizers, thinners, defoamers, and air cutoff agents are being considered by resin manufacturers for use in resin production. Supplementary materials that can be used independently by composite manufacturers include fillers, colorants, flame retardants, and release agents.
Calcium carbonate, barium sulfate, silica, talc, diatomite, mica, asbestos, aluminum hydroxide, glass-fiber powder, and graphite are used as fillers. The properties of composites, such as reduced shrinkage rates, reduced stress during resin curing, improved mechanical properties, improved surface states, thixotropy, flame retardancy, heat resistance, electrical conductivity, and anti-aging, can be changed by using different fillers; the cost can also be reduced. Table 2.5 lists some filler types and functions.
2.2.1.2 Mold and Release
Molds are the main tools used in hand lay-up processes. An appropriate choice of mold material and mold structure design ensure product quality, reduce costs, and increase efficiency. They are important components in the hand lay-up process.
-
(1)
Mold material
Many types of mold material are used in hand lay-up processes. Different materials are used, depending on the situation. When choosing a mold, factors such as technology, economy, and feasibility should be considered. Mold manufacture should be simple, mold production and source materials should be cheap, and the quality of the mold must meet the product requirements. There are many mold materials, e.g., timber, paraffin, cement, metal, GFRPs, and clay. Table 2.6 compares the properties of various materials.
-
1.
Timber: The general requirements of timber for mold materials are uniform texture, non-section, and good stiffness. Wood molds are only used for large-scale, single products or small numbers of products. For large-volume products, wood molds can be used as mother molds.
-
2.
Paraffin: Paraffin molds are suitable for small dies, which are not demolded or difficult to demold.
-
3.
Cement: The characteristics of cement are high strength, low cost, and ease of manufacture. Generally, it is used in the manufacture of simple shapes and products with simple surface requirements. It can also be used as a mother mold material.
-
4.
Metal: Metal molds are made of steel. Large-scale and small products can be made using metal molds. Metal molds are suitable for manufacturing large quantities of products with high dimensional accuracy, and small products with rough surfaces. However, metal molds have the drawbacks of the high processing costs of steel, high weight, and long manufacturing cycles.
-
5.
Gypsum: Gypsum plaster can be used to manufacture products with small volumes and complex shapes. Low-intensity gypsum is used with cement to improve its strength.
-
6.
GFRPs: GFRP molds are suitable for small- and medium-volume production. They are made with the mother dies.
-
(2)
Release agents
Release agents for molds should be easy to use, non-corrosive to the mold, and have low adhesion with the resin. They should also be uniformly smooth, non-toxic to humans, cheap, easily manufactured, and safe and easy to use.
There are many types of release agent. Common types are thin, mixed, solution based, and oil–wax. Release agents for use with products with high-quality surface requirements can be bought from GFRP manufacturers.
Useful release agents include the following.
-
1.
Thin film: Films such as polyester, PVC, polyethylene, poly(vinyl alcohol) (PVA), and cellulose acetate films are used as release agents. The mold can be used after treating the surface with Vaseline or butter. Wrinkling or blanks must be prevented when using thin films.
-
2.
PVA. Formula (wt%): PVA 5–8, ethanol 35–60, water 65–35
Low-molecular weight and water-soluble PVA should be selected. A release agent containing a small amount of ethanol is easy to dry, but the solubility is poor and it is difficult to prepare a film of the agent. Ethanol is sometimes omitted. A uniform film can be obtained by adding 2wt% of a surfactant, e.g., a soft-soap powder, to the release agent. A smooth film can be obtained by adding 1% of succinic acid salt aerosol to the release agent. The addition of 0.1% silicon defoamer to the solution reduces air bubble formation during brushing. The addition of 4–5% glycerol promotes film formation and improves the film flexibility. Rusting of a metal surface can be prevented by adding 0.75% sodium benzoate. The addition of blue ink or Berlin blue prevents leakage. PVA used with wax gives a better effect.
-
3.
Release agents such as ointment and paraffin. Silicon ester (methyltriethoxysilane or its 50% toluene solution), HK-50 heat ointment, transformer oil, yellow oil, and Vaseline oil are used. Car polish wax, paraffin oil (5:95) solution, paraffin, asphalt and fuel, and other solutions are also used. These types of release agent are cheap, easily obtainable, and non-toxic.
-
(3)
Mold design and manufacture
A mold is the main piece of equipment in a hand lay-up process. The mold design and manufacture directly affect the product quality and cost. In mold design, the following requirements must be considered.
-
1.
Products must meet performance requirements for factors such as dimensional accuracy, surface roughness, and flatness.
-
2.
The mold must have sufficient strength and stiffness to withstand the load generated.
-
3.
Demolding must be easy, labor saving, and must not damage the product.
-
4.
Resin curing is exothermic; therefore, the mold must be heat resistant to prevent heat deformation.
-
5.
The materials must be lightweight, cheap, and easily obtainable.
Molds can be negative mode, positive mode, matched mode, or combination mode. The mold type is chosen based on surface requirements. When dimensional accuracy and surface roughness are required, the negative mode is chosen. The positive mode is used when dimensional accuracy and inner surface roughness are required. Matched mode is used when dimensional accuracy and roughness of both surfaces are required. Combination mode is used when the product has complex dimensions and demolding is difficult.
An FRP mold is the most commonly used tool in hand lay-up processes. It has advantages such as ease of design, ease of manufacture, high surface roughness, and high intensity and stiffness; it can be reused and is suitable for mass production.
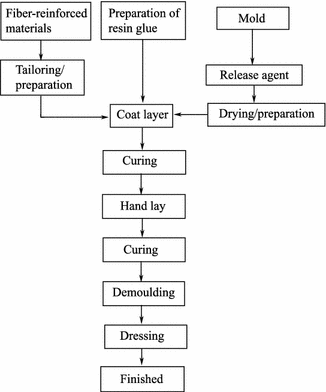
The following diagram shows the process for manufacturing a GFRP mold.

The mother mold is usually manufactured from wood, plaster, or cement. The mother mold is directly used if possible. The dimensional accuracy and surface roughness of the mother mold are the most important points. When a GFRP mold is being made from the mother mold, it is necessary to control spraying of the coating and to ensure that there are no bubbles in chopped strand mats and surface mats and that impregnation is complete. The quality of the forming mold not only affects the dimensional accuracy and surface roughness but also determines the service life of the mold.
2.2.1.3 Processes
-
(1)
Production process
The following diagram shows the hand lay-up process.
-
(2)
Tools for hand lay-up
The tools used in hand lay-up are important for increasing productivity and ensuring product quality.
-
1.
Spray gun: A spray gun is used for spraying a gel coating on the surface layer. Specific spray guns are commercially available. A spray gun with spray nozzles of various dimensions enables use of liquids of different viscosities.
-
2.
Wool roller: A wool roller is used to impregnate and coat resin during the hand lay-up process; 4-inch, 6-inch, and 8-inch wool rollers are available.
-
3.
Bristle roller: A bristle roller is used to drive out air bubbles. Rollers with bristles of the following sizes are available: ϕ 20 mm and 50 mm; length 50–150 mm.
-
4.
Spiral roller: Spiral rollers are made of aluminum, steel, or hard plastic. They have a spiral groove on the surface circumference. A spiral roller is used to drive out bubbles and form a uniform resin by rolling the surface layer.
-
5.
Scraper: Scrapers are generally made of polyethylene or glass plate of thickness 3 mm. They are used to drive out bubbles and form a uniform resin with high efficiency.
A number of other power tools such as angle grinders, electric drills, polishing and cutting machines are used for cutting cloth conference.

-
(3)
Quality control
A hand lay-up operation is completed by hand, even if power tools are available. The key factors in quality control during hand lay-up processes are standardization of operations, the quantity of material, the complexity of the composition decomposition during operations, and operational simplicity.
-
1.
Selection and preparation of materials: Raw materials of a certain size and quality must be obtained from manufacturers. The raw materials should not be changed frequently because there are differences among materials supplied by different manufacturers. Differences among resins are obvious. Replacement of a specific grade of resin may lead to changes in curing.
Environmentally friendly raw materials should be used. Humidity affects the moisture content of fibers for reinforcing materials. A large moisture content affects the quality of impregnation. Reinforcing materials should be stored under dry conditions and dried before use. Resins should be stored at constant temperature. This controls the stability of the resin system during application.
-
2.
Dealing with mold. The internal properties of the mold, such as size and surface roughness, should be considered and controlled during production processes. Dealing with the release agent on the product surface is important in terms of product quality and die life. The release agent coating affects the product surface and mold release. Uneven coating or leakage of the release agent coating affects the surface quality of the product. An increase in the release force can potentially damage the product or mold surface. A mold release force that is too high shortens the service life of the mold.
-
3.
Layer structure: A symmetric layer prevents deformation. Generally, the distribution of hand-lay products from the inside out is SM + GM + n (RC + GM) + GM + SM, or SM + GM + nRC + GM + SM (SM: surface mat; GM: chopped strand mat; RC: plaid). Unless the middle enhanced layer (RC) is sufficient, we cannot simplify the outer surface layer of GM and SM.
-
4.
Control of resin volume: The amount of resin between layers must be controlled as follows: surface of mat 90%; chopped strand mat 70%; plaid 50%. Two layers of glue can be used according to the following equation:
$$ w_{\text{total}} = w_{\text{layer}} + w_{\text{roller}} + w_{\text{other}} $$- w total :
-
is the volume of the total plastic layer;
- w layer :
-
is the actual volume of resin in the layer;
\( w_{\text{layer}} = w_{\text{r}} w_{\text{g}} /(1 - w_{\text{r}} ); \)
- w r :
-
is the amount of resin with standard requirements;
- w g :
-
is the total weight of enhanced material;
- w roller :
-
is the volume of resin on the roller;
- w other :
-
is the amount of resin lost for other reasons.
-
5.
Specification: The operations performed by workers should be standardized and must not vary from person to person. Glue containers, stirring tools, mixing methods, and the number of steps in resin stirring and impregnation should all be standardized.
-
6.
Environmental control: The environmental humidity and temperature greatly affect the product quality because they affect factors such as the amount of resin, impregnation quality, and bubble content. The humidity and temperature must be controlled in a stable range.
-
7.
Demolding: Demolding should be taken into account in mold design. The quality of demolding affects the product quality.
-
8.
Curing: The curing quality affects the structure performance and demolding of the product. Generally, hand-lay processes use room-temperature resin curing. Cured products are not completely produced in a natural environment because temperature changes in the natural environment affect the curing properties. A stable curing environment must be created.
2.2.2 Injection Molding Techniques
In injection molding, resin and fibers are simultaneously sprayed into a mold, using a spray gun, to make an FRP. A spray gun is the main equipment used in injection molding. The specific characteristic of this method is that a cutter is installed on the spray gun. The cutter is used in combination with resin spraying to cut continuous fibers into the required short fibers. The gun then injects the fibers into dies together with the resin. Injection molding is a development of hand lay-up and is a semi-mechanized hand-lay method. Its advantages are as follows.
-
1.
It can reduce the cost of materials by using roving cloth instead of glass cloth.
-
2.
The method has a high degree of mechanization and production efficiency (two to four times that of hand-lay processes) and is suitable for large-scale GFRP products.
-
3.
There are no ride joints, and products are better overall.
-
4.
Flash, cut, and loss of glue are reduced.
The disadvantages of injection molding include high resin contents, on-site dust, and the need for isolated operations. Injection molding can also be used in combination with other processes, bringing their respective advantages into play. For example, injection molding is combined with a hand-lay process to make tapetum structures, followed by spreading glass cloth by hand and foam removal, completely eliminating the coating operation. In the production of pipeline and storage tanks, a winding process is combined with a lining molding injection method to increase the degree of mechanization, to improve the production efficiency, quality, and stability. The injection molding has an almost irreplaceable role in manufacturing large molded products such as ships.
2.2.2.1 Materials
The only raw materials used in injection molding are continuous-fiber roving and the injecting resin, as determined by the technological features.
-
(1)
Continuous-fiber roving
Continuous winding fiber roving in injection molding is different from fiber roving in winding and pultrusion processes. The characteristics of continuous-fiber injection are as follows.
-
1.
A good cutting performance, and less generation of static electricity during cutting. To achieve a good cutting performance, coupling agents such as silane and organic chromium compounds are often used.
-
2.
After roving has been cut off, the decentralization efficiency should be high; usually greater than 90% is required.
-
3.
The original wire should give an excellent lodging performance after being cut off and should cover every corner of the mold without tilting.
-
4.
Dipping is fast, and an easily used drive roller expels bubbles.
-
(2)
Injection resin
The injection process characteristics are fast curing of the sprayed resin system, fast dipping, few air bubbles, ease of bubble expulsion, and easy lodging when mixed with chopped fibers. The main resins used for injection molding are polyester and vinyl ester resins. During injection, mixing occurs in the spray gun or spray nozzle. There is no mixing time, unlike in other techniques, and gelatinizing and lying, which are needed in hand lay-up, are unnecessary, which also saves time. The ratio of curing larger, the product can be solidified faster. Hyrizon resin, developed in the USA, consists of a polyester resin and isocyanate resin. It is used for injection molding and gives a good lodging performance, with almost no need for additional operations for foam removal, which greatly increases the production efficiency. The performance of GFRPs obtained after curing is better than that of polyester resin. Before use, the resin is a mixture of two components, A and B. A is a mixture of isocyanate and styrene, and B is a polyester resin mixed with an esterification catalyst. During injection, the two components are mixed in the spray gun; cross-linking occurs between the polyester resin and a benzene–ethylene mixture, and isocyanate is esterified by mixing with the esterification catalyst. The two reaction products mix with each other to form entangled polymer composite materials. The cured product has the strength of a polyester resin and the stiffness, toughness, and water resistance of polyisocyanate urethane.
2.2.2.2 Injection Molding Equipment
The injection molding process is almost completely performed using equipment, unlike hand lay-up processes. The process parameters are determined by the equipment, e.g., the group distribution ratio, mixture quality, length of short fibers, and uniformity of amount of resin. These factors improve the stability and efficiency of production and decrease the influence of operational factors.
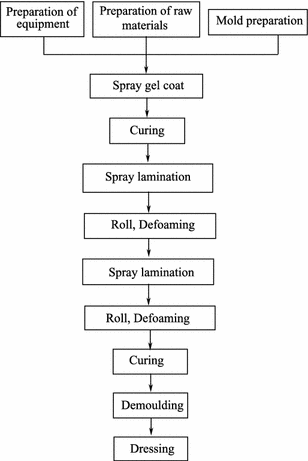
Figure 2.6 shows a schematic diagram of spraying equipment. To increase productivity and reduce wear and tear, the structure of the mobile trolley, and height, ventilation, temperature control, and energy-saving factors should also be considered in equipment design.

Schematic diagram of spray forming
-
(1)
Types of equipment
Sub-jet methods use compressed air jets and non-compressed air jets. Delivery points are pressure tank and pump-type conveyors.
-
1.
Pump jet (Fig. 2.7): The resin, initiator, and promoter are each transferred to a static mixer pump and then emitted by the gun after being fully mixed. This method is called mixing within the gun. The gun components are a pneumatic control system, resin pump, auxiliary pump, mixer, spray gun, and jet fiber cutter. The resin pump and auxiliary pump are connected by a rigid arm with regulation of the arm’s position. The proportions of ingredients are accurate. Resins and additives, which are evenly mixed in the mixer under compressed air, are formed into droplets by the spray gun, and then the mixture with the treated fibers is sprayed on the mold surface.
Fig. 2.7 
Schematic diagram of pump jet 1—resin pump; 2, 3—auxiliary pump; 4, 5—auxiliary tank; 6—resin tank; 7—cylinder; 8—buffer; 9—mixed gas; 10—spray gun; 11—fiber cutters; 12—yarn emission
This type of jet with only one glue gun has the advantages of a simple structure, low weight, and less initiator waste. Because the raw materials are mixed in the gun, it has to be cleaned immediately to prevent injection plugging.
-
2.
Tank pressure jet (Fig. 2.8): Resin glues are individually stored in a pressure tank and then sprayed by the gas pressure through the spray gun. The system consists of two tanks, piping, valves, a spray gun, and a fiber-cutting jet. Resin and glass fibers are continuously emitted by the spray gun and then go through a vertical aerosol, fiber dispersion, and even mixing and then fall to the die.
Fig. 2.8 
Schematic diagram of tank pressure jet 1—gas–water separator; 2—gas valve; 3—adjusting switch; 4—release valve; 5—adjusting valve; 6, 7—pressure tank; 8—safety valve; 9, 10—adjusting switch; 11—fiber cutter; 12, 13—resin injector
Resin mixing outside the spray gun reduces spray nozzle plugging.


-
(2)
Auxiliary equipment
Auxiliary equipment is needed in injection molding to ensure product quality, personal safety, and environmental protection. Figure 2.9 shows the injection molding equipment and layout.

Spray-forming equipment layout
2.2.2.3 Spray Process
-
(1)
Process

-
(2)
Control of process parameters
-
1.
Environmental temperature: The environmental temperature for injection molding is 15–35 °C, and the recommended temperature range is (25 ± 5) °C. Fast resin curing at excessively high temperatures can lead to system blocking or curing stress inequality. Low temperatures lead to low viscosity, slow curing, and resin facade flow.
-
2.
Resin content requirements: The resin content for injection molding should be about 60%. At a low volume of resin, fiber dipping is incomplete and the bending strength of the resin as an adhesive is not strong enough.
-
3.
Spray pressure and tank pressure: These two parameters affect the mixture uniformity and resin content. The resin content in injection molding is about 60%, the spray pressure is 0.3–0.35 MPa, and the resin tank pressure is about 0.05 MPa.
-
4.
Spray angle: The mixing degree of two resins with different components mixed outside the point of the spray depends on the angle of the spray gun. Generally, the spray gun angle is 20°. The distance between the nozzle and the mold surface is 350–400 mm.
-
5.
Plot-level number: If the thickness is high, the product structure should be formed at various times. Generally, the single-layer thickness is less than 1–3 mm. If the laminated layer is thick, compaction will be not easy, with the exclusion of bubbles, and this may result in resin flow. If it is too thin, the production efficiency is low.
-
6.
Flatness control: Injection molding is performed with a handheld spray gun, while the mold is moving. The thickness of the sprayed layer depends on the moving speed. The degree of overlap determines the lamination uniformity. The initial distance between the two jet trajectories can be determined as d = (width + thickness)/2.
To sum up, injection molding process parameters can summarized as follows:
-
pressure of resin tank 0.05 MPa;
-
resin spray pressure 0.3–0.35 MPa;
-
jet diameter 3.5 mm;
-
angle between nozzle of resin spray gun 20°; length of cut glass fibers 40 mm;
-
glass-fiber content 30–40%;
-
distance between spray nozzle and forming surface 300–400 mm.
-
2.2.3 Compression Molding Techniques
In compression molding, a material (powder, particles, or fibers) is placed in a metal die and then cured at a certain temperature and pressure to give a desired product. During compression molding, a certain temperature and pressure are needed to make the material plastic or molten, so that it can fill the metal die. Curing occurs under certain conditions. During flow of the compressed material, both the resin and reinforcing material are flowing, therefore a higher molding pressure is applied. Hydraulic pressure machines that can accurately control the pressure and metal dies of high-strength/high-precision/high-temperature resistance are needed [3].
-
(1)
Characteristics of compression molding
Compression molding was first used industrially in 1909. The technique developed rapidly with the invention of new molding compounds such as sheet-molding compounds (SMCs) and bulk-molding compounds (BMCs). The merits of compression molding include good repetition, easy operation, a good operating environment, easy flow of mold products/wide temperature and pressure ranges, molding of sheet products, good surface quality, and high production efficiency. The drawbacks of compression molding are complicated manufacture of metal dies, higher investment, and the restrictions of hydraulic pressure machines [4].
Developments in metal-machining techniques, hydraulic pressure machine technology, and methods for resin synthesis, increases in press tonnage and table size, and decreased molding temperatures and pressures have led to the large-scale use of compression molding. Compression molding is now used to mold large products such as auto parts, tubs, and toilets.
-
(2)
Categories of compression molding techniques
Compression molding techniques can be divided into various categories based on the types of reinforcing and molding materials.
-
1.
Fiber-reinforced material molding: In this method, a material prepreg is placed in metal dies at a certain temperature and pressure and molded into composite products.
-
2.
Scrap material molding: In this method, textile prepregs are cut into scrap and placed in metal dies at a certain temperature and pressure, and the scrap is molded into composite products.
-
3.
Textile material molding: In this method, textile prepregs [two-dimensional (2D) or three-dimensional (3D)] are placed in metal dies at a certain temperature and pressure and molded into composite products.
-
4.
Laminated molding: In this method, textile prepregs are cut into desired shapes and placed in metal dies at a certain temperature and pressure and molded into composite products.
-
5.
Winding molding: This method uses a special winding machine to provide a tensile force and temperature. A prepreg fiber/belt is wound into a core mold and then placed in metal dies and molded into products.
-
6.
BMC/dough-molding compound (DMC): In this method, a thickener, initiator, filler, internal release agent, and pigment are mixed into a paste and milled with short fibers. The mixture is placed in metal dies and molded into products at a certain temperature and pressure.
-
7.
SMC: In this method, the SMC is placed in metal dies and molded into products at a certain temperature and pressure.
-
8.
Preform molding: In this method, glass fibers are formed into products and placed in metal dies. Resin is then injected, and the mixture is molded into products.
-
9.
Directional lay molding: In this method, directional prepregs are placed along the direction of major stress and molded into products.
-
(3)
Development of compression molding techniques
Compression molding techniques were first used in the twentieth century, and the products were mainly based on phenolic resin filled with wood flour and quartz powder. Two other resins, namely melamine–formaldehyde and uea–formaldehyde, were then used. However, these resins have various shortcomings, e.g., they are difficult to machine and mold, and give poor performances, which influenced the development of this type of molding compound. Molding compounds based on unsaturated polyester resins appeared in the 1950s. This type of molding compound avoids the problems encountered with phenolic and uea–formaldehyde resins. In the UK, they were referred to as DMCs. DMCs are easily molded, low cost, easily pigmented, and give good electrical performances. However, as production techniques and applications for DMCs were developed, the disadvantages of DMCs such as feed problems and poor mechanical properties became apparent. It took 20 years to overcome the disadvantages of DMCs. In the 1970s, modified DMCs, known as BMCs, were introduced. The SPI definition of a BMC is a DMC that shows low shrinkage and chemical thickening. SMCs, which can solve problems such as low production efficiency and poor mechanical properties, appeared in the 1960 in the Federal Republic of Germany. SMCs are more suitable than DMCs and BMCs for use with large molds and provide complex products with good mechanical properties.
2.2.4 Other Forming Processes
2.2.4.1 Filament Winding
In filament winding, which is a resin matrix composite fabrication technique, continuous fibers are wound onto a mandrel according to an established form after impregnation with a colloid and then solidified into specific shapes at a certain temperature. The continuous fibers can be impregnated beforehand and stored until winding onto the mandrel, or wound onto the mandrel and made into products directly after impregnation, or impregnated and continuously wound onto the mandrel after a liquid glue has been formed by primary cross-linking by passing through baking equipment. The first process is dry forming, the second is wet forming, and the third is semi-dry forming. Each of these methods has its own characteristics. Wet forming is most widely used [5].
Products made by filament winding make full use of the features of composites and give the optimum required structures. For example, the axial/ring direction internal force ratio of a cylindrical pressure vessel is 1:2. If the vessel is made from a metal, the structural strength is the same in all directions, but in terms of the required ring direction strength, half of the axial strength is redundant. By varying the winding angle (the angle between the filaments and the generatrix), the filament-winding process can be used to make the ring strength of the vessel double the axial one, therefore the product has the optimum properties, and redundant material consumption is avoided. Furthermore, the fibers are continuous and strained, therefore the fiber strength is better than that of fabric fibers (lamination technique and hand lay-up technique), and short cut fibers (products made of short cut fibers by injection). The fiber content can be up to 80%, whereas for other composite fabrication techniques, such as mold pressing, hand lay-up, and injection, a maximum of 60% is achieved. The composite strength comes mainly from the fibers, so the higher the fiber content is, the higher the product structural strength is.
Filament winding was inspired by the reinforcement of the tensile strengths of some structures through binding. It was first used as a fabrication technique in the 1950s, after the emergence of techniques for fiber enhancement of composites. It is a high-level mechanized technique for composite fabrication and has been widely used and rapidly developed since it first appeared. In the 1960s, it was used in almost every possible field. In the aerospace industry, because of their high specific strength, modulus, insulation, and ablation resistance, filament-wound composites are the best structural materials for applications such as rocket engine cases, nozzles, energy storage vessels, and antenna frames. They are also used to build large chemical storage tanks and pipelines for transporting liquids. In military applications, they are used as structural materials for rocket engine cases. In electrical equipment, they are used as high-voltage insulation products. In aviation, they are used to make radomes on high-speed aircraft.
For more than half a century, filament winding has been developed, improved, and matured. Raw material production has become industrialized and winding equipment, including devices making members with diameters of several millimeters, spot winding machines for making chemical storage tanks of diameter more than 20 m, and two-axes winding machines to multifunctional winding machines with dozens of axes have been developed. This is an advanced technique and its products are widely used in aviation, aerospace, national defense, and civil industries.
2.2.4.2 Pultrusion
Pultrusion is a technique for molding composite profiles. Continuous glass fibers and glass-fiber products such as continuous strand mats are pulled by a traction device through oriented devices, a paste groove, premold, and heated mold to form a continuous profile. The length depends on the product needs. The product is completed by a cutting device [6].
In pultrusion, a composite material is formed using the highest level of mechanization. Figure 2.10 shows a diagram of a typical pultrusion process.

Diagram of typical pultrusion process
Compared with steel manufacturing, pultrusion has greater flexibility and requires a smaller investment in equipment, and is used for the production of a larger number of products.
The pultrusion profile density is lower than that of aluminum. The profile has the advantages of high specific strength, a high modulus and corrosion resistance, no need for surface finishing, good insulating properties, stability during long-term use in the natural environment, high efficiency, a high degree of mechanization, and low production costs.
2.2.4.3 Resin Transfer Molding
In RTM, matched die molding is used to produce polymer composites. A thermosetting resin in a reactive liquid state and dry fibers are injected into a cavity under low pressure to discharge air from the cavity and wet the fibers [7]. When the resin appears at the air vent, this means that the mold cavity is full of resin and the curing stage begins. Products can be taken out until the resin reaches a specific strength. The entire process is shown in Fig. 2.11. Compared with other FRP-forming processes, RTM has the following advantages.

Schematic diagram of RTM
-
1.
Mold manufacture and material selection are flexible, and RTM has economic benefits if the product output is around 1000–20,000 pieces.
-
2.
Complex components with good surface quality and high dimensional accuracy can be made, and there are advantages in the manufacture of large-scale components.
-
3.
A partially enhanced sandwich structure can be easily obtained from molding components. Reinforced materials and layer structures can be designed.
-
4.
The fiber content is up to 60%.
-
5.
It is a closed-mold process, with clean working conditions and low-styrene emissions from the forming process; this is beneficial to the environment.
-
6.
It has a high degree of freedom in terms of mold design, and low tooling costs. FRP molds can be made using a low injection pressure, including epoxy molds, FRP molds with electroformed nickel surfaces, and aluminum molds.
2.2.4.4 Vacuum Bag Pressure Forming
Vacuum bag pressure forming is a depression shaping technique. The process is as follows. Depending on the design requirements, and mainly by hand, reinforced materials and resins (including preimmersed materials) are placed on a mold one by one until the specified thickness is achieved. The process is completed by pressurizing or evacuating, heating, solidifying, demolding, and truing. The difference between the four types of process and shaping by hand is solidification. They are simply an improvement of shaping by hand to improve the compactness and splicing intensity of products.
The advantages of bag pressure molding are that (1) both sides are smooth; (2) it can be used with polyester, epoxy, and phenolic resins; and (3) the product quality is higher than that of products shaped by hand.
-
(1)
Technique
There are two types of bag pressure molding, i.e., the pressure bag method and the vacuum bag method.
-
1.
Pressure bag method
-
(a)
Non-solidified products laid by hand are placed in a dracone, and then a cover is fixed on the dracone.
-
(b)
Air or steam is compressed (0.25–0.5 MPa) in the dracone to enable product solidification under hot-pressing conditions.
-
(a)
-
2.
Vacuum bag method
-
(a)
A vacuum bag is placed on the non-solidified product, laid by hand, to sandwich the product between the vacuum bag and mold.
-
(b)
The edges are sealed, and the system is evacuated (0.05–0.07 MPa) to remove blisters and volatile matter in the product. Because of the low vacuum pressure, this method can be used to shape polyester composites and epoxy composites.
-
(a)
Scrimping is a technique that combines a vacuum bag method and RTM. First, a reinforced layer is laid on a single mold. Secondly, the layer and mold are sealed in a vacuum bag. Thirdly, the layer is evacuated. Finally, the resin is injected into the layer. The advantages are good dipping, high speed, and compensation for undipped parts. The products have good consistency, smooth surfaces, and high fiber contents. The disadvantages are that the ancillary materials are expensive and not readily available.
-
(2)
Notes
-
1.
The molds used in the pressure bag method must be strong enough to withstand hot pressing and shaping, and external forces.
-
2.
The molds and rubber bag or vacuum bag should be examined carefully before use to prevent air leakage. The rubber bag and vacuum bag should not be corroded by the resin.
-
3.
In a vacuum bag method at low vacuum pressures, a drawing stick can be used to assist pressurizing to eliminate blisters.
-
(3)
Applications and development
High-performance composite products based on high-strength glass, carbon, boron, and aramid fibers, and ethoxy resins produced using pressure bag methods have been used in airplanes, missiles, satellites and space shuttles, e.g., in airplane ports, false ogives, radomes, base frames, wings, empennage, clapboard, wainscot, and stealth planes.
2.2.4.5 Winding Shaping
Winding shaping is a composite-shaping method. A preimpregnated fabric is placed on a hot-rolling machine. The hot roller in a pipe-coiling machine softens the fabric and then the resin on the fabric melts. Under a certain tension, the roller rolls the fabric up to the core barrel by the frictional force between the roller and the core mold until the required thickness is reached. Then, the fabric is cooled and shaped by a cool roller. Finally, the fabric is removed from the pipe-coiling machine and loaded in a curing oven to solidify. After solidification, the mandrel is removed.
2.2.4.6 Techniques for Preparing Sandwich Structures
A sandwich structure is a three-layered composite. The materials used in the first and third layers must have high tension and a high modulus [8]. These layers are called the panel and thin-gauge skin. A lighter material is used for the middle layer, which is called the core. The distance between the two thin-gauge skins enlarges the inertial moment of the section. This increases the bending rigidity and makes full use of the strengths of the materials. A composite sandwich structure consists of a composite and another lighter material. This structure increases the effective rate of utilization and decreases the weight.
Composites with GFRP honeycomb sandwich structures and GFRP foamed sandwich structures, which have good thermal stabilities and electrical properties, have been developed.
Composite sandwich structures include foam plastic sandwich structures, honeycomb sandwich structures, echelon form, orthogonal structure, and round sandwich structures.
2.3 Composite Properties and Testing
Composites are anisotropic materials, and their design and testing differ from those used for metals. The determination of material properties is important and basic information in material research, development, design, and applications [8,9,10,11,12,13]. Designers can obtain the property parameters of conventional materials from handbooks or the material specifications provided by manufacturers based on the material properties (or trademark) when selecting materials. Composites are considered to be structures rather than materials. The composite properties are relevant to many factors such as type of matrix reinforcement, material state manufacturing processes, interfacial conditions, and storage time and environment. Before design, the composite properties and their relationship to all factors must be known. However, property data for certain processing conditions are only the basis for raw material selection rather than all the necessary design data. At present, micromechanical results are only qualitative estimates because of their limitations. The property data needed for composite part design must be obtained by basic property testing; this is critically important in design.
Much research has been performed, and large amounts of test data have been accumulated. A series of specifications have been built, which lay the foundations for correctly evaluating material properties and determining the relationships between material properties and test conditions and the relevant factors that affect them.
Composite property testing is the crucial basis for selecting the material composition, and evaluating the reinforcements, matrix, interfacial properties and their compatibility, processing conditions, manufacturing techniques, and product design.
2.3.1 Mechanical and Physical Properties and Testing
Methods for determining the mechanical and physical properties of composites, and the data obtained, are widely used in practical engineering. Test methods are available for oriented fiber-reinforced composites and fabric-reinforced composites, according to the composite reinforcement and forming process. Material property data obtained from these tests form the basis for evaluating material systems, processing levels, and structural design. In addition, laminate properties can be determined theoretically from these basic data [8, 9].
2.3.1.1 Tests for Mechanical and Physical Properties
-
(1)
Property tests for unidirectional composites
According to the national standard GB 4550-84, Preparation of unidirectional orientated fiber reinforced plastic plates for test purposes, unidirectional FRP plates for testing are prepared by filament-winding and vacuum bag–autoclave processes. The elastic properties of unidirectional composites are determined based on the tensile, compressive properties at 0°, 90°, and 45°. The resin–fiber interfacial properties are determined by flexural and in-plane shear testing. Fiber composite plates for evaluating material properties must be machined to the required dimensions and amounts specified in GB 3354-82, GB3355-82, GB3356-82, GB3357-82, and GB3856-82.
-
1.
Specimen machining: Surface dust or impurities should be removed before the preparation of unidirectional fiber plates. The cutting direction and machining areas of specimens for tensile, compressive, and flexural tests at 0°, 90°, and 45° are marked on the plates using a special pencil. In addition, the amount of specimen and cut width should be taken into account, according to the national standard requirements. The specimen shape and dimensions are shown in Fig. 2.12 and Table 2.7. The flexural and interfacial shear specimen dimensions must meet the span:depth ratio requirements.
Fig. 2.12 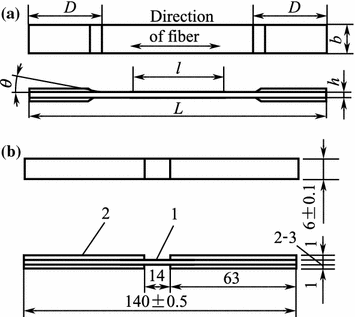
Unidirectional laminate specimen dimensions a tensile specimen: L—overall specimen length, mm; h—specimen thickness, mm; D—tab length, mm; b—specimen width, mm; l—gauge length, mm; θ—chamfered angle of tabs, mm. b compressive specimen: 1—specimen; 2—tabs
Table 2.7 Tensile specimen dimensions -
2.
Tab bonding: End tabs are made of cross-ply glass-fiber/resin laminates of thickness 2–3 mm or 1–3 mm aluminum laminates. If aluminum laminates are used for tabs, the tab surfaces are smoothed and roughened with sandpapers to eliminate oxidized layers, and heated at 65 °C in acid solution for 15 min. The tabs are cleaned with freshwater and then baked for 2 h to evaporate the water. The treated tab surfaces must not be touched by hands. The solution mass composition is sulfuric acid:distilled water:potassium dichromate = 10:30:1.
Before bonding the tabs, the specimen surfaces are smoothed with 100# abrasive paper. Dust is removed from the surfaces, and the mold release and grease are removed using ethyl acetate. The specimens are cleaned with acetone and dried. Tab slippage easily occurs during tensile tests because of the high tensile strength along the fiber direction of a unidirectional composite; therefore, a good adhesive is used. The mass ratios of the components are 618 epoxy:200# polyamide:diglycidyl ether:iminazole = 100:80:15:2. The adhesive is painted on the specimens and tabs, cured under contact pressure in the curing system at 60 °C for 2 h and then 120 °C for 8 h, and cooled. Tensile specimens for tests at 45° and 90° to the fiber direction use an adhesive cured at normal room temperature because of their low strength.
After the tabs have been cured, the exposed fibers on the test section surfaces are roughened. Grease is removed using acetone and ethyl acetate. Gauge marks are drawn. The strain gauge is bonded with 502 adhesive. It must be ensured that the bonding direction of the strain gauge is the same as that of the tested material. Specimen preparation is finished by adhesive curing.
-
3.
Tensile property testing. Specimens are tested along the fiber orientation (0°), perpendicular to the fiber orientation (90°), and at a 45° orientation; the tensile modulus of elasticity E Lt, E Tt, Poisson’s ratio V LT, V TL, tensile strength F Lt, F Tt, and the shear strength F Lt and modulus G LT are separately tested.
-
(a)
Tensile property testing along fiber orientation. The tensile properties at 0° depend on the fiber type, volume content, fiber straightness, and saturated resins. Two tabs are bonded perpendicularly in the middle of the effective length at 0° and 90° to the fiber direction after preparing the specimens. The width and thickness of the test specimen are measured at three points, and the average value is calculated. The measurement accuracy is verified in accordance with GB1446, and a specimen number is subsequently assigned. The strain gauge leads must be isolated from the measurement wires during welding. Carbon fibers are conductive; therefore, not only the leads themselves but also carbon composites should be separated and insulated. When placing the specimen in the grips of the testing machine, the long axis of the specimen and the grips must be aligned with an imaginary line, and then the measurement wire is joined to the strain indicator. To avoid the effects of temperature variations in practical tests, the strain gauge that is bonded to the specimen is made of the same material as the tested specimen and aligned with the strain indicator to form a semi-bridge. For determining the tensile modulus of elasticity, Poisson’s rate, elongation at break, and stress–strain curve, specimens of various grades are loaded, with break load differentials of 5–10% (at least five grades are used when determining the tensile modulus of elasticity and Poisson rate). The loads at different grades, the strain, the load at break, and the strain at break, are recorded. The tensile strength is calculated using Eq. (2.1):
$$ F_{\text{Lt}} = \frac{{P_{b} }}{bh} $$(2.1)where
- F Lt :
-
= tensile strength at 0°, MPa;
- b :
-
= specimen width, mm;
- P b :
-
= maximum load value at break, N;
- h :
-
= specimen thickness, mm.
The tensile modulus of elasticity is calculated using Eq. (2.2):
$$ E_{\text{Lt}} = \frac{\Delta P}{bh\Delta \varepsilon } $$(2.2)where
- E Lt :
-
= tensile modulus of elasticity, MPa;
- ΔP :
-
= increment in load of primary straight line in load–strain curve, N;
- Δε :
-
= strain increment corresponding to ΔP.
The Poisson rate is calculated using Eq. (2.3):
$$ V_{\text{Lt}} = \frac{{\varepsilon_{\text{T}} }}{{\varepsilon_{\text{L}} }} $$(2.3)where
- V Lt :
-
= Poisson rate;
- ε L :
-
= strain at 0° corresponding to ΔP;
- ε T :
-
= strain at 90° corresponding to ΔP.
-
(b)
Tensile property testing at 90°: The tensile properties in the 90° direction mainly depend on fiber infiltration and the fiber–resin interfacial properties. The specimen thickness must be carefully measured because of the low tensile strength in the 90° direction. The wires are welded, and the specimen is placed in the grips. The tensile strength in the 90° direction is determined using Eq. (2.4):
$$ F_{\text{Tt}} = \frac{{P_{\text{b}} }}{bh} $$(2.4)where
- F Tt :
-
= tensile strength at 90°, MPa;
- P b :
-
= maximum load at break, N.
The tensile modulus at 90° is calculated using Eq. (2.5):
$$ E_{\text{Tt}} = \frac{\Delta P}{bh\Delta \varepsilon } $$(2.5)where E Tt = tensile modulus at 90°, MPa.
-
(c)
Tensile property testing at 45°. The tensile properties at 45° depend mainly on the fiber–resin interfacial state, fiber infiltration, and resin properties. At a high stress, most composites show nonlinear behavior. Tensile property testing is commonly used to evaluate the fiber–resin interfacial properties. The fiber direction greatly affects the test results. In sampling, the specimen axis should be 45° to the fiber direction. The cross-shear strength is calculated using Eq. (2.6):
$$ F_{\text{Lt}} = \frac{{P_{\text{b}} }}{2bh} $$(2.6)where
- F Lt :
-
= cross-shear strength, MPa.
The cross-shear modulus is calculated using Eq. (2.7):
$$ G_{\text{Lt}} = \frac{\Delta P}{{2bh(\Delta \varepsilon_{\text{X}} - \Delta \varepsilon_{\text{Y}} )}} $$(2.7)where
- G Lt :
-
= cross-shear modulus, MPa;
- ΔP :
-
= selected load increment of straight line in load–strain curve, N;
- Δε X :
-
= strain increment on specimen axis corresponding to ΔP;
- Δε Y :
-
= strain increment perpendicular to specimen axis corresponding to ΔP.
-
(a)
-
4.
Compressive property testing. Composite tensile properties differ greatly from their compressive properties, unlike the case for metal materials. Generally, the compressive properties are much poorer than the tensile properties. The aim of compression testing is to determine the compressive strength, compressive modulus of elasticity, and Poisson’s ratio in the 0° and 90° directions for unidirectional composites.
-
(a)
Compressive property testing along the fiber orientation. Compressive property testing of unidirectional composites is difficult because of the requirements for factors such as specimen thickness, gauge length, and tab width. To induce compression rupture rather than buckling breakage, special testing jigs are used and the requirements for the gauge length are high (Fig. 2.13). To prevent slippage between the specimens and metal jigs, the tabs must be long enough to resist the test load when the test specimen is being placed in the jig; the specimen is first placed in the wedges, the outer clamps are put in place, and then the sleeves are fitted. Preloaded washers in the sleeve windows are used to prevent wedge slippage and provide easy connection to the strain wires. After clamping, the specimen is placed in the testing machine and focused on the center. Preloading ensures that the jigs can completely clamp the specimen and enable the sleeve to move freely. The preloaded washers are unloaded and removed. The compressive modulus and Poisson’s ratio are determined using specimens of more than five grades, with breakage load differentials of 5–10%. A uniform load is applied during the test until the specimen breaks. The stress–strain and breakage load for different grades are recorded. The compressive strength is determined using Eq. (2.8):
Fig. 2.13 
Test jigs for compressive properties 1—sleeve; 2—preloaded washer; 3—clamp; 4—wedge; 5—specimen
$$ F_{\text{LC}} = \frac{{P_{\text{b}} }}{bh} $$(2.8)where
- F LC :
-
= compressive strength in 0° direction, MPa.
The compressive modulus of elasticity is determined using Eq. (2.9):
$$ E_{\text{LC}} = \frac{\Delta P}{bh\Delta \varepsilon } $$(2.9)where
- E LC :
-
= compressive modulus of elasticity, MPa;
- ΔP :
-
= load increment, N;
- Δε :
-
= strain increment corresponding to ΔP.
If there is no onset straight line on the stress–strain curve, the onset tangent modulus or secant modulus is taken as the elastic modulus.
Poisson’s ratio is calculated using Eq. (2.10):
$$ U_{\text{LC}} = \frac{{\varepsilon_{\text{T}} }}{{\varepsilon_{\text{L}} }} $$(2.10)where
- U LC :
-
= Poisson’s ratio in the compression test.
-
(b)
Compressive property testing in 90° direction. When preparing specimens with an orientation perpendicular to the fiber orientation for testing compressive properties, welding and jigging should be performed carefully to prevent breakage during installment because of the very low strength of such specimens. A uniform load should be applied. The compressive strength in the 90° direction is calculated using Eq. (2.11):
$$ F_{\text{TC}} = \frac{{P_{\text{b}} }}{bh} $$(2.11)where
- F TC :
-
= compressive strength perpendicular to fiber direction, MPa.
The compressive modulus of elasticity in the 90° direction is calculated using Eq. (2.12):
$$ E_{\text{TC}} = \frac{\Delta P}{bh\Delta \varepsilon } $$(2.12)where
- ETC:
-
= compressive modulus of elasticity perpendicular to the fiber direction, MPa.
If there is no onset straight line, the onset tangent modulus or secant modulus is taken as the elastic modulus.
-
(a)
-
5.
Flexural property testing. Flexural property test methods using three-point and four-point loadings on a simple supported beam are used to determine the flexural strength, flexural modulus of elasticity, and load–deflection curve of unidirectional FRP plates to assist material choice and for quality control. China national standard GB3356-82 uses a three-point bending system with a simple supported beam. The tensile modulus of composite elasticity usually differs from the compressive modulus, which results in the non-duplication of a neutral axis and geometric center and double modulus laminar beam, so this must be taken into account.
-
(a)
Three-point bending method on simple supported beam. A bar specimen with the shape and dimensions shown in Fig. 2.14 is used to ensure that tensile or compressive break occurs at the outer fiber layer under the flexural load. The recommended span:depth ratio is l/h = 16, 32, and 40; l/h = 16 ± 1 is suitable for GFRPs; l/h = 32 ± 1 is suitable for carbon-fiber-reinforced plastics because of the high flexural modulus; and l/h = 32 ± 1 or 40 ± 1 is used for aramid-fiber-reinforced composites to ensure flexural break, rather than interlaminar shear break, because of the low interfacial shear strength and the flexural modulus, which is higher than those of glass-fiber composites. The loading noses and fillet radius of the supports should conform to the national standard. In the tests, loads of various grades are used, with a break load differential of 5–10%, to determine the flexural modulus of elasticity or load–deflection curve. The loadings at different levels and relative deflections are recorded separately. The flexural strength is determined by applying successive loads until the specimen breaks. If interlaminar shear break occurs or the break area exceeds one-third of the support span, the specimen is not accepted. At least five effective specimens should be tested. The flexural strength is calculated using Eq. (2.13):
Fig. 2.14 
Shape and dimensions of specimen for three-point bending L—specimen length; l—specimen span; h—specimen thickness; b—specimen width
$$ \sigma_{\text{f}} = \frac{{3P_{\text{b}} l}}{{2bh^{2} }} $$(2.13)where
- σ f :
-
= flexural strength, MPa;
- l :
-
= flexural span, mm.
The flexural modulus of elasticity is calculated using Eq. (2.14):
$$ E_{\text{f}} = \frac{{\Delta Pl^{3} }}{{4bh^{3} \Delta f}} $$(2.14)where
- E f :
-
= flexural modulus of elasticity, MPa;
- ΔP :
-
= load increment on straight line on the load–deflection curve, N;
- Δf :
-
= midspan deflection corresponding to ΔP, mm.
-
(b)
Simple supported beam four-point bending test.
The four-point bending test method is shown in Fig. 2.15. Unlike the three-point bending test using a simple supported beam, the working length in the four-point bending test is determined by the real bending load, and the maximum bending load is applied to an area of the span rather than a point; this ensures that the specimen breaks in the maximum stress area. The loading changes from one point in the three-point bending test to two points, which reduces local bearing stress and avoids bearing break. A specimen with high bending strength must have large dimensions for use in the four-point bending test. In addition, the jigs are more complex than those for the three-point bending test. The flexural strength in the four-point bending test is calculated using Eq. (2.15):
Fig. 2.15 
Four-point bending test using simple supported beam
$$ \sigma_{\text{f}} = \frac{{3P_{\text{b}} L}}{{4bh^{2} }} $$(2.15)where
- σ f :
-
= flexural strength, MPa;
- L :
-
= support span of four-point bending, mm;
- P b :
-
= break load at the loading point, N;
- b :
-
= specimen width, mm;
- h :
-
= specimen thickness, mm.
The flexural modulus of elasticity is calculated using Eq. (2.16):
$$ E_{\text{f}} = \frac{{0.17\,\Delta PL^{3} }}{{\Delta fbh^{3} }} $$(2.16)where
- E f :
-
= flexural modulus of elasticity, MPa;
- ΔP :
-
= load increment, N;
- Δf :
-
= deflection increment corresponding to ΔP;
- L :
-
= support span in four-point bending.
-
(a)
-
6.
Interlaminar shear property testing: Interfacial shear strength tests are used to evaluate the interfacial properties of fibers and resins to assist material choice and for product quality control. The national standard GB 3357-82, Test methods of the interfacial shear strength for unidirectional fiber reinforced plastics, specifies use of the short-beam method to test the interfacial shear strengths of unidirectional FRP plates.
A bar specimen is used in the test. The specimen shape and dimension are shown in Fig. 2.16; specimen thickness h = 2–5 mm, specified support span l = 5 h. Because of the small support span, more care must be taken when choosing the span:depth ratio. The loading nose radius and support fillet radius must conform to the national standard to prevent bearing break of the specimen during the test. For effective specimens, the ratio is not less than 10. The interfacial shear strength is calculated using Eq. (2.17):
Fig. 2.16 
Specimen shape and dimensions for interfacial shear strength tests L—specimen length; l—support span; h—specimen thickness; b—specimen width
$$ \tau_{\text{s}} = \frac{{3P_{\text{b}} }}{4bh} $$(2.17)where
- τ s :
-
= interfacial shear strength, MPa;
- P b :
-
= maximum load at shear break, N.
-
7.
Property testing using NOL ring: Composite property testing using an NOL ring is closely related to fiber-winding techniques. A ring specimen was first used at the US Naval Ordnance Laboratory and is therefore called an NOL ring. Netting theory is used to design filament-wound high-pressure tanks and solid motor cases. Netting theory neglects the matrix rigidity, and the fiber bears all the loads; this is the basis of the NOL ring testing method.
An NOL ring specimen is usually filament wound using a specific small winding machine. There are two methods for NOL ring fabrication. In one method, a single ring is wound using a specific tool assembly; in the other, a shell is wound first and then cut into rings. The outer surface can be machined or non-machined. A machined ring has high strength and a low discrete factor. A non-machined ring with a rough surface has a high resin content and relatively high dimensional tolerance. The strength of a ring cut from a shell is lower than that of a single ring because some continuous fibers are broken when the ring is cut from the shell, and this reduces the bearing load of the ring. A single ring is therefore usually used in practical tests. The ring properties are affected by factors such as the winding tension, curing system, water content of the fibers, surface state of the fibers, and the resin system.
-
(a)
Tensile property testing using NOL rings. Tensile property testing using NOL rings, which is easier than unidirectional plate tests, is performed using specific jigs; the jig types are shown in Fig. 2.17. Two half disks are assembled, and the NOL ring is placed in the circle groove. The test method can be used to determine the tensile strength and tensile modulus of the ring specimen along the fiber orientation, enabling calculation of the fiber tensile strength. The tensile strength of an NOL ring is calculated using Eq. (2.18):
Fig. 2.17 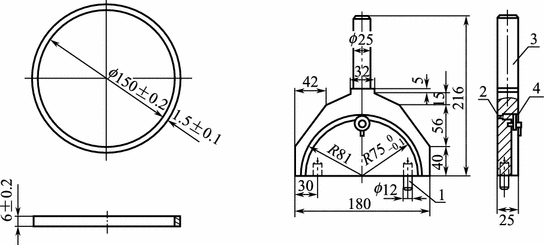
Jigs for NOL ring tensile test 1—positioning pin; 2—access hole; 3—disk; 4—closure cam
$$ F_{\text{Lt}} = \frac{{P_{\text{b}} }}{2bh} $$(2.18)where
- F Lt :
-
= tensile strength of NOL ring, MPa;
- P b :
-
= tensile load at break of NOL ring, N;
- b :
-
= specimen width, mm;
- h :
-
= specimen thickness, mm.
The fiber strength is calculated using Eq. (2.19):
$$ F_{\text{f}} = \frac{{P_{\text{b}} }}{{2bhV_{\text{f}} }} $$(2.19)where
- F f :
-
= average tensile strength of fibers in ring, MPa;
- V f :
-
= volume content of fibers, %.
A strain gauge is bonded along the fiber direction on the ring for determining the tensile modulus. The tensile modulus is calculated using Eq. (2.20):
$$ E_{\text{Lt}} = \frac{\Delta P}{2bh\Delta \varepsilon } $$(2.20)where the symbols definitions are the same as those in Eq. (2.2).
Although fabrication of NOL ring specimens is easy, they are only used for testing properties along the fiber direction, and extra bending during the test cannot be excluded.
-
(b)
Interlaminar shear strength testing using NOL rings. Small-arc specimens cut from a ring specimen are used in the three-point bending test to determine the interfacial shear strength. The specimen shape and dimensions, and jigs are shown in Fig. 2.18 and 2.19, respectively. The support span should be such that the specimen can extend freely but the supporting position does not change. The loading nose radius is 3 mm. The interfacial shear strength is calculated using Eq. (2.17).
Fig. 2.18 
Specimen shape and dimensions for shear test
Fig. 2.19 
Jigs for shear test 1—base; 2—nut for fastening bearing; 3—key; 4—loading bar; 5—sliding groove to ensure loading direction; 6—sliding bearing of support; 7—sliding support; 8—positioning pin for support span; 9—specimen
-
(a)


-
(2)
Test methods for glass-fiber fabric or short glass-fiber composites
The properties and preparation methods for glass-fiber-fabric-reinforced composite plates and those for short-glass-fiber composites are different. Directional fiber composite plates have orthotropic properties, so they have high strength along the fiber direction and very low strength perpendicular to the fiber; therefore, a specimen shape that keeps the fiber consistency is needed. Filament-winding or vacuum bag–autoclave techniques are usually used to prepare oriented FRPs. It is difficult to machine thick specimens because of the high break load and hard grip. Hand lay-up, RTM, and pressure molding are usually used to prepare fabric-reinforced plates and short-glass-fiber-reinforced plates. Machining thick specimens is not difficult. The specimen shape, dimensions, and test methods are different from those for directional fiber-reinforced composite plates because the fibers are uniform in two directions, so differences are smaller.
-
1.
Methods for testing tensile properties of glass-fiber-fabric-reinforced plates and short-glass-fiber-reinforced plates: National standard GB1447-82 stipulates that three specimen types can be used to test glass-fiber-fabric-reinforced plates and short-glass-fiber-reinforced plates. Specimen dimensions are shown in Fig. 2.20, Tables 2.8, and 2.9. Specimens of type I are used for glass-fiber-fabric-reinforced thermoplastics and reset composite plates; type II specimens are used for glass-fiber-fabric-reinforced thermosetting composites; type III specimens are used to test the tensile strength of molded short-glass-fiber-reinforced composite plates. Type I or type II specimens are used in other tensile tests. In the machining of type I specimens, there must be a smooth transition between the gauge length and grip areas to prevent specimen breakage in these areas. Specific jigs are used for type III specimens. At least five specimens are tested for each sample, regardless of the specimen type. The tensile strength, tensile modulus, and Poisson’s ratio are calculated using Eqs. (2.1)–(2.3).
Fig. 2.20 
Specimen shapes and dimensions
Table 2.8 Type I and II specimen dimensions (mm) Table 2.9 Type I and II specimen dimensions (mm) -
2.
Methods for testing compressive properties of glass-fiber-reinforced composite plates and short-glass-fiber-reinforced composite plates: National standard GB1448-83 stipulates two types of specimen for testing the compressive properties of glass-fiber-fabric-reinforced composite plates and short-glass-fiber-reinforced composite plates. The plates are shown in Fig. 2.21, and the dimensions are shown in Table 2.10. Type I specimens are prepared by mechanical machining, and type II specimen are molded. Unlike the case for fiber-reinforced composite compression specimens, buckling does not usually occur because of the large thickness of the compression specimens of fabric-and short-glass-fiber-reinforced composites, therefore specific jigs are not needed for these tests. Care should be taken to ensure that the upper and lower surfaces are parallel during the test to prevent fracture of the specimen. The draw ratio for measuring the compressive strength is 10, but if buckling occurs, a draw ratio of 6 is used. The compressive modulus of elasticity is determined using a draw ratio of 15. The compressive strength and compressive modulus of elasticity are calculated using Eqs. (2.8) and (2.9).
Fig. 2.21 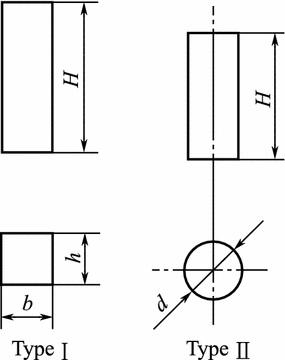
Shapes and dimensions of specimens for compression testing of fabric-reinforced and short-glass-fiber-reinforced composite plates
Table 2.10 Specimen dimensions for compression testing of fabric- and short-glass-fiber-reinforced composite plates (mm) -
3.
Methods for flexural testing of glass-fabric composites: Bar specimens are used for flexural property testing of glass-fiber composites plates and glass-fabric composite plates; the shapes, dimensions, and arbitral specimen dimensions are shown in Fig. 2.22, Tables 2.11, and 2.12, respectively. If either surface of the specimen is machined, the machined surface is subjected to an upward load. The test span greatly affects the flexural properties, and the national standard stipulates that the span L is equal to (16 + 1)h. When choosing materials or comparing solutions, the span:depth ratio should be changed appropriately for specimens that are too thick or too thin (1/h can be 10, 32, or 40), but it is best to use the arbitral dimensions when recording material flexural property data.
Fig. 2.22 
Specimen shape for testing flexural properties of fabric- and short-glass-fiber-reinforced composites
Table 2.11 Specimen dimensions for testing flexural properties of fabric- and glass-fiber-reinforced composites (mm) Table 2.12 Arbitral specimen dimensions (mm) -
4.
Methods for testing interfacial shear strength of glass-fabric-reinforced composites: Two methods are used for testing the interlaminar shear strength of glass-fiber-fabric-reinforced composites. For thin specimens, the short-beam three-point test for unidirectional fiber-reinforced composites can be used. The span is chosen to ensure interfacial shear breakage. The other method, i.e., GB 1450.1-83, is used for special specimens and assemblies, shown in Figs. 2.23 and 2.24. The specimen is machined to ensure that A, B, and C are parallel to each other and perpendicular to the layers. D has a smooth surface, and D, E, and F must be parallel to the layers. Smooth loading of A and C is required. Test jigs can be used to adjust C. The clamping tightness should allow the specimen to move freely up and down, with low friction. The platen surface must be smooth, and its height should be greater than the size of the next step. The specimen should be in a sheared state during the test. The specimen should be clamped in the interfacial shear jigs so that A faces upwards. It is better to allow the specimen to move freely up and down. The jigs are then placed in the testing machine, and the center of loading of face A is aligned to that of the platen on the testing machine. The load is uniformly and continuously applied until breakage occurs.
Fig. 2.23 
Specimen dimensions and shape for testing interfacial shear strength of glass-fabric-reinforced composites
Fig. 2.24 
Specimen dimensions for impact test
-
5.
Methods for testing the impact toughness of GFRPs using a simple supported beam: Specimens for impact-resistant tests using a simple supported beam have a rectangular (or square) cross section machined with a V notch. The specimen dimensions depend on the V notch machined on the specimen surface, the layer direction, and reinforcement (Fig. 2.25). The test equipment is a nonmetal pendulum testing machine with a simple supported beam, and the main dimensions of the pendulum and supporter are shown in Fig. 2.26. The impact speed is 3.8 m/s. The span is 70 mm. An appropriate pendulum is chosen to keep the energy for full specimen breakage in the range from 10% to 85% of the full energy. The notched specimen surface is placed opposite the pendulum, and the specimen is fixed with positioning plates so that the notch center is focused on the impact position. A specimen that is deficient or for which break does not occur at the notch is not accepted. If there are fewer than five effective specimens in a sample, the test is repeated. The impact toughness is calculated using Eq. (2.21):
Fig. 2.25 
Jigs for testing interfacial shear strength 1—front cover; 2—specimen; 3—side cover; 4—screw M4 × 14; 5—bolt M8 × 30; 6—axis sleeve; 7—axis; 8—block; 9—base
Fig. 2.26 
Dimensions of pendulum and base
$$ \alpha_{\upkappa} = \frac{A}{bh} $$(2.21)where
- α κ :
-
= impact resistance, J/cm2;
- A :
-
= power consumed to break specimen, J;
- b :
-
= width of the specimen notch, cm;
- h:
-
= thickness of the specimen notch, cm.


-
(3)
Methods for testing composite sandwiches
Composite sandwiches are usually used to significantly reduce the weight and improve the bending rigidity, and acoustic and thermal insulation. Composite sandwiches consist of upper and lower panels and light cores. Foamed plastics, light wood, and corrugated and honeycomb materials are usually used as light cores. Composite panels can provide the necessary strength and bending rigidity to withstand compressive and shear loading. Engineering designers consider the bending strength and rigidity of the core of a composite sandwich structure, adhesion between the composite panels and light core, and compressive properties to be important. The purpose of composite sandwich structure testing is to provide data for these properties, to evaluate the effects of various sandwich structures on these properties, and to determine interfacial adhesive properties for reference in material choice and structural design.
-
1.
Methods for testing flat tension strength of composite sandwich structures: The flat tension strength is mainly determined to evaluate the interfacial bonding properties between composite panels and cores, which are related to the adhesive type and technique. Rectangular or circular specimens of thickness equal to that of the sandwich product are used. Specimens of length or diameter 60 mm are used for continuous cores of materials such as foamed plastics and light wood. For honeycomb, corrugated, or cellular cores, the specimen length or diameter is 60 mm or at least four cells. If the thickness of the sandwich product is uncertain, a core thickness of 15 mm and panel thickness of 0.3–1.0 mm are used. The upper panel must be parallel to the lower panel, and the shape and dimensions of the loading block are the same as those of the specimen. After roughening with sandpapers and cleaning with the solution, two loading blocks are bonded separately with the upper and lower panels. The bonding curing temperature is room temperature or 30 °C lower than that of the sandwich adhesive. The bonded specimens are placed in the jigs for tensile testing. The 0 point scale of the testing machine is adjusted to the specific speed needed to apply a uniform loading until the specimen breaks. Specimens that debond from the loading blocks are invalid. The flat tension strength is calculated using Eq. (2.22):
$$ \sigma_{\text{t}} = \frac{P}{F} $$(2.22)where
- σ t :
-
= flat tension strength, MPa;
- P :
-
= load at break, N;
- F :
-
= cross-sectional area of specimen, F = a 1, a 2 (for rectangular specimens) or
$$ F = \frac{{\uppi\,D^{2} }}{4}\quad \left( {{\text{for}}\,{\text{circular}}\,{\text{specimens}}} \right); $$- a 1, a 2 :
-
= specimen length, mm;
- D :
-
= specimen diameter, mm.
-
2.
Method for testing flat compressive properties of composite sandwich structures: Rectangular or circular specimens, shown in Fig. 2.27, are used for testing the flat compressive properties of composite sandwich structures. The specimens used for testing the flat compressive strength are the same size as those used for flat tension strength tests. A specimen thickness of 15–80 mm is recommended for testing the core elastic modulus. The ball support is adjusted to make the upper block parallel to the indentor surface of the testing machine. The meter readings are checked, and the two side meter reading are made the same. The load is applied at levels 5–6% that of the break load until the specimen breaks. The flat compressive strength is calculated using Eq. (2.23).
Fig. 2.27 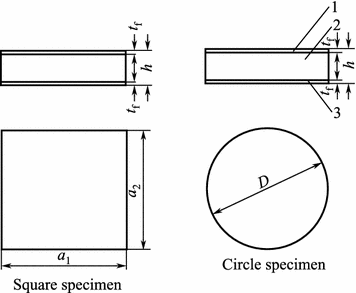
Specimen shapes for flat compression tests 1,3—panels; 2—core; a 1, a 2—edge lengths; D—specimen diameter; t f—panel thickness; h—specimen thickness
$$ \sigma = \frac{P}{F} $$(2.23)where
- σ :
-
= flat compressive strength, MPa;
- P :
-
= load at break, N;
- F :
-
= cross-sectional area, see Eq. (2.22).
The flat compressive modulus of elasticity of the core is calculated using Eq. (2.24):
$$ E_{\text{C}} = \frac{{\Delta P(h - 2t_{\text{f}} )}}{\Delta hF} $$(2.24)where
- E C :
-
= flat compressive modulus of elasticity, MPa;
- ΔP :
-
= load increment on straight line on the load–deflection curve, N;
- h :
-
= specimen thickness, mm;
- t f :
-
= panel thickness, mm;
- Δh :
-
= compressive deflection increment corresponding to ΔP, mm.
For a core of known dimensions, E C is calculated using Eq. (2.25):
$$ E_{\text{C}} = \frac{{\Delta Ph_{\text{C}} }}{{\Delta h_{\text{C}} F}} $$(2.25)where
- E C, ΔP, and F :
-
are as defined for Eq. (2.24);
- h C :
-
= core specimen thickness, mm;
- Δh C :
-
= compressive deflection increment corresponding to ΔP, mm.
-
3.
Flexural tests for FRP sandwich structures. Flexural tests for FRP sandwich structures are used to determine the panel strength when the sandwich structure bears a flexural load, the core shear strength, and the flexural shear rigidity of the sandwich. Two types of specimen, i.e., transverse and longitudinal, are used, and the specimen thickness is equal to the product thickness. National standard GB 1456-78 stipulates the panel thickness, sandwich thickness, lee lattice edge length, specimen width and length, and test span. A simple supported three-point bending test is used to test the flexural strength and shear strength, and a simple supported three-point extended bending test is used to test the flexural rigidity, as shown in Fig. 2.28. Flexural strength testing requires blocks at the loading points and supporting points. The block width in the loading noses is h ≤ B ≤ 1.5h. The block width to enable the supporting points to move freely is h/2 ≤ B ≤ h. The load is applied at a regulated speed at a level 5% of the breakage loading and 30–50% for deflection measurements. If complete load deflection data are needed, the test is continued until the specimen breaks. The core shear strength is calculated using Eq. (2.26):
Fig. 2.28 
Flexural tests for sandwiches
$$ \tau_{\text{c}} = \frac{PK}{{2b(h - t_{\text{f}} )}} $$(2.26)where
- τ c :
-
= core shear stress, MPa;
- P :
-
= break load, N;
- b :
-
= specimen width, mm;
- h :
-
= specimen height, mm;
- t f :
-
= panel thickness, mm;
$$ K = 1 - {\text{e}}^{ - A} A = \frac{1}{{4t_{\text{f}} }}\sqrt {\frac{{6\,G_{\text{C}} (h - t_{\text{f}} )}}{{E_{\text{f}} t_{\text{f}} }}} $$where
- E f :
-
= elastic modulus of panels, MPa;
- G C :
-
= shear modulus of core, MPa.
The panel flexural strength is calculated using Eq. (2.27):
$$ \sigma_{\text{f}} = \frac{{P_{\text{b}} l}}{{4bt_{\text{f}} (h - t_{\text{f}} )}} $$(2.27)where
- σ f :
-
= panel flexural strength, MPa;
- l :
-
= span of three-point bending, mm.
The flexural rigidity of a sandwich structure is calculated using Eq. (2.28):
$$ D = \frac{{\Delta Pl^{2} a}}{{16\,f_{\text{out}} }} $$(2.28)where
- D :
-
= flexural rigidity of sandwich structure, N mm2;
- ΔP :
-
= load increment corresponding to straight line on the load-displacement curve, N;
- f out :
-
= displacement increment corresponding to extending point ΔP, mm;
- a :
-
= extending length, mm.
The shear rigidity of a sandwich structure is calculated using Eq. (2.29):
$$ N = \frac{\Delta Pl}{{4\left( {f_{\text{mid}} - \frac{{lf_{\text{out}} }}{3a}} \right)}} $$(2.29)where
- N :
-
= shear rigidity of sandwich structure, MPa;
- ΔP :
-
= load increment corresponding to straight line on load–deflection curve, N;
- f mid :
-
= midspan deflection of specimen, mm.
The definitions of other symbols are the same as those for the equations above.
The shear modulus of elasticity is calculated using Eq. (2.30):
$$ G_{\text{C}} = \frac{N}{{b(h - t_{\text{f}}^{{}} )}} $$(2.30)where
- G C :
-
= shear modulus of elasticity, MPa;
Other symbols have the same meanings as in the equations above.


-
(4)
Methods for testing composite physical properties
The mechanical properties of composites are closely related to their physical properties. A knowledge of their mechanical properties and test methods enables determination of the physical properties of composites (including insoluble content of composite resin and composite resin content), and these data and test methods can be widely used in practical engineering projects.
-
1.
Methods for determining insoluble content of fiber-reinforced composite resin: The insoluble content of a fiber-reinforced composite resin is a major index for evaluating the composite properties and reflects the degree of cross-linking of thermosetting resins to some extent. The insoluble content is closely related to the mechanical and heat-resistant properties, and when the mechanical property data of composites are given, resin-insoluble content data also need to be supplied.
Acetone extraction is used to determine the resin-insoluble content. Sampling is performed 20–30 mm from the plate edges to avoid defects such as blisters, delamination, resin pocket wrinkles, and chips. The specimen mass is (1 ± 0.2) g. At least, three test specimens should be used. During specimen machining, water should be used for cooling; oil cooling is forbidden. After machining, the specimens are dried under appropriate conditions for an appropriate time. File cullers or other tools are used to grind specimens to powders, avoiding resin heating, and then screened with a 40# sieve. The residues are grounded again and stirred uniformly. Specimens that are sticky because of a degree of resin curing are not sieved. The specimen is dried for 2 h at (80 ± 2) °C after sampling and placed in a desiccator until it cools to room temperature or for 24 h. The specimen [(1 ± 0.2) g] is weighed on a filter paper. The weighing accuracy should be 0.0001 g. The specimen is packed in an extracting machine and extracted at a constant temperature of (80 ± 2) °C in a water bath for 3 h with a backflow velocity greater than 80 ± 2 times per hour. Several specimens can be extracted simultaneously, but the extraction time will be prolonged: 4 h for two specimens and 6 h for three specimens. When extraction is complete, the dried specimen is placed in a weighed bottle and heated for 2 h in a drying box at (105 ± 5) °C, cooled to room temperature in a desiccator, and weighed. The weighing accuracy is maintained during the test. The extraction time must be sufficient for complete extraction of the non-cured resin. The resin-insoluble content of the composite is calculated using Eq. (2.31):
$$ ^\prime C_{r} = \left( {1 - \frac{{G_{1} - G_{2} }}{{G_{1} \times W_{r} }}} \right) \times 100 \cdots $$(2.31)where
- C r :
-
= resin-insoluble content, %;
- G 1 :
-
= specimen quantity before extraction, g;
- G 2 :
-
= specimen quantity after extraction, g;
- W r :
-
= resin content, %.
-
2.
Method for determining resin contents of FRPs: The method for determining the resin contents of glass-reinforced plastics is different from that for carbon-fiber-reinforced plastics. An ignition method is used to determine the resin contents of glass-reinforced plastics, whereas sulfuric acid digestion is used for carbon-fiber-reinforced plastics.
-
(a)
Method for determining resin contents of glass-reinforced plastics. The sampling position and method for determining the glass-fiber-reinforced composite resin content are the same as those for determining the resin-insoluble content. The specimen weight is 2–5 g; at least, three specimens are tested for each sample. The specimen thickness is less than 5 mm. After sampling, the specimens are cleaned with a solvent and then placed in a desiccator at room temperature for 24 h, or dried at 80 °C for 2 h, and then cooled to room temperature in a desiccator. The specimen is heated in a crucible in a muffle furnace at (600 ± 20) °C for 10–20 min, cooled to room temperature, and weighed to the nearest 0.1 mg. The test is repeated until the crucible weight is constant. The crucible is placed in the muffle furnace at (600 ± 20) °C until all the carbonaceous material disappears; this takes approximately 30 min for epoxy and polyester FRPs, and about 90–120 min for phenolic FRPs. The crucible and residue are removed from the muffle furnace, cooled to room temperature in a desiccator, weighed, and burned again, at a constant temperature. This process is repeated until the difference between two successive results does not exceed 1.0 mg. Weighing is performed to the nearest 0.1 mg. The resin content is calculated using Eq. (2.32):
$$ W = \frac{{G_{2} - G_{3} }}{{G_{2} - G_{1} }} \times 100{\% } $$(2.32)where
- W :
-
= resin content, %;
- G 1 :
-
= crucible mass, g;
- G 2 :
-
= total weight of crucible and specimen, g;
- G 3 :
-
= total weight of crucible and residue after ignition, g.
Equation (2.32) includes the impregnated reinforcer and a small amount of small molecular materials formed by combustion. Blank tests can be used as a check if necessary.
-
(b)
Method for determining resin contents of carbon-fiber composites. Sulfuric acid digestion is used to determine the resin contents of carbon composites. Heating with sulfuric acid assimilates the resin matrix rather than corroding the carbon fibers. Each sample contains three specimens. The specimen quantity is 0.5 g. The specimen thickness is less than 3 mm. If the thickness is more than 3 mm, the specimen is cut into pieces of thickness less than 3 mm. The specimen can be any shape that fits the container. The specimen (0.5 g) is placed in a flask, and 95–98% sulfuric acid (30 mL) is injected into the flask. A thermometer is inserted, and the temperature is adjusted to the digestion temperature. The digestion temperature is the temperature at which dropwise addition of hydrogen peroxide (30%) makes the digestion solution clear and fibers float above the liquid level. The digestion temperature for an epoxy or polyester matrix is (220 ± 10) °C, a non-constant temperature; and for a phenolic resin matrix is (285 ± 5) °C, constant temperature for 1 h. The container of sulfuric acid and the specimen is heated in a ventilator. The time taken to increase the solution temperature from room temperature to the digestion temperature is not less than 15 min. Then, 30% hydrogen peroxide is dripped slowly along the bottle wall until the digestion solution becomes clear and fibers float above the solution level. The clear solution is then heated at the digestion temperature for 10 min. If the solution is turbid, hydrogen peroxide is added dropwise and the solution is stirred well until it becomes clear. A constant-weight filter apparatus is cleaned and weighed. The cooling digestion solution is diluted with distilled water under a vacuum of 17 kPa or better and filtered. The residue is washed with distilled water and acetone. The filtered fibers and filter apparatus are placed in an oven at (150 ± 5) °C and dried for 2 h. The filter or crucible is cooled to room temperature. Representative specimens are weighed, and blank tests are performed under the above conditions. The weight of the fibers equals the amount digested, and the length approximates to the fiber length. The percentage weight loss is calculated. The measurement accuracy is 0.1 mg. The resin content of the carbon-fiber-reinforced plastic is calculated using Eq. (2.33):
$$ W = \left[ {1 - \frac{{G_{2} }}{{G_{1} (1 - W_{1} )}}} \right] \times 100\,{\% } $$(2.33)where
- W :
-
= resin mass percentage in the carbon-fiber-reinforced plastic, %;
- G 1 :
-
= mass of the specimen before digestion, g;
- G 2 :
-
= final mass of carbon fibers after digestion, g;
- W 1 :
-
= the percentage weight loss of fibers in the blank test.
The resin content of the carbon-fiber composite calculated using the above equation excludes the fiber coating and impregnant. If an impregnant was included in the resin content, the fibers used in the blank test should be extracted and then digested.
-
(a)
2.3.1.2 Composite Mechanical and Physical Properties
Composite mechanical property data provide an important basis for material choice and structural design in projects. Different composites have significantly different mechanical properties. It is commonly thought that the reinforcing fibers are load bearing and the resin matrix acts as an adhesive and transfers loads. The tensile and compressive properties of a material mainly depend on the types and forms of reinforcements (continuous, fabric, short fibers). The interfacial properties and thermal resistance are determined by the resin matrix. The mechanical properties obtained using a given type of reinforcement differ depending on the fiber content and the fiber reinforcement form. Information on material properties and the factors that affect them is needed for material choice and structural design.
-
(1)
Mechanical and physical properties of composites for hand lay-up
Hand lay-up is one of the most common methods used in composite processing. It has advantages such as low investment, simple processing equipment, and easy molding processes. Composite mechanical and physical properties vary depending on the type of reinforcement and resin matrix. The properties of composites for hand lay-up under specific conditions are shown in Table 2.13.
-
(2)
Mechanical and physical properties of composites for SMC and BMC molding
SMC and BMC molding processes are widely used in engineering projects. The SMC or BMC is placed in a preformed mold and cured by pressing at a specific pressure, temperature, and time. The process has high mechanical efficiency. This process is suitable for applications such as production of large batches of water tank panels, vehicle parts, and electric switches. The composite properties are shown in Table 2.14.
-
(3)
Mechanical and physical properties of composites for laminates
Laminates, which are widely used in electrical insulation, are made by curing and hot pressing a resin matrix impregnated with glass-fiber cloth. The composite properties are shown in Table 2.15.
-
(4)
Mechanical and physical properties of composites for RTM, vacuum-assisted RTM (VARTM), and spray-up
RTM and VARTM are closed-mold processes. They cause less environmental pollution than hand lay-up and spray-up, but need special processing equipment. The composite properties are given in Table 2.16.
-
(5)
Mechanical and physical properties of composites for prepregnation
Prepregnation can be categorized into hot-melt prepregnation and solvent prepregnation, based on the prepregnating forms of the resins and fibers, and their fabrics. In hot-melt prepregnation, hot, molten resin films are painted uniformly on the surfaces of fibers and fabrics and then rolled using isolating films into intermediate products. In solvent prepregnation, fibers and fabrics prepegnated with resin solution are cured and rolled into intermediate products. The intermediate products are cut according to design requirements, placed in molds, and pressed using a vacuum bag into composite products. This process gives precise control of the resin content and flexible material design, and products with good mechanical properties. The mechanical and physical properties of fabrics and unidirectional fibers for prepregnation are shown Tables 2.17 and 2.18.
-
(6)
Mechanical and physical properties of composites for pultrusion
In pultrusion, a reinforcing material such as fibers, mat, or fabric and a prepregnating resin are cured in heated molds under a pulling force to give continuous products with required cross-sectional shapes. This process has high mechanical requirements and is suitable for manufacturing a range of products such as cable supports for insulating rods and protective covers for rails. The composite properties are given in Table 2.19.
-
(7)
Mechanical and physical properties of composites for filament winding
In filament winding, continuous fibers prepregnated with resin are wound uniformly on the surface of a mandrel. Continuous fibers of high specific strength and rigidity can be obtained. Flexible design allows the winding angle for each layer to be changed, and materials can be chosen based on the product property requirements. This process is suitable for manufacturing all types of pressure vessels and rotating structures. The material properties are given in Table 2.20.
-
(8)
Envelope curves of composite laminates
Many factors affect the mechanical properties of composite laminates, including the components and their proportions, the laying angle, stacking sequence, and loading conditions. The mechanical properties of laminates are determined based on theoretical calculations and testing.
A symmetric laminate of [0°/±45°/90°]s is a common lay-up product, and the unidirectional laminates mechanical properties base on the envelope curve of laminates.
The [0°/±45°/90°]s laminate envelope curve assumes that laminates bear only an interfacial tensile, compressive load in a linear elastic state rather than suffering breakage from cracks, delamination of free edges, and other factors. A [0°/±45°/90°]s laminate in the linear elastic state is produced by lay-up in the 0°, +45°, −45°, and 90° directions, and full lay-up is not less than 10%. The stress–strain curves of an AS1/3501 carbon-fiber/epoxy composite unidirectional laminate are shown in Figs. 2.29, 2.30, 2.31, and 2.32. The envelope curves of the AS1/3501 carbon-fiber/epoxy [0°/± 45°/90°]s laminate are given for reference in Figs. 2.33, 2.34, 2.35.

Longitudinal tension stress–strain curve of AS1/3501

Compressive stress–strain curve of AS1/3501

Compressive stress–strain curve of AS1/3501[±45]ns

Tension stress–strain curve of AS1/3501 90°

Tensile and shear moduli of AS1/3501 laminate

Tensile and shear moduli of AS1/3501 laminate

Poisson’s ratio for AS1/3501 laminate
2.3.2 Thermal Properties and Testing
Composites have not only good structural properties but also many other properties such as corrosion resistance, ablation and heat resistance, non-conductivity, and weatherability. Composites can be designed because they differ in terms of composition, processing, layer parameters, and thermal properties. Composites are anisotropic; therefore, their thermal properties have a certain direction, so methods for their testing differ from those used for non-composite materials. This is taken into account in composite design.
2.3.2.1 Thermal Property Testing
Composite thermal property testing is important for predicting and evaluating material properties. A wide range of methods are used, including Test method for coefficient of linear thermal expansion of FRPs (GB2572-81), Test method for thermal conductivity factors of FRPs (GB3139-82), Test method for average specific heat capacity of fiber-reinforced plastics (GB/T 3140—1995), Test method for Martin heat resistance of plastics (GB1035-70), and Test method for deflection temperature (GB1634-76).
-
(1)
Methods for determining average coefficient of linear thermal expansion
The coefficient of linear thermal expansion of a composite is affected by many factors. The coefficient of thermal expansion continuously changes with increasing test temperature. The coefficient of thermal expansion of a certain type of material can only be obtained for a given relative temperature range, material composition, and composition content. Test methods for determining the coefficient of average linear thermal expansion are applicable to FRPs and referenced to carbon- or aramid-reinforced composites.
The test method stipulates that the cross section of the test specimen should be round or square. For round specimens, the diameter is 6–10 mm, and the circumference is 50 or 100 mm. Square specimens have a side length of 7 mm. At least, three specimens are used in each sample. The ends of the specimen are cut flat, with less than 0.04 mm of roughness. Any dilatometer can be used that is able to heat uniformly, to control the rate of temperature increase of the specimens, the test specimen temperature, and its relative extension. The accuracy of the device for measuring changes in length should be 0.001 mm. The accuracy of the device for temperature measurements should be 0.5 °C, and the rate of temperature increase should be (1 ± 0.2) °C/min. Based on the expansion–temperature curve, the coefficient of linear thermal expansion over the temperature range \( a_{{T_{1} { \sim }\,T_{2} }} \) is given by
where
- L 0 :
-
= specimen length at room temperature, mm;
- K :
-
= multiples of extension length measured by device;
- ΔT :
-
= temperature difference, °C, ΔT = T 2 − T 1;
- ΔL :
-
= extended length of specimen relative to ΔT, mm;
- α quartz :
-
= average coefficient of linear thermal expansion of quartz at test temperature (T 1 − T 2), the value is usually 0.51 × 10⁻⁶ K−1.
-
(2)
Methods for determining thermal conductivity of FRP
The thermal conductivity of a composite can be used to predict the thermal properties of materials. Factors that affect the thermal conductivity include the types of resins and fibers, and the fiber orientation. Generally, the thermal conductivity of a continuous-fiber-reinforced composite is better than that of a non-continuous-fiber composite. The thermal conductivity is improved by increasing the content of carbon fibers in a composite. The thermal conductivities of Kevlar-fiber composites are lower than those of carbon-fiber composites.
The test method for determining the thermal conductivity stipulates that the specimen side length or diameter should be the same as that of the heater plate. The specimen thickness should be at least 5 mm, and less than 1/10 of the side length or diameter. The specimen surface should be flat and of roughness less than 0.5 mm/mm. At least, three specimens should be used in each sample. The testing device is shown in Fig. 2.36.

Device for measuring thermal conductivity 1—cooling plate; 2—specimen; 3—microcalliper; 4—heat protector; 5—heat-protecting plate; 6—heating plate; 7—thermometer; 8—constant-temperature water bath for heat-protecting plate; 9—constant-temperature water bath for cooling plate; 10—voltmeter; 11—watt-hour meter; 12—millivoltmeter
Specimens are pretreated before the test, below the temperature that would cause changes in quality and deformation (the maximum temperature should be less than 105 °C). The specimens are heated to constant weight or treated according to the product requirements. At constant weight, the specimen weight changes by less than 0.2% every 2 h at the treatment temperature. The side length or diameter of the heating plate is usually 100 mm. The width of the heat-protecting plate is one-quarter that of the side length or diameter of the heating plate to maintain the heat. The temperature differences between points on the main heating plate should be less than 2% of the temperature difference between both surfaces in a stable state and at most 0.5 °C. The temperature differences between points on the heat-protecting plate should be less than 5% of the temperature difference between specimen surfaces and at most 1 °C. The roughness of the heating plate surface should be less than 0.25 mm/m. The accuracy of the temperature measurements should be 1% of the temperature difference between the specimen surfaces in a stable state and at most 0.5 °C. The thermal conductivity λ [W/(cm K)] is calculated using Eq. (2.35):
where
- W :
-
= power of main heating plate in a stable state, W;
- d :
-
= specimen thickness, cm;
- S :
-
= calculated area of main heating plate, cm2;
- Δt :
-
= temperature difference between specimen surfaces, °C.
-
(3)
Method for determining average specific heat capacity of FRP
The average specific heat capacity of a composite is determined by uniformly heating a specimen to the test temperature, and then placing it with a copper thermometer of known heat capacity at a lower temperature, and measuring the increase in the thermometer temperature when they both have the same temperature. The heat absorbed by the thermometer is equal to that released by the composite. At least, three specimens should be used in each sample. The specimen is shown in Fig. 2.37. The measuring device is shown in Fig. 2.38. The thermometer is shown in Fig. 2.39. The thermometer material should be copper (heat capacity approximately 800 J/°C), and the heat capacity should be scaled to the electrical energy.

Specimen dimensions

Measuring device 1—specimen holder; 2—thermocouple thermometer; 3—metal wire; 4—specimen; 5—heating furnace; 6—copper pipe; 7—heating wire; 8—insulating material; 9—thermal insulation material; 10—furnace door; 11—rubber plug; 12—guy of movable cover; 13—agitator; 14—water bath at constant temperature; 15—outside cover of thermometer; 16—movable cover of thermometer; 17—thermometer; 18—scaled heating wire; 19—thermometer liner; 20—thermally insulated supporter; 21—platinum; 22—temperature gauge

Thermometers (chrome plated at thickness of 0.02 mm) 1—jack for thermometer; 2—guy of movable cover; 3—movable cover; 4—hinge; 5—thermometer liner; 6—copper thermometer; 7—scaled heating wire; 8—leading hole of heating wire
The water-bath temperature should not fluctuate by more than ±0.1 °C during the test. The maximum temperature difference in a uniform area should not be more than 1 °C. The thermometer precision should not be lower than 0.01 °C. The precision of the thermocouple for measuring the specimen temperature should not be lower than 0.2 °C.
The specimen is hung in the middle of a furnace of uniform area and heated to 100 °C. The thermometer is placed in a water bath, and the onset temperature of the thermometer and the bath temperature are kept at about 20 °C. The temperature of the water bath is adjusted to 1 − 1.5 °C higher than the onset temperature of the thermometer until a constant temperature is reached. After the temperature has stabilized, it is maintained for over 20 min and the temperature errors should not be more than ±0.2 °C. The temperature t is recorded when the specimen is lowered. The thermometer temperature changes are measured in three stages and read every other minute. (1) The temperature t 0 is recorded at the 10th minute. (2) The temperature t 1 is recorded at the 11th minute. The maximum temperature t n is recorded. (3) When the temperature starts to drop, the temperature is recorded for 10 min. After testing, the specimen is weighed to the nearest 0.01 g. The average specific heat capacity is given by Eq. (2.36):
where
- C p :
-
= average specific heat capacity, J/(kg K);
- C :
-
= heat capacity of the thermometer, °C;
- t n :
-
= highest temperature of the thermometer, °C;
- t s :
-
= the recommended thermometer temperature, °C;
- t 0 :
-
= the thermometer temperature, °C;
- m :
-
= specimen quantity after testing, kg;
- t :
-
= specimen temperature, °C.
The recommended thermometer temperature is given by Eq. (2.27) or Eq. (2.38):
where
- V 1 and V 3 :
-
= rates of temperature change in first and second stages, respectively, °C/min;
- t 1 and t 2 :
-
= average temperatures in first and second stages, respectively, °C;
- n :
-
= number of recording times in the second stage;
- t j :
-
= the temperature recorded in the second stage, °C.
-
(4)
Method for determining thermal resistance of plastics
The thermal resistance of a composite is largely determined by the resin properties. The thermal resistance is an important index in choosing composites and their working conditions for a project. The Martin thermal resistance test method and deflection temperature test are usually used to evaluate the thermal properties of plastics and composites.
-
1.
Martin thermal property test: The specimen is subjected to a flexural stress of (5 ± 0.02) MPa at (10 ± 2) °C/12 min below the static bending point. The temperature at which the flexural deflection is 6 mm is the Martin heat-resistant temperature. This test method is not applicable to plastics or FRPs with a thermal resistance below 60 °C. The Martin test specimen dimensions are (120 ± 1) mm × (15 ± 0.2) mm × (10 ± 0.2) mm. The surfaces of specimens of thickness more than 10 mm can be machined to 10 mm. Each sample consists of three specimens. The testing device and weight position adjustment are shown in Fig. 2.40. The weight position is first adjusted to apply a bending stress of 5 MPa to the specimen.
Fig. 2.40 
Martin test apparatus and weight position 1—weight; 2—bar; 3—specimen; 4—support; 5—deflection indicator; 6—thermometer (divisions less than 2 °C)
The weight position is calculated using Eq. (2.39):
$$ L = \frac{{\frac{{bd^{2} }}{{\sigma_{\text{f}} }} - P_{1} L_{1} - P_{2} L_{2}^{{}} }}{P} $$(2.39)where
- P :
-
= weight mass (including screws), kg;
- P 1 :
-
= indicator mass, kg;
- L 1 :
-
= distance from deflection indicator to specimen center, cm;
- P 2 :
-
= bar mass (including nuts), kg;
- L 2 :
-
= distance from bar center to specimen center, cm;
- b :
-
= width of specimen, cm;
- d :
-
= thickness of specimen, cm;
- σ f :
-
= bending stress, = 5 MPa.
The incubator in the testing apparatus is equipped with a blast device. The temperature difference at any position of the incubator can be up to 2 °C, and the initial temperature is (30 ± 1) °C. The specimen is installed vertically, and the bar is horizontal. The working length for specimen bending is (56 ± 1) mm. The temperature is increased after installation of the specimen. When the reading on the deflection indicator decreases to 6 mm, the temperatures of the two thermometers are recorded. The average temperature value is the Martin temperature.
-
2.
Thermal deflection temperature: The specimen is immersed in silicone oil at a uniform elevated temperature, and the temperature at which specimen deflection under a simple supported beam flexural loading occurs is the thermal deflection temperature. The test device is shown in Fig. 2.41.
Fig. 2.41 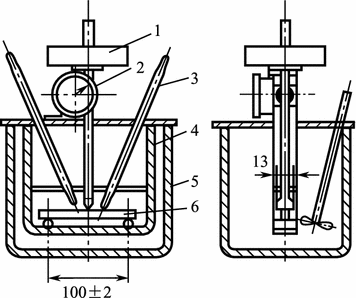
Device for determining deflection temperature 1—load; 2—dial gauge; 3—thermometer; 4—specimen supports; 5—bath; 6—specimen
The specimen supports are made of metal, and the load is applied vertically midway between the supports. The distance between the two supports is 100 mm. The contact edges between the loading rod and specimen are rounded to a radius of (3 ± 0.2) mm. A bath of a suitable liquid heat-transfer medium such as silicone oil, which will not affect the specimen, is used to increase the temperature at a uniform rate of (12 ± 1) °C/6 min. A set of weights of suitable sizes should be available so that the specimen can be loaded to a fiber stress of 1.82 or 0.455 MPa. The mass of the added weights is calculated using Eq. (2.40):
$$ M_{1} = \frac{{2\sigma bh^{2} }}{29.4l} - R\frac{T}{9.8} $$(2.40)where
- M 1 :
-
= weight mass, kg;
- σ :
-
= fiber stress, MPa;
- b :
-
= width of specimen, mm;
- h :
-
= thickness of specimen mm;
- l :
-
= midpoint of two supports, mm;
- R :
-
= mass of loading rod and indentor, kg;
- T :
-
= extra force of deflection device, N.
The divisions of the thermometer or thermal detector in the test apparatus should be 1 °C. The divisions of the dial gauge or differential transformer for measuring the deflection should be 0.01 mm. The specimens should have smooth flat surfaces free from blisters. The specimen dimensions should be 120 mm × 10 mm × 15 mm; the flexural deflection point should be 0.21 mm. If the specimen thickness exceeds 15 mm, the specimen should be machined to 15 mm. If the thickness is less than 15 mm, the specified flexural deflection should be more than 0.21 mm. During the test, the specimen dimensions should be measured so that the weight mass can be calculated. The test specimen is aligned edgewise on the supports. The thermometer is positioned midway between the test specimen supports, within 3 mm but without touching it. The specimen frame is then placed in the liquid bath; the top of the specimen should be at least 35 mm below the liquid level of the bath. Weights are added to obtain the desired stress of 0.455 or 1.82 MPa. After stirring sufficiently for 5 min, the deflection measurement device is adjusted to zero and the liquid heat-transfer medium is heated. The deflection temperature is recorded, i.e., the temperature of the liquid heat-transfer medium at which the specimen has been deflected by the specified 0.21 mm.


2.3.2.2 Thermal Properties
Composites have anisotropic thermal properties. The thermal properties of composites differ significantly depending on the types of reinforcement and resin.
-
(1)
Thermal properties of fabric- and fiber-reinforced plastics
Resins are often reinforced with fabric and chopped fibers. Hand lay-up, RTM, and pressure molding are usually used. Thermal properties are important in material choice and performance evaluation. Thermal property data for composites produced using various manufacturing processes are given in Table 2.21.
-
(2)
Thermal properties of unidirectional FRPs
The thermal properties of unidirectional FRPs are the basis of product design. The thermal properties vary depending on the material composition. The thermal properties of the finished products can be controlled to some extent based on composite design. The composite thermal properties are greatly affected by the manufacturing process. The thermal properties of several types of unidirectional composites and resin systems are given in Table 2.22.
2.3.3 Electrical Properties and Testing
Composites have a wide range of applications because they have good non-conductive properties as well as high specific strengths and rigidity. Knowledge, control, and testing of composite electrical properties are therefore important in material choice and property evaluation.
2.3.3.1 Electrical Property Tests
Methods for electrical property testing include methods for determining the electric strength of a solid insulating material at different power frequencies, methods for determination of the permittivity and dielectric dissipation factor of a solid electrical-insulating material at various power, audio, and radio frequencies, including meter wavelengths, and methods for testing volume and surface resistivity of a solid insulating material. National standards equivalent to the relevant IEC standards must be followed.
-
(1)
Methods for testing electric strength of solid insulating materials at various power frequencies
These methods are used to determine the short-term electric strength of a solid insulating material at 50 or 60 Hz. The results obtained using this method do not represent the long-term electrical properties but are the basis of regular quality control testing.
The national standard GB 1408-90 stipulates that copper, stainless steels, and other metals can be used for electrode materials. The electrodes must be kept smooth, clean, and free from defects at all times. If the upper and lower electrodes are not of equal size, the larger one should be connected to the ground side of the transformer and arranged coaxially.
-
1.
Specimens and electrodes for tests perpendicular to the surface of laminated materials
-
(a)
Board and sheet specimens. The electrodes consist of two metal cylinders with the edges rounded to give a radius of 3 mm. One electrode is of diameter 25 mm and height 25 mm. The other electrode is of diameter 75 mm and height 15 mm. The electrode of diameter 75 mm is placed on boards or sheets; if the thickness is greater than 3 mm, it is reduced by machining on one side to (3 ± 0.2) mm (Fig. 2.42).
Fig. 2.42 
Specimens and electrodes for board and sheet tests
-
(b)
Tube specimens (of internal diameter up to 100 mm). The outer electrode consists of a band of metal foil of width 75 mm. The inner electrode is a metal-foil sphere of diameter 35 mm. The metal foil must be soft enough to give good contact with the specimen (Fig. 2.43).
Fig. 2.43 
Electrode arrangement for tubes and cylinders
-
(a)
-
2.
Specimens and electrodes for tests parallel to laminated materials


-
(a)
Board and sheet specimens: The test specimen is a rectangle, with a length of 100 mm and a width of (25 ± 0.2) mm; its thickness is the same as that of the tested material. The long edges are cut as parallel planes at right angles to the surface of the material. The test specimen is placed between parallel metal electrodes, and a voltage is applied (Fig. 2.44). For thin specimens, two suitably placed test specimens are used to support the upper electrode. The electrode is of sufficient size to overlap the edges of the test specimens by 15 mm.
Fig. 2.44 
Electrode arrangement for tests parallel to surface
-
(b)
Tubes and cylinders: Both edges of the specimen are finished as parallel planes at right angles to the axis of the tube or cylinder. The test specimen is a complete ring or a 100-mm circumferential portion of a ring of axial length (25 ± 0.2) mm. The electrodes should be of sufficient size to overlap the edges of the specimens by 15 mm.

The voltage is raised from zero at a uniform rate until breakdown occurs, between 10 and 20 s. If the test specimen withstands the voltage for 20 s without failure, the voltage is increased in incremental steps until failure occurs. The electric strength is based on the highest voltage that is withstood for 20 s without breakdown. The electric strength is calculated using Eq. (2.41):
where
- V b :
-
= breakdown voltage, MV;
- d :
-
= specimen thickness, m;
- E b :
-
= electric strength, MV/m.
Five tests are conducted, and the electric strength or breakdown voltage is determined from the median of the test results. If any test result deviates by more than 15% from the median, five additional tests are performed. The electric strength or breakdown voltage is then determined from the median of the 10 results.
-
(2)
Methods for determination of permittivity and dielectric dissipation factor of solid electrical-insulating material at power, audio, and radio frequencies, including meter wavelengths
The relative permittivity ε r of an insulating material is the ratio of the capacitance C x of a capacitor, in which the space between and around the electrodes is entirely and exclusively filled with the insulating material in question, to the capacitance C o of the same configuration of electrodes in a vacuum. The dielectric loss angle δ of on insulating material is the angle of the phase difference between the applied voltage and resulting current, when the dielectric of the capacitor consists exclusively of the dielectric material. The composite permittivity and dielectric loss angle are related not only to frequency, temperature, moisture, and field strength, but also to the material composition, specimen thickness, and fiber orientation. The test conditions, including temperature and moisture, should therefore be noted. Sheet specimens are preferable for determining the permittivity and dissipation factor of a material, but the material may only be available in tubular form. The accuracy of the specimen thickness must be within ±(0.2% ± 0.001 mm), and the measuring points should be spread uniformly over the entire surface. The electrodes can be contact electrodes, contactless electrodes, and fluid displacement fixation electrodes. To avoid errors in the permittivity caused by edge effects, the electrode system can include a guard electrode. The guard electrode width should be at least twice the thickness of the specimen, and the gap between it and the main electrode should be smaller than the thickness of the specimen. Various types of electrode can be used, including metal-foil electrodes, fired-on metal electrodes, electrodes produced by spraying metal electrodes by cathodic evaporation or evaporation under high vacuum, mercury and other liquid-metal electrodes, conducting paint, and conducting rubber. Methods can be divided into two groups: null methods and resonance methods. Null methods are used at frequencies up to about 50 MHz. The networks normally used are a Schering bridge, transformer bridge, and parallel-T. Resonance methods can be used in the range 10–300 MHz. The reactance-variation and Q code-variation methods are generally used. The relative permittivity is measured accurately with a tolerance of ±1%, and the dielectric dissipation factor is measured with a tolerance of ±(5% + 0.0005). The relative permittivity of a specimen with its own electrodes is calculated using Eq. (2.42):
The relative permittivity of a specimen without a guard electrode is calculated using Eq. (2.43):
where
- ε r :
-
= relative permittivity;
- C x :
-
= capacitance of insulating material;
- C o :
-
= capacitance of capacitor in vacuum;
- C c :
-
= correction for edge capacitance.
The dielectric dissipation factor tanδ is calculated from the measured values in accordance with the equations applicable to the specific measuring arrangement.
-
(3)
Methods for determining volume resistivity and surface resistivity of solid insulating materials
Direct and comparison methods are commonly used for measuring volume resistivity and surface resistivity. The direct methods can be divided into the voltmeter–ammeter method and current-amplifier method (resistor method). Comparison methods can be divided into ammeter and bridge methods. The measuring device must be capable of determining the unknown resistance with an overall accuracy of at least ±10% for resistances below 1010 Ω, and ±20% for higher values. Specimens commonly in use are either flat or tubular; specimen shapes and electrode arrangements are shown in Figs. 2.45 and 2.46. In measurement of the volume resistance, electrode (1) is a guarded electrode (measuring electrode), (2) is the guard electrode, and (3) is an unguarded electrode. The diameter d 1 or length L 1 of the guarded electrode should be at least 10 times the specimen thickness and for practical reasons usually at least 25 mm. The diameter d 4 (or length l 4) of the unguarded electrode and d 3 (or l 3) of the guard electrode should be equal to the inner diameter d 2 of the guard electrode (or length L 2) plus at least twice the specimen thickness. The values d 1(l 1) = 50 mm, d 2(l 2) = 54 mm, d 3(l 3) = d 4(l 4) = 74 mm are recommended.

Electrode arrangement on flat specimen 1—electrode (1); 2—electrode (2); 3—specimen; 4—electrode (3)

Electrode arrangement on tubular specimen 1—electrode (3); 2—electrode (2); 3—electrode (1); 4—specimen
In measurements of the surface resistivity, (1) is a guarded electrode, (3) is the guard electrode, and (2) is an unguarded electrode. In measurements of the surface resistivity between electrodes (1) and (2), the surface gap width g is at least twice the specimen thickness (1 mm is normally the smallest practicable width), so that the effect of the volume resistance is negligible. The diameter (or length) of the guarded electrode should be at least 10 times the specimen thickness, and for practical reasons at least 25 mm.
The recommended electrode arrangement is d 1(l 1) = 50 mm, d 2(l 2) = 60 mm, and d 3(l 3) = d 4(l 4) = 80 mm. The specimen should be 7 mm larger than the maximum size of the electrodes at each side. At least, three samples should be tested. Electrode materials include evaporated metal, sprayed metal, and metal-foil conductive silver paint. A specified direct voltage is applied, and a timed device takes measurement after each of the following electrification times: 1, 2, 5, 10, 50, and 100 min. If the electrification time needed to reach steady state is long, the volume resistance is reported as a function of the electrification time. The electrification time is 1 min.
The volume resistivity is calculated using Eq. (2.44):
where
- ρ V :
-
= the volume resistivity, Ω m
- R V :
-
= the volume resistivity of the specimen, Ω;
- A :
-
= the effective area of the electrodes, m2.
where h = the average thickness, m.
The surface resistivity is calculated using Eq. (2.45):
where
- ρ S :
-
= the surface resistivity, Ω;
- R S :
-
= the surface resistance of the specimen, Ω;
- P :
-
= the effective perimeter of the electrode.
where
2.3.3.2 Electrical Properties
Generally, composites have good electrical properties. The electrical properties are anisotropic and greatly affected by the material composition, interfacial state, fiber orientation, and processing method.
-
(1)
Electrical properties of insulating SMCs and BMCs
SMC and BMC products are widely used as insulating materials. SMCs and BMCs are used for complex products with high structural strength and good electrical insulation; examples are shown in Table 2.23.
-
(2)
Electrical properties of laminated composites
Laminated composites are widely used for insulation in the electrical industry. A prepreg cloth made by impregnating glass cloth with resin is heated in a press and cured to give the laminated product.
This process involves a high molding pressure and gives low porosity; therefore, the products have good electrical properties (Table 2.24).
-
(3)
Electrical properties of fabric composites
Fabric composites need to be non-conductive under some conditions as well as having good mechanical strength, e.g., for use in large FRP ground radomes. Information of their properties is therefore needed in designing such materials to assist choice of suitable materials and processing solutions. The electrical properties of various fabric composites are shown in Table 2.25.
-
(4)
Electrical properties of unidirectional composites
Unidirectional composites have anisotropic mechanical properties, and their electrical properties vary depending on the fiber orientation because of the differences between the electrical properties of fibers and resins. Unidirectional composites are seldom used as structural materials, but they form the basic cells of laminates. The electrical properties of unidirectional composites are basic parameters of structural composites in the electrical insulation field and the basis of laminate design. Their properties are given in Table 2.26.
2.3.4 Corrosion Resistance and Testing
Composites have good corrosion resistance and are used widely in areas such as the chemical industry, oil exploration, papermaking, and the metallurgical industry. The main products include acid wash baths, chemical pipes, and tanks. The material compositions and processes used to fabricate composites vary depending on the stored material to meet the working requirements of products.
2.3.4.1 Corrosion-Resistant Testing
The composite corrosion resistance is the mass or thickness of the corrosive parts in a specimen unit area per unit time when the composite is in a chemical medium (e.g., acid, alkali, organic salt, organic solvent). It indicates the resistance of composites to chemicals.
Resistance to chemicals is determined by regular static soaking of composite plates and checking changes in the appearances of the specimen and medium, Barcol hardness, and bending strength changing ratio, in addition to changes in the plate mass and flexural modulus of elasticity if required.
The test plate specimen is 130 mm in length, 130 mm in width, and 3.2 ± 0.2 mm in thickness, or 80 mm in length, 15 mm in width, and 3.2 ± 0.2 mm in thickness. The specimen surfaces must be smooth, uniformly glossy, and free from visual blisters and exposed fibers. Four specimens are tested. The test chemicals are solution or industrial grade and diluted with distilled water or deionized water or chosen based on the technical requirements. The test temperature can be divided into room temperature (10–35 °C), 80 °C, or a temperature chosen based on the technical requirements. The periods for room temperature tests are 1, 15, 30, 90, 180, and 360 days. The periods for higher-temperature tests are 1, 3, 7, 14, 21, and 28 days. Specimens are prepared and tested separately based on the predicted specimen appearance, Barcol hardness, and bending strength. The specimen is immersed in the chemical, and the immersion time is recorded. The specimens are chosen according to test periods. The surface is cleaned, and the specimen appearance, Barcol hardness (or mass), and flexural strength are investigated. If delamination blisters form during the test, the test is terminated and the termination time is recorded. A table or curve based on the period and Barcol hardness during each period is compiled. The changes in flexural strength are calculated using Eq. (2.46). The percentage change is calculated when testing the flexural modulus of elasticity or mass.
where
- σ f1 :
-
= flexural strength before the test, MPa;
- σ f2 :
-
= flexural strength after the test, MPa;
- Δσ f :
-
= percentage change in flexural strength, %.
2.3.4.2 Corrosion-Resistant Properties
The corrosion resistance of a composite mainly depends on the resin matrix and the interface between the fibers and resins. Generally, composites have good acid resistance and poor alkali resistance. The choice of resin composite depends on factors such as the type of medium, temperature, and medium concentration. Corrosion accelerates with increasing temperature and concentration. Polyester, vinyl ester, epoxy, and phenolic composites are commonly used to manufacture anti-corrosive products. The processing conditions greatly affect the corrosion-resistant properties of products. The following data are provided for information purposes only.
-
(1)
Corrosion resistance of unsaturated polyester composites
Unsaturated polyester composites are widely used in vessel liners, pipes, and because of their low cost, ease of processing and good corrosion resistance (Table 2.27).
-
(2)
Corrosion resistance of vinyl ester composites
Vinyl ester resins, which contain phenolic and epoxy groups, have good thermal and corrosive properties. They have the low curing temperatures of polyester resins, are easily processed, and are widely used in chemical-corrosion-resistant products. The corrosive properties of vinyl ester FRPs are shown in Table 2.28.
-
(3)
Corrosion resistance of epoxy resin composites
Epoxy resins have good mechanical, thermal, and corrosive properties. Curing at room temperature or higher temperature is used, depending on the application requirements; resins cured below room temperature have poor thermal properties. The corrosive properties of epoxy resins are shown in Table 2.29.
-
(4)
Corrosion resistance of phenolic resin composites
Phenolic resins have good thermal and acid-resistant properties, except to the thick sulfuric acid and nitric acid. Their alkali resistance is not better than those of epoxy resins. Phenolic resins have poor processing and corrosion properties (Table 2.30).
-
(5)
Corrosion resistance of other resin composites
Furan resin composites are often used for resistance to chemical corrosion. They have good resistance to strong acids and alkalis and good thermal properties, but are difficult to process. Their properties are shown in Table 2.31. In terms of reinforcements, carbon fibers have good anti-corrosion properties. Because of the electronic conjugation of the benzene ring, aramid fibers are chemically stable and have good corrosion resistance except strong alkalis and acids. They would be affected little by organic solvents and oils. The properties of furan resins are given in Table 2.32.
2.3.5 Aging Properties and Testing
Composite aging properties are defined as variations in the composite performance with storage or exposure to weather conditions such as sunlight, rain moisture, and temperature. They are important indexes in predicting the long-term performances of composites.
2.3.5.1 Test Methods for Aging Properties
Methods for determining composite aging properties are divided into natural aging methods and accelerated aging methods. The properties determined using the natural aging method are unforced but limited by the test sites and long test times. The accelerated aging method can shorten the test time but needs more test data and mathematical simulation, and the data accuracy is worse than that achieved using the natural aging method. Both methods have limitations, which should be considered carefully.
-
(1)
Method for determining effects of weather exposure on GFRPs.
The test method for investigating the effects of exposure of GFRPs to weather can be used to predict the effects of weathering on the appearance, and physical or mechanical properties of materials with no applied stress. Exposure test specimens can be direct specimens, specimen panels, or real products. At least, five samples should be tested. The properties of the test specimens before the test and the initial properties under standard conditions are recorded. The total amount of specimen needed is determined based on the exposure duration and the number of samples. Exposure test specimens are fixed in racks 0.8 m above the roof. These racks are adjusted so that the exposed surfaces of the specimens are at an angle of 45° ± 1° to the horizontal. Insulating materials are used to isolate the exposure test specimens and racks. The exposure duration is usually not less than 5 years. Pick up the specimens when they are exposed for 0.5, 1, 2, 3, 5, 7, and 10 years. The appearance of the exposed specimen is checked, and it is machined to the required specimen shape after the specified exposure duration has elapsed. The property retention rate is calculated using Eq. (2.47):
where
- R i :
-
= the property retention rate, %;
- X 0 :
-
= the arithmetic mean value of the initial property;
- X i :
-
= the arithmetic mean value of the specimen property for each sample after i periods.
-
(2)
Method for testing resistance of GFRPs to damp heat
This method is used to predict the effects on the use and storage of glass-fiber-reinforced composites of constant or fluctuating damp heat. At least, five specimens are tested and the specimen dimensions conform to specific requirements. The temperature of the constant-damp heat box should range from (25 ± 2) °C to (60 ± 2) °C. The relative humidity should be (93 ± 3)% at high temperatures, and 80–96% at low temperatures. The test periods are 1, 2, 6, 14, 21, or 28 days. The specimens are removed from the constant-damp heat box and cooled to room temperature in a closed container and then tested. The mechanical property retention rate is calculated using Eq. (2.48):
where
- R i :
-
= the mechanical property retention rate after i periods, %;
- X 0 :
-
= the arithmetic mean value of the initial mechanical property;
- X i :
-
= the arithmetic mean value of the mechanical property of each sample after i periods.
-
(3)
Method for testing resistance of GFRPs to water
This test is used to predict the effects of water on the mechanical properties of GFRPs and their maximum flexural strength in moist conditions. At least, five specimens are tested. The specimens must meet the relevant requirements for mechanical testing. The medium used to soak the test specimen is distilled water at (23 ± 2) °C. The test specimens are soaked in either constant-temperature water or the water used in practical applications. The test periods are 30 days for water resistance, and 14 days for measuring the maximum flexural strength. A sample of specimens should be tested in each period until the rate of flexural strength change with time is nearest zero. The immersion period for specimen plates is usually not less than 5 years. Pick up the specimens when they are exposed to 0.5, 1, 2, 3, 5, 7, 10 years, or longer. The mechanical property retention rate is calculated using Eq. (2.49):
where
- R i :
-
= the mechanical property retention rate after i periods, %;
- X o :
-
= the arithmetic mean value of the initial mechanical property;
- X i :
-
= the arithmetic mean value of the mechanical property for each sample after i periods.
The maximum flexural strength in the moist state is calculated using Eq. (2.50) after the test. When t ≤ t 0.05,
where
- t :
-
= the calculated value after the test;
- S 1 and S 2 :
-
are standard differences in specimen property between last test and next test, respectively;
- X 1 and X 2 :
-
are the mean values of specimen property after last test and next test, respectively;
- n 1 and n 2 :
-
are specimen numbers in last test and next test, respectively:
-
(4)
Method for determining accelerated resistance of GFRPs to water
This method is used to predict the behavior of GFRPs used in water to sieve raw materials. At least, five specimens are tested. The specimen dimensions should conform to the mechanical property requirements. The resistivity of the distilled deionized water used for soaking the specimens should be not less than 500 Ω m. Specimens should be soaked in water at (80 ± 2) °C. Materials with good thermal properties are soaked in water at (95 ± 2) °C or boiling water. Materials with poor thermal properties are soaked in water at (60 ± 2) °C. The specimen is soaked for 24 h. The period of soaking for epoxy phenolic resin composites is 1, 2, and 6 days. The period of soaking for polyester resin composites is 1/3, 1/2, 1, 2, 3, and 6 days. The appearance is checked after the specified test period has elapsed. The mechanical property retention rate is calculated using Eq. (2.48).
2.3.5.2 Composite Aging Properties
Composite aging properties, which are of great concern to designers, are affected by many factors. The aging mechanism is very complex and is therefore difficult to describe quantitatively. With the development of composites, a large number of studies are being performed to determine the effects of sunlight and accelerated aging, and large amounts of test data are available. The data shown in Tables 2.33, 2.34, 2.35, 2.36, 2.37, and 2.38 are for information and reference only.
2.3.6 Other Properties and Testing
Composites have not only high specific strengths, good chemical resistance, low thermal conductivities, and good non-conductive properties but also good flame retardancy, optical properties, and frictional properties; therefore, they are widely used in building and sports equipment. Knowledge of the fire-retardant, optical, and frictional properties of composites is necessary for solving practical problems in a project.
2.3.6.1 Other Property Testing
The flame retardancy, optical properties, and frictional resistance are often important in practical applications of composites. Methods for testing the flame retardancy and optical properties of composites are performed according to national standards. Frictional resistance tests are usually used to determine the coefficients of friction of plastics.
-
(1)
Test method for determining flammability properties of GFRPs.
This test method is used to predict the necessary minimum concentration of oxygen needed to support flaming combustion of GFRPs. A sample should consist of at least five specimens. The specimen dimensions are length 70–150 mm, width (6.5 ± 0.5) mm, and thickness (3 ± 0.5) mm. The difference between the maximum and minimum resin contents can be up to 4%, and the curing degree should be more than 80%. A test device for determining the oxygen index is shown in Fig. 2.47.

Apparatus for determining oxygen index 1—combustion tube; 2—clamp; 3—igniter; 4—wire mesh; 5—tube containing glass ball; 6—base; 7—tee joint; 8—gas mixture; 9—gas gauge; 10—voltage valve; 11—rotameter; 12—regulating valve; 13—specimen
The test specimen is mounted vertically in the specimen holder; the distance between the upper end of the specimen and the top of the combustion tube should be not less than 100 mm. The igniter flame length should be 15–25 mm. The flow valves should be adjusted to give the required concentration of oxygen in a flowing mixture of oxygen and nitrogen and to ensure that the gas flow rate in the combustion tube is (4 ± 1) cm/s. The tube is purged by the gas flow for at least 30 s, and the igniter is used to initiate burning only on the top surface of the upper end of the specimen. The igniter is removed once the specimen has been ignited. The burning period and burning behavior are recorded; the minimum concentration of oxygen needed to support combustion for 3 min is determined. The oxygen index is calculated using Eq. (2.51):
where
- OI:
-
= oxygen index, %;
- [O2]:
-
= oxygen flow, L/min;
- [N2]:
-
= nitrogen flow, L/min.
-
(2)
Test method for determining transmissivity of GFRPs
The transmissivity of a GFRP is the ratio of the flux of light passing through the specimen to that passing vertically through the specimen. The specimen size is 40 mm by 40 mm or ϕ 40 mm plates. There are not less than three specimens in a sample. The test principle is shown in Fig. 2.48. The light source is standard A. The light receiver has a V λ spectral filter. The accuracy of the transmissivity should be not more than ±2%. The specimen is fixed on the test frame, and the light is positioned. The specimen should be closely attached to the wall with a light input hole on the integral ball. The indicated value is the transmissivity.

Schematic diagram of integral ball apparatus for determining light transmittance 1—viewfinder; 2—light source; 3—raster; 4—lens; 5—collimator; 6—sample room; 7—sample; 8—integral ball; 9—display; 10—light receiver (with V λ spectral filter); 11—voltage-stabilized source
-
(3)
Test method for determining plastic coefficient of friction
The coefficient of friction of a plastic is measured based on the coefficient of kinetic friction of a plastic sheet. The speed and positive pressure of the friction-testing machine can be adjusted in the speed range 0.10–3.00 m/s (shown in Fig. 2.49). Specimen types are shown in Fig. 2.50. The dimensions of a rigid fixed specimen should be diameter (20.0 ± 0.1) mm and thickness (2.0 ± 0.1) mm; the mass should be (5.0 ± 0.01) g. If the specimen mass is less than (5.0 ± 0.01) g, fined washers should be used to compensate. For a rigid movable specimen, the dimensions should be (100.0 ± 0.1) mm, and the minimum thickness should be such that 2.0 mm of the specimen length remains attached. The thickness is usually 2.54–3.18 mm. A fixed specimen can be used to determine the kinetic coefficient of friction at different speeds. A movable specimen is used to determine the kinetic coefficient of friction at different times. During the tests, the test machine is adjusted to be horizontal, according to the operational requirements, and then the fixed or movable specimen is positioned. A positive pressure is applied to the fixed or movable specimen. The positive pressure is adjusted to 0.5 N. The oscillation range is chosen based on the test material and positive pressure. The coefficient of friction as a function of time is investigated based on readings at 0.25, 0.50, 1.0, 2.0, 3.0, 1.0, 0.5, and 0.25 m/s; to reduce wear, the test time is limited to 1.5 min. The coefficient of friction as a function of time is investigated by taking readings at a fixed speed every 30 s until the reading becomes constant. A standard speed of 1.0 m/s is usually used to compare materials. The coefficient of friction is calculated using Eq. (2.52). The wear extent, which is also of concern, is determined as follows. The test material is moved on a grit surface under a certain pressure, and the volume of material lost is measured to predict the frictional properties.

Friction-testing machine 1—movable specimen; 2—fixed specimen; 3—hinge arm; 4—pendulum; 5—notch for pressure correction (with standard weights); 6—finder; 7—ruler; 8—button for pressure correction; 9—nut for choosing fast operation; 10—base; 11—drive belt

Specimens 1—tightener combined with mounting screw; 2—tightener combined and concentric with mounting shaft
where
- μ :
-
= coefficient of friction;
- M :
-
= maximum oscillation distance, N m
- N :
-
= positive pressure, N;
- θ :
-
= displacement angle of oscillation, °.
2.3.6.2 Composite Flame-Proofing, Transparency, and Coefficient of Friction
Composites differ in terms of flame-proofing, transparency, and coefficient of friction. Specific resins, matched fibers, and assistants are chosen to obtain specific properties, and meet application requirements. Data on composite flame-proofing, optical, and frictional properties are generally obtained by performing tests under specific conditions. The data in Tables 2.39, 2.40, 2.41, and 2.42 are for information and reference purposes only.
2.4 Latest Developments and Trends in Polymer Composite Industries
2.4.1 Development Status of Polymer Composites
Polymer composites are the main type of composite, and industrial techniques in this area have been improving for over 50 years. Composite products are widely used in fields such as transportation, construction, chemical resistance, ships, and electronics.
In 2002, the global output of polymer composites was about 4.5–4.6 million tons; North America, Europe, and Asia were the three largest manufacturers and customers. The major markets are for construction, transportation, electronics, and consumer goods.
In the 1990s (1991–1998), global polymer composite production increased by an average of 5.6% per year, and the output value was nearly twice as much as the GDP of developed countries.
Polymer composites reinforced with glass fibers (GFRPs) have dominated the polymer composite market. The amount of glass fiber used in 2002 was 2.2 million tons globally, with North America, Europe, Asia, South America, and other areas accounting for 33%, 32%, 30%, and 2%, respectively [14].
Recently, the use of high-performance fibers such as carbon fibers and Kevlar fibers to reinforce polymers have increased rapidly and become an important part and growing aspect of polymer composites [15, 16].
The development of polymer composites in different parts of the world is related not only to the local economy but also to the maturity of composite applications. North America, especially the USA, is the largest producer and sales market; its output of 1.9 billion tons in 2002 accounted for approximately half of the global demand. The CFA’s statistics show that there are more than 13,000 composite production lines and 236,000 employees in the USA. Over 90% of composites products are reinforced with glass fibers, and nearly 75% of products are based on unsaturated polyester resin (UP) or other thermosetting polymers, and the remaining 25% use thermoplastics as the matrix. The largest composite market in the USA covers transportation, building, and corrosion-resistant applications. Marine, electronic, and leisure good applications are also significant. Polymer composite outputs in the past few years are shown in Table 2.43 [17, 18].
Europe is another major area for the production and consumption of polymer composites. The annual average growth rate during the period 1991–1998 was 4.7%. The market slumped in 1993 and 1996, but the European polymer market growth has been relatively stable since 1997. For example, in 1998, the polymer market shares of various European countries were 33% in Germany and Austria; 19% in Italy; 14% in France; 13% in Belgium, the Netherlands, and Luxembourg; 9% in the UK; 8% in Spain and Portugal; and 4% in Sweden, Norway, Denmark, and Finland.
The Asia–Pacific region is the biggest potential market for polymer composites. Market analysis suggests that the demand for polymer composites will continue to increase for a long time. The annual growth rate is predicted to rise to 7%.
Japan is a major producer of polymer composites in the Asia–Pacific region. The outputs in 1998 and 1999 were lower than that in 1997 because of the Japanese economic slump, but the total output was higher than 600,000 t. The per capita quantity was about 5.29 kg (compared with 0.22 kg in China), higher than that of any other country in this region. The growth in polymer production in Japan in recent years is shown in Table 2.44.
The proportions of forming processes used in polymer composite production lines in Japan are given in Table 2.45.
China is also a large producer of polymer composites in the Asia–Pacific region. Production of FRPs slowed down during the three decades from 1958 when China was engaged in R&D of FRPs. In the early 1990s, FRP output reached nearly 100,000 t. Output increased significantly in the late 1990s. The output of glass-reinforced thermosetting composites reached 560,000 t, and that of glass thermoplastics was about 180,000 t, so the total output ranked second in the world. Table 2.46 shows the annual output of polymer composites in 1990–2002 in China.
Thermosetting FRP market shares in China are shown in Table 2.47.
At present, the FRP production facilities in mainland China are as follows: 300 production lines for filament-wound specific-length pipes, mortar pipes, and horizontal tanks; two production lines for continuous filament-wound pipes; three production lines for centrifugally cast pipes; 200 presses for SMCs and BMCs; 200 pultrusion production lines; 550 sets of spray-up machines; 10 continuous profile production lines; and 50 winding machines for vertical tanks. The proportions of various processes are shown in Table 2.48.
2.4.2 Latest Progress in Polymer Composite Technology
During the last 10 years of the twentieth century, much research on raw materials and processing techniques focused on issues such as lowering costs, enhancing polymer composite properties and functions, and environmental protection, and significant progress was made in these areas.
2.4.2.1 New Progress in Reinforcements
-
(1)
Glass fibers
-
1.
New glass-fiber compositions: High-performance glass fibers based on E-glass have been gradually introduced and are intended to replace E-glass. Owens Corning Fiber glass (OCF), USA, have done an excellent job in this respect. OCF recently introduced a chemical-resistant boron-free ECR containing ultrahigh-strength glass fibers, under the trademark Zen Tron. The tensile strength of this fiber is 50% higher than that of typical E-glass and 15% higher than that of S-2 high-strength fibers. The impact strength of products reinforced with this fiber is 50% higher than those of carbon-fiber-reinforced products, and the fatigue resistance is also enhanced. Advantex intends replacing E-glass with a composition that has the combined high strength, and electrical and chemical properties of E-glass and ECR fibers. OCF has also produced dual-composition glass fibers for industrial production and applications [19].
MIRAFLEX, OCF’s new and special type of flexible glass fiber, is produced using a combination of two techniques to melt two types of glass with different chemical compositions. These fibers are more flexible and elastic than typical glass fibers because they have disordered twisting and easily fill irregular cavities. Their heat resistance is higher than those of other synthetic and man-made fibers, and they produce less odor when they are heated. They have good fire resistance and are chemically stable. They also have valuable properties such as good processability and easy carding. They can be blended with synthetic and natural fibers and made into nonwoven materials as CCL cores by carding, providing a substitute for electric cloth.
-
2.
New glass-fiber products and fabrics
-
(a)
Air deformation roving. Air deformation roving is achieved by applying a high-pressure and high-speed air flow to the looped pile of a common roving in a special device. This device has many loops, with the result that many fibers are at right angles to the roving length direction. The use of this type of roving can improve the transverse strength of unidirectional composites.
-
(b)
TWINTEX is the trademark of raw materials made of glass-fiber-reinforced thermoplastics produced by VETRO TEX in the USA (part of the Saint-Gobain Group). During glass-fiber pulling, a thermoplastic (e.g., PP, PET, nylon) is applied to the glass; there are four types of product, i.e., roving, woven roving, panels, and granules.
-
(c)
OCF have successfully developed a type of roving for reinforcing thermoplastics. When the roving passes a cover head, fiber strands can be separated into single fibers and completely impregnated with thermoplastic. Mechanical damage can therefore be avoided, and fibers are evenly distributed in products made using injection processes. In addition, the mechanical strength of the end product is improved because the fibers are longer. Different sizes can be used for this glass roving, and it is suitable for resin systems such as nylon, polycarbonate, acetal, and thermoplastic polyesters.
-
(a)
-
3.
Multiaxial woven preform full-thickness stitching is a type of reinforcement achieved using lay-up and stitching techniques and can significantly improve the impact properties (see Fig. 2.51).
Fig. 2.51 
Reinforced preform production using lay-up and stitching techniques

-
(2)
Carbon fibers
-
1.
Development of large-tow carbon fibers. Most of the carbon fibers produced are 3 K and 6 K; 12 K is generally the largest one produced globally. The trend in carbon-fiber development is to produce larger-tow fibers. At present, many companies are working on large-tow carbon fibers, for example, 24 K fibers are being produced by the Toray Company of Japan, and carbon fibers larger than 48 K such as PANEX33-0160 (160 K) and PANEX33-0320 (320 K) are being produced by Zoltek in the USA. Zoltek considers that the use of large-tow carbon fibers decreases costs without affecting applications. Five additional carbon-fiber production lines have been installed and produce 48 K or more carbon fibers, with an annual output of 450 t.
-
2.
Use of acrylonitrile textile strands: The carbon precursor is a key factor in carbon-fiber production. Toray and Toho in Japan and American Hercules in the USA all produce carbon fibers using special acrylonitrile strands. The techniques used for strand production are secret. The techniques have not been transferred, nor are the strands sold.
Zoltek recently made an important breakthrough in research on the use of acrylonitrile textile as a carbon-fiber precursor and produced PANEX33 carbon fibers equivalent to T300. In December 1995, Zoltek purchased the Magyar Viscosa Company, an acrylonitrile textile precursor producer, and researched the use of acrylonitrile textile as a precursor in carbon-fiber production.
The price of the acrylonitrile textile precursor is only one-quarter that of special precursors, which reduces the price of carbon fibers by a large margin.
The properties of the carbon fibers produced by Zoltek using the textile precursor were equal to those of T300, but its price was only half that of T300 fibers.
This was pioneering research in the carbon-fiber industry and represents a milestone in the development of new techniques for carbon-fiber production.
-
(3)
New reinforcements
-
1.
Super-high-performance PBO (polybutadiene) [20]: PBO is a high-polymer fiber that was commercialized in 1991 (trade name ZYLON). PBO is a heterocyclic aromatic polyimide and has high potential for use in a range of applications. PBO is superior to both organic and inorganic fibers in terms of thermal stability, specific tensile modulus, and specific tensile strength. The physical and mechanical properties of PBO are shown in Tables 2.49 and 2.50.
Table 2.49 PBO thermal properties Table 2.50 Comparison of PBO performance with those of other high-performance fibers The data in Tables 2.49 and 2.50 show that PBO has four superior properties, i.e., high strength, high modulus, and good heat and fire resistances. As shown in Table 2.49, the heat resistance of PBO is so high that its pyrolysis temperature is 650 °C, based on thermogravimetry in air, and its weight is unchanged within 100 h at 316 °C. PBO does not melt, even at high temperatures, and its operating temperature is up to 330 °C. The physical properties of PBO are approximately twice as good as those of Kevlar 49. PBO plain fabrics do not shrink in vertical burning tests, and there is no residual fire. The flexibility is basically unchanged when the fire is removed. The properties of PBO are similar to those of inorganic fibers, but they are less brittle and have better bending resistance. PBO is therefore widely used in short or chopped fibers, textile yarns, mats, and fabrics.
Currently, research is being performed globally on the processing, structures, and performances of composites reinforced with PBO, including research on fiber-finishing methods and its effects, interfacial behavior between fibers and different matrices, composite fracture mechanisms, and applications. The properties of PBO fibers are considered to be superior to those of other polymer fibers.
-
2.
Basalt continuous fibers: Basalt fibers are made by milling natural basalt ores in a tank furnace at high temperatures, i.e., 1450–1500 °C, and pulling through bushing wells. Compared with glass fibers, basalt fibers have high mechanical strength, low electrical conductivity, good heat resistance (their properties are unchanged at −260 to 700 °C), good acid and alkali resistance, good sound-proofing, heat insulation, and dielectric properties and are lightweight. Their properties are compared with those of E-glass fibers in Table 2.51.
Table 2.51 Comparison of properties of basalt fibers and E-glass fibers Basalt-fiber production does not produce waste gases, wastewater, and waste residues; therefore, basalt fibers are a cheap, high-performance, and clean material. Basalt-fiber-reinforced composites compare favorably with S-glass- or aramid-fiber-reinforced composites in many ways.
China is rich in basalt ores. Because of the outstanding properties of basalt fibers and their composites, plentiful resources, and wide applications, the prospects for their increased use as twenty-first century materials are good.
2.4.2.2 Radiation Curing Techniques
In recent years, many curing processes have been introduced, e.g., X-ray, laser, electron-beam (EB), microwave, and UV-curing methods. These methods all have their own advantages and disadvantages. Low-energy EB and UV-curing methods are the most attractive.
-
(1)
EB curing
EB curing uses high-energy electrons or uses X-rays to generate electrons, to initiate polymerization and cross-linking reactions. This composite-curing technique was developed in the 1980s and 1990s. Its use has grown rapidly, and it has good potential.
EB curing has the following advantages.
-
1.
Low cost: Its cost is 25–60% lower than that of thermosetting.
-
2.
Fast curing: It is 10–1000 times faster than thermosetting.
-
3.
Precise dimensions: No heating is needed for EB curing; therefore, it is free from thermal stress and avoids the drawbacks of tooling deformation.
-
4.
Low porosity, shrinkage, and water absorption: The porosity ratio is less than 1%, the shrinkage ratio is about 2–3.5%, and water absorption is less than 1% after boiling for 48 h for most epoxy composites cured using an EB.
-
5.
Low energy consumption: EB curing is energy saving, and the energy consumption is only 1/10–1/20 that of curing using an autoclave.
-
6.
Good properties at low temperature and during thermal cycling: The composite properties are stable when they are subjected to low temperatures and during thermal cycling.
-
7.
Long shelf life at room temperature if not exposed to sunlight and UV radiation.
-
8.
Low toxicity: Because EB curing is performed at room temperature, no toxic hardeners are added to accelerate curing and save time. EB therefore reduces the use of materials that are toxic and harmful to human health and the environment.
-
9.
Low-cost molds: The molds are 60% smaller than conventional molds and are easily made.
EB curing is suitable for free-radical and positive-ion resin curing.
Free-radical-cured resins are high polymers with terminal double bonds, e.g., epoxy acrylic acids and epoxy acrylic esters. When an acrylic ester system is cured using an EB, the EB not only causes polymerization of the double bonds of the acrylic ester but also causes free-radical cross-linking and reactions with acrylic acid groups. The disadvantages of this resin system are a low glass-transition temperature, low modulus, high moisture capacity, and high curing shrinkage (8–25%).
In positive-ion-cured resin systems, positive-ion initiators such as organic salts, aromatic sulfonium compounds, and iodine matte are added to an epoxy resin. This resin system is compatible with thermosetting composite processes (e.g., hand lay-up, RTM, VARTM, and fiber winding). EB-cured products have low porosity (no more than 1%), moisture content (no more than 1%), shrinkage (2.2–3.4%), and a high glass-transition temperature and are compatible with polyimides; they retain their good performance at low temperatures and during thermal cycling.
The EBs used for resin curing can be classified into three types based on the accelerator power and energy:
-
1.
induced type, i.e., low energy (1–3 meV), high power (7–100 kW);
-
2.
linear type, i.e., medium energy (4–5 meV), high power (50–150 kW)
-
3.
radio frequency type, i.e., energy 4–10 meV, low power (0.2–5 kW)
A comparison of the performances of epoxy resins cured using an EB and heat is shown in Table 2.52.
-
(2)
UV-curing techniques
UV curing is only suitable for composites consisting of transparent reinforcements and resins, e.g., glass-fiber composites. Use of a combination of UV curing and processes such as hand lay-up, spray-up, filament winding, and pultrusion can improve the product performance, lower costs, and reduce environmental contamination (by reducing styrene emissions).
2.4.2.3 Latest Progress in Open-Mold Processes
In polymer-based composite techniques, hand lay-up, spray-up, and filament winding are considered to be open-mold processes. Such processes result in volatiles passing continually into the air from the resin, leading to environmental pollution and serious health hazards. In recent years, much research has focused on solving these problems and has achieved good results [21, 22].
-
(1)
New type of low-volatile resin and gel coating
The Neste research technology group developed and patented a low-volatile process based on a unique unsaturated polyester. The polymer has an end group that is chemically compatible with styrene. Gel coatings formulated using this polymer cut monomer use by 30%. Tests showed that released volatiles were reduced by 50% during spray-up, but the properties of the final products were unchanged or improved slightly.
The PEAR thermosetting resin produced by Ashland has excellent processing properties, without volatile emissions and gas release, and the curing shrinkage is only 0.8%. Scott Bader, a polyester supplier in the UK, developed a new gel-coating resin with 66% less styrene volatiles than a typical coating, which is 80% less than for hand lay-up laminates and 50% less than for spray-up.
At present, many resin manufacturers are providing various low-styrene polyester and vinyl ester resins, e.g., the Hydrex LS series, D10 N VPC 7100, CoREZYN VEX 201-307, and H839-ECA.
-
(2)
Spray-up equipment with low-styrene emissions
To meet the requirements of EP regulations, spray-up equipment manufacturers have developed many new techniques such as fluid impact techniques, air aid cover techniques, and low-pressure and non-atomizing techniques, aimed at reducing atomization caused by the spray gun during processing. The resin and catalyst are efficiently mixed by optimizing the design of the gun and nozzle so that air covers and shields the spray flow to prevent resin and catalyst particle dispersion into the air. Spraying at lower pressure than atomizing and improving the spray pattern between the gun and the mold results in the nozzle spraying a fluid fan, with lower levels of fumes, emissions, and overflows. The use of non-atomizing techniques is a growing trend in spray-up processes.
-
(3)
UV curing
Commercial UV-cured resins are available in domestic and overseas markets. Their features include fast curing on exposure to sunlight or UV radiation (a couple of minutes), a short profile time, lower cost, and less environmental pollution. UV curing is already used in hand lay-up and filament winding.
2.4.2.4 Latest Progress in Closed-Mold Process
During the past few decades, especially in recent years, much progress has been made in the use of closed-mold processes. RTM and related techniques are considered to be important.
Much research has been performed to increase the use of RTM and overcome its limitations, resulting in increased use of RTM and development of a mature complete system of materials, processes, and theories. The latest progress is described below.
-
(1)
Multiaxial fabric preform technique
The main preforms are 2D and 3D fabrics, and 2D and 3D woven fabrics, especially multiaxial woven, full-thickness stitched (lay-up plus stitching, the preforms are laid down in desired ways and then stitched together), and OC-molded woven mats (including a woven core, two layers of chopped strand mat, and continuous reinforcement). Preform manufacture by filament winding can significantly improve the composite impact resistance.
-
(2)
Use of various blenders to broaden resin applications
Various types of blenders and heating highly viscous resins to the temperature needed for RTM and air bubble release enable the wide use of RTM to produce high-performance composites.
-
(3)
Obtaining high glass content with compacted reinforcement and vacuum assistance
-
1.
Thermal expansion RTM (TERTM): The mold is assembled inside the preform, and then the mold and preform are heated, with simultaneous resin injection. The mold expands to compact the parts accordingly.
-
2.
VARTM: In this method, the resin is absorbed into the RTM mold using a vacuum. It gives low porosity and a high glass content.
-
(4)
Monitoring resin injection and curing using computer simulation
New computer-assisted engineering software has been developed and used to predict and control resin flow in the mold cavity. Computer analysis is used to display material loading in the cavity. This prediction and control system is used to monitor and control processing parameters.
-
(5)
Vacuum bag and soft-film techniques
Resin film infusion (RFI) and Seaman’s composite resin infusion molding process (SCRIMP) are the most notable developments.
-
1.
RFI: A precatalyzed resin sheet is loaded into the mold, and then the dry reinforcement is laid over it. The mold cavity is sealed with a vacuum bag. The mold is heated and evacuated at the same time. The melted resin impregnates the reinforcement (generally from the bottom to the top) and cures it (Fig. 2.52).
Fig. 2.52 
Resin film infusion
For thicker laminates, several dry fabric and resin film plies can be used (semi-cured resins are also acceptable). This process is suitable not only for vacuum bags, but also for matched dies, pressure bags, and autoclaves.
The film infusion method has many advantages over RTM: (a) a short infusion path, even resin distribution, suitability for resins of high molecular weight, and a short production cycle; (b) low porosity; (c) large and thick laminates can be molded quickly and economically; (d) low reject rate and consistent quality; (e) low cost; and (f) high-performance products.
Hexcel Composites and SP Systems are now bringing RFI processes to market under the brand names HexFITTM and SPRINTTM, respectively. Figure 2.53 shows a cross section of the SPRINT CBS.
Fig. 2.53 
Cross section of one ply of SPRINT CBS with alternative surface veil
The British company TVR, a racing car manufacturer, used SPRINT for its Tuscan racing car (200 mph). RFI is attractive for making large and high-performance composite parts.
-
2.
SCRIMP: This is a patented technique; its most prominent feature is provision of a system for controlling resin flow (a reusable resin diversion slot or pipe), and a distribution system based on dry glass impregnation. The process basically involves loading the dry reinforcement into a mold, making the preform parts, sealing with a vacuum bag, evacuating the mold to reduce the material volume, and delivering the resin from drums into the mold through an inlet and resin feed channel to wet the reinforcement quickly. A typical SCRIMP setup is shown in Fig. 2.54.
Fig. 2.54 
Typical SCRIMP setup
The merits of SCRIMP are (a) a high fiber content (60–70%); (b) low-volatile emissions (less than 10 × 10−6); (c) it is almost void free; (d) high specific strength; and (e) good process reproducibility.
SCIMP has been used in yachts, and parts of buses and trailers. The weight of a bus body of length 9.1 m produced using SCIMP is 30% less than that of a steel structure of the same size.
A catalyzed resin is drawn from drums through the inlet along the resin diversion slot into the bag and completely impregnates the lay-up (courtesy of TPI Technology Inc.)
The vacuum infusion process (VIP) is a further development of this process. A grooved surface on a PVC foam core is used to distribute the resin through dry glass reinforcements under vacuum. Yacht hulls of length 37.5 m have been molded using this process.


2.4.2.5 Fiber Placement
Fiber placement is a complex and unique process based on filament winding and tape placement, combining the merits of these two processes.
In the fiber placement process, a single fiber is gathered up to a band and the band is made into a prepreg on the unit. Tows are pulled off spools and fed through a fiber delivery system into the fiber placement head. The prepreg is laid down on a mandrel or mold surface.
A fiber placement unit (Fig. 2.55) is similar to a fiber-winding machine; it has five to seven axes and one placement head, which consists of parts such as a cutting band, clamp mechanism, and reset compaction roller. Its motion mechanism is similar to that of a filament machine.

Fiber placement head
Fiber placement differs from filament winding and tape placement and does not lay-up the band along the geodesic on the mold. The width can be controlled precisely. Each single band can be placed individually. The placing thickness can also be adjusted. In addition, fiber placement usually avoids delamination because filament winding compacts the band on the mold by way of the head.
The advantages of fiber placement are (1) precise control of layer thickness; (2) in-process consolidation; (3) low porosity; (4) placement at any angle; and (5) low in-process scrap.
A comparison of fiber placement, filament winding, and tape placement is shown in Table 2.53.
2.4.3 Development Trends in Polymer Composite Use in Industry
Polymer composites face many new opportunities and challenges in the twenty-first century. There is a huge potential market for polymers in the repair, reinforcement, and renewal of infrastructures, exploration and applications of energy resources, and marine offshore oil production and transportation. However, their high cost makes them less competitive than conventional materials. Low reliability, unstable qualities and properties, inconsistent and incomplete data, and incomplete data sets make designers and end users apprehensive about their applications. Polymers are difficult to recycle, and they need to conform to higher environmental standards since Japan and Europe have legislated to limit VOC emissions and waste disposal. Reducing pollution is now an urgent issue.
Based on the diversity of material demands and the merging of materials and functions, energy-saving strategies, population growth, and the need to protect the environment and achieve sustainable development, future polymer-based composites must be cheap, high-performance, multifunctional, intelligent, and compatible with environmental standards.
2.4.3.1 Development of Low-Cost Manufacturing Techniques
High cost is still an obstacle to the further development and wider application of polymer composites, although they are used widely in various industries. Extensive and comprehensive development studies have been conducted. The progress made is summarized below.
-
(1)
Low-cost raw materials [23]
The reinforcement account for more than 60% of a polymer composite, so reducing the reinforcement cost is a key point. This can be achieved by actions such as glass-fiber manufacturers developing larger furnaces and larger tows, and carbon-fiber manufacturers taking measures to enhance production volume. Large-tow production, especially using acrylonitrile textile strands, can reduce costs by a large margin.
-
(2)
Mechanized and automated processes
Hand lay-up, including spray-up, still represents a large percentage of all processes used, especially in developing countries. Hand lay-up suffers from low productivity, severe pollution, and inconsistent quality. Mechanized processes such as filament winding, pultrusion, SMC, and RTM have advantages such as high efficiency and consistent quality.
In recent years, optimized RTM and fiber placement techniques have been used to obtain high-precision products and high glass contents. Appropriate placement, low porosity (even zero porosity), and simpler processes, resulting in lower production costs, are significant. The development of RTM, pultrusion, and fiber placement are considered to be important in the twenty-first century.
-
(3)
EB and low-temperature curing techniques
EB curing and low-temperature curing have advantages such as short curing times, low cost, low energy consumption, and low mold requirements, and therefore they increase productivity and reduce production costs.
-
(4)
Integration of design and manufacturing techniques
Integrated computer-aided design (CAD) software can be used to design, analyze, and manufacture products using a simulated prototype. The integration of design and manufacturing techniques enables further mechanization and automation of polymer composite production. It has been reported that filament-wound products designed using CAD and FEA and produced using advanced winding machines require 20–30% less raw materials and have a 70% shorter production cycle. The integration of design and manufacturing techniques can improve the product quality, reduce raw material consumption, and shorten the production cycle, by enabling precise design and production. The target of lower costs can therefore be achieved.
Integrated design and manufacturing techniques were a milestone in the development of the advanced composite industry during the last 10 years of the twentieth century, and the core of new polymer composite technology.
2.4.3.2 Compatibility with Environment
Most polymer composite matrices and FRPs are thermosetting polymers, more than 70% of which are unsaturated polyester resins. Toxic volatile emissions during production and the difficulty of waste recycling are therefore problems. In the early twenty-first century, work began on green composites. Currently, developing models of FRP/composite industry pollution, more environmentally friendly closed-molding processes, materials that are environmentally benign, awareness of the requirements of international environmental laws, developing methods for the recovery, reuse, and recycling of composites, and drawing up plans for industry applications are hot topics and are high on the research agenda. Future research trends include:
-
1.
low-volatile techniques, innovative low-volatile resins, non-atomizing fogless spray-up systems, and UV-curing techniques;
-
2.
closed processes, including RTM, RFI, VARTM, and SCRIMP;
-
3.
thermoplastic matrix materials;
-
4.
natural fibers and degradable composites.
2.4.3.3 Trends in Development of High-Performance, Multifunctional, and Smart Materials and Products
The development of materials that are high performance, multifunctional, and smart relies on progress in industrial production techniques, materials, and material development from the low level to the high level, based on complex materials. This can be achieved using combinations of polymer composite processes to form super-combinations or super-hybrids; for example, the reinforcement of high-pressure FRP pipes by adding steel strips improves not only the pressure that they can withstand but the wall thickness; FRP tanks based on nanocomposite technology have good corrosion resistance and no scale deposits. New applications usually require the integration of high-performance and multifunctional materials or products. Applications of super-hybrid products consisting of plastics, and metals are becoming more widespread (e.g., for compressed natural gas cylinders). Super-complexation is an important method for obtaining high-performance, multifunctional, and smart polymer composites, and this method will broaden the application scope of polymer composites.
Much good, basic work has been done in the study of smart materials. For example, optical fibers are used in composite windmill blades in offshore wind-energy projects, and optical fiber sensors can monitor the real-time performances of the blades during operation so that costly overhaul and maintenance is minimized.
2.4.3.4 Development Trends in FRP Industry
Since they were first reported more than 50 years ago, FRPs have evolved from new materials into conventional ones and the performance of the FRP industry is strengthening in the intense competition with traditional materials such as metals, stone, wood, and concrete. Large-scale products and integration are the development trends in the FRP industry, e.g., large cooling towers (37.3 m wide, 11.3 m long, and 9.1 m high), chimneys (5 m in diameter, 187 m in height), wind turbine rotor blades (55 m long), and large-diameter GFRP mortar (3.2 m in diameter). Large and integrated FRP products are in demand for technological processes in all sectors and are also effective in enhancing productivity and quality, and reducing costs.
Other trends are precise manufacturing techniques and stable-quality products. Along with the fierce competition in industrial sectors, other customers are demanding better quality, appearance, makeup, and decoration of FRP products, and only products that are precision processed and of stable quality are competitive in the market.
Higher production efficiency, large-scale production, and lower costs are necessary for the continuing existence and development of the FRP industry. The achievement of high-speed, large-scale, and low-cost production will enable FRPs to compete effectively with traditional materials and broaden and strengthen their applications.
2.4.4 Development Potential of Polymer Composites
2.4.4.1 Development Potential for Infrastructures
Infrastructures such as bridges, tunnels, highways, railways, dams, water-work plants, power stations, and ports are necessary and basic installations for national economic growth. At present, many infrastructures such as bridges are faced with structural problems caused by overloading, varied functions, and decreases in strength caused by corrosion.
In recent years, polymer composites reinforced with carbon, aramid, and glass fibers have played major roles in the building, reconstruction, consolidation, and repair of infrastructures.
Extensive research has been performed worldwide, and much success and progress have been achieved. Research and prototype projects have shown that composites have the following advantages:
-
1.
high strength and rigidity, low weight, and less additional weight resulting from repairs;
-
2.
easy construction on site and efficiency four to eight times higher than that of steel;
-
3.
a wide range of applications, and no changes in the shape and appearance of the original structures;
-
4.
good chemical corrosion resistance and good weathering ability;
-
5.
low cost, e.g., a cost reduction of about 20% of total costs compared with previous methods.
Table 2.54 shows a comparison of some repair methods made by Japanese researchers.
Composites have been used for the following:
-
1.
reinforcement and repair of concrete, steel, and cast-iron structures;
-
2.
whole composite structures (bridges);
-
3.
concrete-reinforced bars;
-
4.
outside skins for steel or concrete structures;
-
5.
composite structures with bonded steel.
The successful use of composites, especially optimized super-complex structures made using steel, concrete, and composites, will bring revolutionary changes in architectural design, function, cost, service life, and repair. Composites are considered to be an important building material in the twenty-first century.
The American SPI Association estimated that 75,923 bridges, 8794 high dams in danger, and 10,131 water-disposal plants need to be consolidated, repaired, and rebuilt in the USA.
In Europe, more than one-third of 100-thousand rivet steel railway bridges are in need of consolidation to enable them to bear heavy trucks and express trains.
China has made extensive use of concrete engineering. In recent years, the Chinese government has invested considerable money in projects such as express trains, and many railway bridges need repair and consolidation.
New infrastructure building and maintenance worldwide will lead to the need for robust composites and important applications.
2.4.4.2 Development Potential in Transportation
The demand for resin matrix composites in transportation is high. The resin composites used in cars, express trains, light-rail vehicles, and other means of transport account for more than 30% of the total output of composites. Developed countries have established regulations to limit vehicle gas consumption rates, exhaust pollution, noise, and vibrations, and to increase safety and comfort. This has prompted vehicle manufacturers to use new designs and materials. Composites are used in automobiles to reduce weight and energy consumption, improve productivity, lower costs, and enable easy model modification. In the USA in 1998, thermosetting composites were used in more than 10 million vehicles and 510 types of parts. Composite parts include cover shells and bodies, driving shafts, bumpers, leaf spring hoods, CNCs, seat frames, heavy truck chassis, and brake disks. The amount of composites used in the automobile industry is rapidly increasing annually; the use of thermoset SMC and thermoplastic GMT is growing fastest.
The trend in the automobile industry is to use lightweight structural materials to replace steel. Use of a composite car body and chassis instead of steel can reduce the weight by 68% and reduce gas consumption by 40%. The advantages of carbon-fiber composites in the automobile industry are (1) low weight; (2) design and profile flexibility; (3) good chemical resistance; (4) modified damping; and (5) low investment. The use of carbon composites in the automobile industry is expected to grow. Design results show that 113 kg more carbon fibers could be used in a typical car. To meet the demand for this in North America alone, the need for carbon fibers will be up to 100 times the present total global capacity. At present, carbon prices limit carbon-fiber use in large amounts in the automobile industry.
Experts predict that growth in the use of polymer composites in automobiles will accelerate, and they have good prospects for the future.
The use of polymer composites in metroliners, subways, light rail, and other transport applications is also growing rapidly. Traffic networks consisting of subways, elevated light railways, and urban railways have become an important part of solving the problems associated with the increases in metropolitan traffic caused by rapid growth in the economy and urban populations, the expansion of cities.
In Japan, window frames, side window sills, decoration, and ceiling air conditioners in all carriages on the Shinkansen line are made of SMCs because they are lightweight, esthetically pleasing, heat resistant, and dew proof.
In Europe, polymer composites and SMCs are also widely used in railways. Switzerland, Germany, Italy, and the UK have developed carbon-fiber train carriages and locomotives. The main uses of polymer products in railway facilities and indoor decoration include cable conduits, third rail covers and brackets, side-walk grids, fence grids, anti-noise panels, carriages, doors, wall panels, ceilings, and floors.
In 1998, there were over 100 thousand passenger trains, and more than 6300 new carriages were produced per year; 80% were used in freight and suburban lines. There is a demand by European railways for metroliners and luxury trains such as the French TGVS, Swedish bullet trains, and Austrian and German “Restaurant Trains.”
In Europe, tramcar and light-rail traffic networks have been built in over 100 cities, half of them located in Germany. The demand for railway carriages is therefore increasing. In addition, new robot subways are under construction or new subways are being built in many countries.
Recently, China has accelerated train construction, built faster trains, and reconstructed and built new high-speed railways. In 10–20 years, subways and light railways will be built in many cities. The polymer composites used in the communications and transport industries are finding new market opportunities in transportation.
2.4.4.3 Development Potential in Offshore Oil Extraction Industry
Along with advances in the petroleum industry, especially the requirements for unattended platforms and minimum facilities, the use of polymer composites in offshore oil exploration has significantly accelerated in recent years.
In oil and natural gas exploration, the weight, cost, and performance of a platform system are the primary factors in deciding its economic viability, safety, and reliability. Another key point is whether composite pipes can be used instead of steel ones. For platforms, the component parts used and installation costs depend on the platform weight. In terms of weight, composites are preferable to metals because of their low density. The use of composites in water-disposal systems on platforms or the raisers under the platform reduces the system deadweight by 50–60%, and sometimes by up to 80% in some special cases.
The main contributors to the cost of component parts for platforms are materials and installation. A comparison of the costs of typical materials used in offshore operation showed that the cost of a GRP pipe is equivalent to that of 316 stainless steel pipes and nearly six times that of carbon steel. If the installation costs and material weight are considered, the cost of a GRP pipe is close to that of carbon steel. Assuming that the cost of carbon steel is 1, then that of the GRP pipe will be 1.1; those of stainless steel, Cu/Ni 90/10 alloys, and high Mo alloys will be 1.55, 1.80, and 3.7, respectively.
Because seawater is highly corrosive, an FRP replacing carbon steel must have good chemical resistance. Test results showed that resin matrix composites retained 80–90% of their strength and rigidity after immersion in seawater for 5–10 years. In particular, the hoop stress value in a short-time bursting test of an epoxy resin FRP pipe used for crude oil and natural gas containing seawater was unchanged after 20 years, whereas the service life of a carbon-steel pipe was only 1–5 years.
At present, resin matrix composites are used in most platform structures. For example, in the Mars tension leg platform (TLP) in Mexico, resin matrix composites were used in 1.6 × 10⁴ m2 FRP lattice panels, a riser tensioner, lifeboats, a high-pressure vessel, torque shafts, component parts, sealant units, and fire and blast walls. FRP pipes installed in the Mars TLP as fire piping and a sewer system enabled reduction of the maximum weight by 72.6 t. In Ram-powell, which is the same type of TLP as Mars, an advanced composite material energy vessel was used as a tensioner in the production riser. The vessel consisted of carbon/glass epoxy resin composites, a 316 L stainless-steel shell, and a high-density polyethylene liner. The composite vessel dimensions were outer diameter 44 cm and length 209 cm, and it weighed 165 kg, which is one-third that of the steel vessel.
The offshore use of polymers reinforced with carbon fibers, aramid fibers, and glass fibers, or hybrid-reinforced polymers is growing rapidly.
It is estimated that there are 6100 platforms around the world and more platforms are being designed. The use of polymer composites at a water depth of 609–1220 m is considered to be economical, and their use below 1220 m is technologically feasible. It is estimated that in 10 years the offshore applications of polymer composites will enter a new stage, and the potential market is large.
2.4.4.4 Potential Use in Electrical Energy Applications
-
(1)
Wind power
Wind is a sustainable energy source; it is renewable, does not cause pollution, and has large and widely dispersed sources. In the past 10 years, the average global growth rate in total wind-generated energy was close to 40%. In 2002, the total wind-generated energy was 31,128 MW, accounting for only 0.4% of global power supplies [24, 25].
The blades are the most important components of windmills. Because of the special needs of wind power, the blades have to be high strength, corrosion resistant, lightweight, and long-lived. Blades made of polymer composites reinforced with glass fibers and carbon fibers are generally used worldwide.
At present, FRP blades are mainly produced using hand lay-up, VIP, VARIM, SPRINT, and filament winding. Carbon composite blades of length up to 56 m have been produced, and carbon composite blades of length 61.5 m are being developed. The lengths and masses of FRP blades for different powers are shown in Table 2.55.
The mass of a 31-m FRP blade is 5 t and that of a 50–60-m FRP blade is 20 t. Thousands of blades are needed for only one wind farm; therefore, composites are in great demand.
Energy demands and the need for environmental protection are the motivation behind the rapid growth in wind energy. In Europe, the German government plans to increase the percentage of total energy produced using wind power from 3.5% to 25% by 2025. Denmark plans to use wind power to generate 50% of its energy by 2030. France planned to increase its use of wind power three- to sixfold in 5 years the total wind power generated would be 10,000 MW. The US Energy Sources Department estimated that annual wind power generation is 6000 billion and accounts for 20% of general power. Wind power sources in China represent approximately 1.6 billion kW, and exploitable wind power generation is nearly 250 million MW. Wind power will approach 20% of global power. Wind power has great promise.
-
(2)
Potential applications in power infrastructures
Composite poles have been used for electrical utilities for over 10 years. The poles are generally used for transmission lines, telephone lines, and lighting circuits in mountainous and hilly areas, and corrosive environments such as industrial parks and coastal regions. In the past, poles were made by pultrusion, filament winding, and centrifugal casting and classified as grade 3, 4, or 5; the length was generally 20 m. Recently, the Strongwell Corporation in the USA produced a tapered pole of length 20–24.4 m and classified as grade 1 or 2, with pultruded panels assembled using a proprietary method. Recently, FRP poles manufactured using an innovative process have been used as ideal alternatives to wooden, steel, and concrete pole. In the USA, there are about 21 million miles of power transmission lines and 595 million poles (28.5 poles/mile on average) and the wooden poles used in the aged distribution system need to be replaced yearly.
Composites are used in electrical applications because they have the following advantages.
-
1.
Low weight: The weight of a composite pole is only one-third that of a wooden one. They can be installed manually or using small pieces of equipment, which reduces installation costs.
-
2.
Non-conductive: Compared with reinforced concrete poles, composite poles have better insulating and anti-thunderbolt properties.
-
3.
Non-toxic: Unlike wooden poles, composite poles do not need anti-corrosion treatment with toxic chemicals; this avoids environmental pollution and decreases costs.
-
4.
As the amount of forest decreases, lumber prices will increase. In contrast, composite prices will remain relatively stable and will decrease with improved techniques and processes.
Several factors are increasing growth in the global power market. One factor is that existing aged infrastructures are approaching the ends of their service lives and need to be replaced. Another is the migration of populations to cities and the accompanying increased power demand. Global industrialization is also increasing power demands. A combination of these factors means that countries worldwide will have to increase power output as a priority, resulting in growth in the use of composites in poles, insulator cores, cross-arms, brackets, and other elements of power infrastructure.
(Sections 2.1, 2.2.4.1, 2.3, and 2.4 were translated by Baifeng Yu; 2.2.1–2.2.3 and 2.2.4.2–2.2.4.6 were translated by Linwen Zhang, Liang Yang, and Yong Shi.)
References
Qian ZP (ed) (1998) Foam plastics. Petroleum Industry Press, Beijing (in Chinese)
Chen XB et al (1999) High performance resin matrix. Chemical Industry Press, Beijing (in Chinese)
Liang GZ, Gu YJ (2000) Compression molding technology. Chemical Industry Press, Beijing (in Chinese)
Chen F (2003) BMC molding plastics and its forming technology. Chemical Industry Press, Beijing (in Chinese)
Ha B (ed) (2002) Filament winding technology. Science Press, Beijing (in Chinese)
Yue HJ (1995) FRP pultrusion process and products. Science Press, Beijing (in Chinese)
Micheal FF (1992) The flexible resin transfer molding (FRTM) process. Sample J 28(6):15–57
Wang ST, Yang XZ et al (1997) Resin-based composite materials. China Building Materials Industry Press, Beijing
Ouyang GE, Ou GR (eds) (1993) Composite material testing technology. Wuhan University of Technology Press, Wuhan
Zeng JC et al (1998) Physical and chemical properties of composite materials. National Defense University Press, Changsha
Hollaway L (1994) Handbook of polymer com-posites for engineers. Woodhead Publishing Limited, Cambridge
Charles AH (1996) Handbooks of plastics elastomers and composites, 3rd edn. McGraw-Hill, New York
Hogg PJ, Woolstencroft DH (1992) Composites Tooling II Proceedings. Elsevier, Mayfield Hause
Asia-the future for the composites market (2003) Rein-forced plastics, July and August, pp 28–30
Global opportunities reviewed at RP Asia (2002) Reinforced plastics, October, pp 20–21
Globalisation on the agenda at JEC (2003) Reinforced plastics, May, pp 38–46
How credible are the predictions? (2003) Reinforced plastics, May, pp 23–27
North America: what’s up the world’s largest composites market? (2000) Reinforced plastics, September, pp 26–32
Boron-free glass fibres-the trend for the future (2003) Reinforced plastics, June, pp 36–40
Reduced styrene content offers answer for Lse (2001) Reinforced plastics, December, pp 24–30
Reducing emissions by resin formulation (2001) Rein-forced plastics, December, pp 32–35
Low cost carbon fibres open up new applications (2000) Reinforced plastics, Buyers’ Guide. pp 10–14
Developments in composite materials for the railway industry (2003) Composites Interational, (52): 26–30
Wind energy-the fuel of the future? (2001) Reinforced plastics, Buyers’ Guide, pp 10–13
Ana S (2002) Wind power for global el-ectricity generating present and future opportunities. 47th International SAMPE Symposium, May, 12–16. pp 779–793
Author information
Authors and Affiliations
Corresponding author
Editor information
Editors and Affiliations
Rights and permissions
Copyright information
© 2018 Springer Nature Singapore Pte Ltd and Chemical Industry Press, Beijing
About this chapter

Cite this chapter
Liu, Q. et al. (2018). Industrial Polymer Matrix Composites and Fiber-Glass-Reinforced Plastics. In: Yi, XS., Du, S., Zhang, L. (eds) Composite Materials Engineering, Volume 2. Springer, Singapore. https://doi.org/10.1007/978-981-10-5690-1_2
Download citation
DOI: https://doi.org/10.1007/978-981-10-5690-1_2
Published:
Publisher Name: Springer, Singapore
Print ISBN: 978-981-10-5689-5
Online ISBN: 978-981-10-5690-1
eBook Packages: Chemistry and Materials ScienceChemistry and Material Science (R0)