
Abstract
This paper proposes to find similarity between sign language finger spellings of alphabets from 30 countries with computer vision and support vector machine classifier. A database of 30 countries sign language alphabets is created in laboratory conditions with nine test subjects per country. Binarization of sign images and subsequent feature extraction with histogram of oriented gradients gives a feature vector. Classification with support vector machine provides insight into the similarity between world sign languages. The results show a similarity of 61% between Indian sign language and Bangladesh sign language belonging to the same continent, whereas the similarity is 11 and 7% with American and French sign languages in different continents. The overall classification rate of multiclass support vector machine is 95% with histogram of oriented gradient features when compared to other feature types. Cross-validation of the classifier is performed by finding an image structural similarity measure with Structural Similarity Index Measure.
Access provided by CONRICYT-eBooks. Download conference paper PDF
Keywords
- Sign language recognition
- World sign languages comparison
- Feature extraction
- Support vector machines
- Sign−to−sign translator
1 Introduction
Language translator from Google [1] is helping 200 million people to communicate from all over the word. Although there are many such language translators [2], the primary goal is translation of words and sentences from one language to another language. The program compares language structures instead of word or sentence features in both languages. The language is modelled through vector spaces, and the transformations happen by vector space mapping between different languages. The rate of accuracy for a 5-word conversion is around 90%. There are many such models for language converters in speech and text [3], but this paper articulates a sign language translator between multiple countries.
Vocal languages are produced by voice, and basic structure is decided by the alphabets. Every language around the world is represented by a set of alphabets, and their infinite combination produces words that convey information. But for hearing-impaired people, this is of no use. Their alternative is sign language. Sign languages are produced by finger shapes, hands location with respect to head, face and body along with facial expressions. The alphabets in sign languages are finger mapped. Each English alphabet is mapped into either five fingers (single hand) or ten fingers (double hand). The structural representation of fingers forms alphabets for sign languages.
The Ethnologue—language encyclopaedia of the world lists 6909 living languages from which only 130 are deaf sign languages. Before exploring the possibility of a Sign−to−sign translator that transforms one country sign language into another, this work focuses on identifying a similarity between these visual languages. We have carefully chosen 30 countries whose sign languages are popular, and extensive research is going on in developing machine translation of these sign languages with non-visual (glove based) and visual (video camera based) techniques. The countries are America, Mexico, India, Bangladesh, Pakistan, Sri Lanka, China, Philippines, Indonesia, Britain, France, Ireland, Spain, Czech, Estonia, Finland, Germany, Hungary, Netherland, Norway, Poland, Chile, Australia, New Zealand, Iceland, Brazil, Kenya, South Africa, Uganda and Zambia.
Visually the structural similarity between the letters can be decoded by the human brain with some efforts, but it is quite a challenge for the computer. In an experiment at our laboratory, even the humans who learned one sign language found it difficult to follow signs from another sign language. Their failure rate was 60% for other sign languages, but again this is a subjective evaluation. This visual decoding and mapping of signs to text or speech is challenging researchers for around two and half decades. For an efficient Sign−to−sign translation between countries, the following are important factors for evaluation.
-
1.
The first part is to find a similarity between 30 world sign languages using histogram of oriented gradients (HOG) features and support vector machine (SVM).
-
2.
To draw a confusion matrix for these 30 countries and to evaluate the performance of the classifier.
-
3.
The third part we used various feature extractors to test the robustness of the HOG as it maps nine bin gradient orientations into histograms making it rotation and scale invariant for small variations.
-
4.
Lastly, we plot the conversion efficiency of one sign language into another and also measure the relativity between sign languages geographically.
Liang [4] proposed moving object classification like cars, motorcycles, pedestrians and bicycle by using local shape from wavelet transform and HOG features with hierarchical SVM classification. The proposed method is tested on six video sequences for classification. The average computer processing times of the object segmentation is 79 ms, object tracking is 211 ms, and classification is 0.01 ms, respectively.
In recent years, SVM classifier with histogram of oriented gradients (HOG) features is the most popular technique for vehicle detection [5]. In real-time implementation, this is important for advanced driver assistance system applications. To reduce the complexity of the SVM, the dimensions of HOG features are to be reduced. The proposed method in [5] using SVM classifies for vehicle detection is three times faster than other algorithm in the area.
The rest of the paper is organized as follows: Sect. 2 describes the followed methodology in determining the sign similarity. Results and discussion is presented in Sect. 3 with conclusion in Sect. 4.
2 Methodology: Inter-Country Sign Language Classification
Figure 1 shows the procedure followed in this paper to investigate the similarity between basic structures of world sign languages. The experiment involves only alphabets as they are the basic structures for formation of any language. Methodology involves two phases: training phase and testing phase.

Algorithm for decoding relativity among world sign languages
2.1 Support Vector Machines
SVMs analyse data and produce binary responses for classification problem, which come under a class of supervised learning classifier models. The basic SVM classifies a two-class problem by projecting a hyperplane between data during training phase. The hyperplane is characterized by a subset of data points acting as support vectors. During training, the SVM is presented with example vectors \(x_{i} \in \Re^{n} ,i = 1{ \ldots }\,l;\varvec{l}\) training samples, to label each data sample as either +1 or -1 class label which forms the indicator vector \(y_{i} \in \left\{ { + 1, - 1} \right\}\). SVM formulates the optimization problem as a decision boundary D(x) such that
where C is a positive constant defining regularization. The terms w and b are weight and bias. \(\lambda\) is the misclassification handler. The function \(m\left( x \right):x \to \phi \left( x \right)\) maps feature vector x to a higher dimensional space. The mapping function m(x) maps x into a dot product of feature space that satisfies \(m\left( {x_{i - 1} ,x_{i} } \right) = \phi^{T} \left( {x_{i - 1} } \right)\phi \left( {x_{i} } \right)\).
2.2 Multiclass SVM
The most widely used multiclass SVM models are one vs. all (OVA), one vs. one (OVO) [6], directed acyclic graph (DAG) [7] and error correcting output codes (ECOC) [8]. OVA creates N binary SVMs for all categories where N is class number. For a nth SVM, only examples in that class are positive and remaining are negative. The computation time is less but at a compromised efficiency. OVO creates a pairwise 0.5N(N − 1) SVMs and pairwise voting to accommodate new samples for solving multiclass problems. DAG training is from OVO model, and testing is from binary acyclic graph model. ECOC disambiguates output binary codes to construct a code word matrix which is compared with generated bit vectors by selecting a row as a class having minimum hamming distance. This method gives good classification rates compared to other four at the cost of execution speed. The slower speed is due to the increased length of code words to disambiguate N classes. The minimum code word in ECOC is log2 N to a maximum of 2N−1 − 1 bits. Comparing the multiclass SVM methods from MATLAB implementation, we found ECOC performs better at optimum speeds.
The similarity measure for 30 different world sign language alphabets using computer vision model and machine learning algorithms is proposed. Experimental results show the sign language relativity between countries and continents. Validation is through human expert identification and Structural Similarity Index Measure (SSIM).
3 Results and Discussion
Experimentation with the proposed methodology aims to answer the following questions.
-
1.
How much similarity is observed between sign languages of the 30 countries?
-
2.
Does countries of the same continent exhibit more similarity than others?
-
3.
What is the overall similarity in sign language between continents of the world?
-
4.
Can a Sign−to−sign converter is possible at the image level between different sign languages of the world?
The captured sign images are large, and cubic interpolations trimmed their size to 64 × 64. The RGB colour images have large R (red) content and hence R plane is extracted for processing. Block thresholding within a 16-pixel block separates foreground hand regions from background. Ten features are extracted from these binary images. For each country, a feature matrix is build. The size of each feature matrix is mf × nf, where m = 26, i.e. the number of alphabets and n is variable column vector that captures feature values. f—consists of country and test subject indicator. The first problem encountered during feature matrix creation is the inability of our algorithm to control the length of n, where n is initial length of the feature vector. For each image, the length of the feature vector changes due to number of feature points detected during the feature extraction phage. For 26 different images, we have 26 different feature lengths. Feature length normalization has been challenging, as it is difficult to decide on the number of features required to produce good classification rate.
Figure 2 shows variational feature plots of each alphabet in Indian sign language. The plots also show that the feature variations are almost constant cross-features even though the number of features per sign per country changed marginally. Normalization of n through maximum feature size is done to preserve the actuals, and the remaining features are zero padded to design a constant size feature matrix. This procedure gives a fixed feature size matrix of size m × max(n).

Feature number variations of alphabets from ISL
The first part is to find the similarity between sign languages from 30 different countries. For this, the feature matrices of all countries from all feature vector models are prepared. A multiclass SVM with ECOC model is trained with one country and tested with all other countries for each feature type.
Testing results in a classification matrix or a confusion matrix between two countries. All countries’ sign languages are tested against one trained country, and cross-verification is done by testing the multiclass SVM for all other countries. The SVM is trained with single sample and tested with a different sample from our database. Multiple testing of this kind produced more or less similar results with a deviation of ±3%.
Misclassifications between the Indian signs (ISL) and Bangladesh signs (BanSL) are projected from the confusion matrix in Fig. 3. The green is Bangladesh and saffron is India. From the confusion matrix, the Bangladesh ‘E’ is classified as Indian ‘D’. A total of ten signs are misclassified using our proposed method of classification. Total 16 signs match between the two countries.

Confusion matrix between Indian sign alphabets and Bangla sign alphabets with SVM classifier
From the following observations, the similarity of world sign languages is formulated as
-
1.
Spain and German sign languages are 96% similar with 25 signs being matched in two-way training and testing.
-
2.
Mexican–Spain, Mexican–German and Kenya–South Africa are next with 24 sign matches having 92.3% similarity.
-
3.
The lowest similarity set countries are (Australia, American SL), (American, Indian SL), (Netherlands, Australia SL), (Sri Lanka, French SL), (Estonian, French SL), (Netherlands, New Zealand SL) and (Polish, Sri Lanka SL) where the matching signs in both directions range between 0 and 1. Visual verification can be made using Fig. 4 for a set of two sign alphabets ‘C’ and ‘N’.
Fig. 4 
For visual verification between sign languages of five different countries
-
4.
The reason interpreted by us for lowest and highest similarity match among sign languages of different countries depends on the geographical regions in which the country is located.
-
5.
The continentwise similarity measure is checked, and the results for one continent, i.e. Asia, is projected in the plot in Fig. 5.
Fig. 5 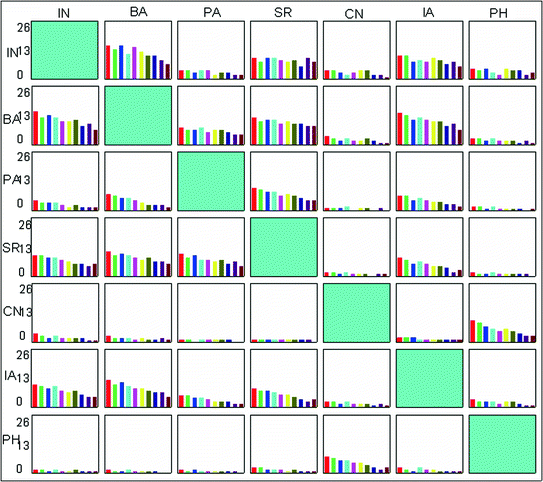
Sign language similarity measure for Asian countries


Figure 5 has seven Asian countries, namely India (IN), Bangladesh (BA), Pakistan (PA), Sri Lanka (SR), China (CN), Indonesia (IA) and Philippines (PH). The plots show histogram of matching signs with ten different types of features. Each feature representing a particular colour; red-HOG, green-SIFT, blue-SURF, cyan-MESR, magenta-BRISK, yellow-LBP, dark yellow-LSS, navy-HAARS, purple-HCORNERS, wine-FAST.
Except China and Philippines, all other countries’ sign languages show a high range of similarity of around 50–60%. China and Philippines have a high range of similarity due to their cultural influences on each other. HOG features give a high range to classifier performance compared to other features in the list during multiple instances of testing as shown in Fig. 5.
-
6.
There is high similarity between countries from same continent compared to that of countries from different continents as can be analysed.
We also explored the idea of Sign−to−sign translation as in case of spoken language translators [1]. HOG features and SVM are used for training and testing. But cross-verification of the feature vector is checked using a known image structure measurement parameter called Structural Similarity Index Measure (SSIM). A graphical user interface (GUI) is built in MATLAB to do the job. The user of the GUI can translate sign language alphabets between countries and check the similarity index (SSIM) value. The translator uses HOG features and SVM classifier for the recalling the corresponding signs. Snapshots of GUI testing are in Figs. 6 and 7.

Sign−to−sign translator between Bangladesh and Indonesia for sign D

Sign−to−sign translator between Sri Lanka and Ireland for sign B
Matching the performance of HOG+SVM with SSIM has a deviation of ±3%. The performance of the best feature for a Sign−to−sign translator with respect to structural similarity of signs is computed rigorously with nine different sets of data from 30 different sign languages for six continents around the world is shown in Fig. 8.

Performance of SVM with features used and cross-verification with SSIM
4 Conclusion
An attempt is made to find similarity between sign languages from 30 different countries based on image processing models and pattern classifiers. Ten feature extraction techniques are compared for this work. Multiclass support vector machine classified these features, and the performance of the classifier with respect to each feature is measured. Visual verification and structural verification using SSIM are preformed to validate the classifiers performance. Overall the SVM classifier registered a 95% matching with HOG feature vector and the remaining feature vectors produced less than 90% matching. A high similarity in sign languages is found in countries of same continent which are geographically close to each other. Cultural variation is also a cause for large variations in neighbouring countries having different sign languages, e.g. India and China. A Sign−to−sign translator between alphabets of 30 countries with their similarity is created and tested. This translator can be made dynamic to accept signs from various countries online and use the translator to communicate effectively by sign language users of different countries without learning other countries’ sign languages.
References
Leite, F.O., et al.: Using Google Translate© in the hospital: a case report. Technology and Health Care (Preprint), pp. 1–4 (2016)
Cheriton, D.R.: Interpreter-based program language translator using embedded interpreter types and variables. Google Patents (2016)
Huang, Y.-M., Shadiev, R., Hwang, W.-Y.: Investigating the effectiveness of speech-to-text recognition applications on learning performance and cognitive load. Comput. Educ. 101, 15–28 (2016)
Liang, C.-W., Juang, C.-F.: Moving object classification using local shape and HOG features in wavelet-transformed space with hierarchical SVM classifiers. Appl. Soft Comput. 28, 483–497 (2015)
Lee, S.-H., et al.: An efficient selection of HOG feature for SVM classification of vehicle. In: 2015 International Symposium on Consumer Electronics (ISCE). IEEE (2015)
Galar, M., et al.: An overview of ensemble methods for binary classifiers in multi-class problems: experimental study on one-vs-one and one-vs-all schemes. Pattern Recognit. 44(8), 1761–1776 (2011)
Zhang, X., Ding, S., Sun, T.: Multi-class LSTMSVM based on optimal directed acyclic graph and shuffled frog leaping algorithm. Int. J. Mach. Learn. Cybern. 7(2), 241–251 (2016)
Bai, X., et al.: Learning ECOC code matrix for multiclass classification with application to glaucoma diagnosis. J. Med. Syst. 40(4), 1–10 (2016)
Author information
Authors and Affiliations
Corresponding author
Editor information
Editors and Affiliations
Rights and permissions
Copyright information
© 2018 Springer Nature Singapore Pte Ltd.
About this paper

Cite this paper
Sastry, A.S.C.S., Kishore, P.V.V., Anil Kumar, D., Kiran Kumar, E. (2018). Sign Language Conversion Tool (SLCTooL) Between 30 World Sign Languages. In: Satapathy, S., Bhateja, V., Das, S. (eds) Smart Computing and Informatics . Smart Innovation, Systems and Technologies, vol 77. Springer, Singapore. https://doi.org/10.1007/978-981-10-5544-7_69
Download citation
DOI: https://doi.org/10.1007/978-981-10-5544-7_69
Published:
Publisher Name: Springer, Singapore
Print ISBN: 978-981-10-5543-0
Online ISBN: 978-981-10-5544-7
eBook Packages: EngineeringEngineering (R0)