
Abstract
A questionnaire is a measurement tool consisting of a list of questions accompanied with instructions, response options, and answering spaces. It guides the respondent and sometimes also an interviewer in finding and recording measurement information. As such, the questionnaire is a source document: it is very close to the source of data, the respondent. Errors at this point tend to considerably and sometimes irreversibly affect the validity of the evidence generated in the study. This chapter first deals with the response process, as a good understanding of the psychological stages of the response process can help questionnaire designers and interviewers to avoid recall error and misreporting. Second, this chapter provides practical recommendations for questionnaire design and administration. Study objectives, types of measurements planned, error-avoidance concerns (including prevention of errors in later data processing and analysis), and ethical concerns guide questionnaire design. Panel 18.1 introduces terminology used in this chapter.
Many recall questions would never be asked if researchers first tried to answer them themselves.
N.Schwartz and D.Oyserman
Access provided by Autonomous University of Puebla. Download chapter PDF
Keywords
These keywords were added by machine and not by the authors. This process is experimental and the keywords may be updated as the learning algorithm improves.
1 The Response Process
There are several psychological stages of the response process during questionnaire administration (Tourangeau et al. 2000). A common view distinguishes five stages (Schwarz and Oyserman 2001; Streiner and Norman 2008), as shown in Fig. 18.1.

Psychological stages of responding to questions
Knowledge of these stages is helpful in evaluating the usefulness of potential questions and in minimizing recall errors and misreporting. We discuss each stage in some detail and highlight sources of bias constituted by deficiencies at each stage.
1.1 Response Process, Stage-1: Understanding the Question
The process starts with the respondent reading or hearing the question and attempting to understand what information is being requested. Culture, language, and individual interpretations influence this understanding. Understanding of the question may also be influenced by ‘context effects,’ i.e., by information that appears on the questionnaire (e.g. previous questions) or by any suggestion that the researcher or the research is interested in particular types of behaviors or other characteristics. The way the question is formulated is crucial, but, in addition to the question itself, it is often the list of response options that clarifies to a respondent what the question actually means or leads them to assume a certain meaning of it (Schwarz and Oyserman 2001). Errors arising at this stage are called ‘comprehension errors,’ meaning that the respondent does not understand the question or understands it in a way unintended by the researcher. An example is an item on a questionnaire that was designed outside Africa and used in an African country. That item aimed to capture the occurrence of severe respiratory and circulatory compromise in the newborn period by asking the mother, “What was the color of the baby at birth?” The response options were ‘normal,’ ‘blue,’ or ‘white.’ The item had been imported into an African setting in which approximately 90 % of deliveries occur at a health facility were newborns are rushed off for urgent attention, without a mother observing the baby’s condition. Moreover, the only time a respondent would see a ‘white’ baby is if the parents had white skin. Understandably, the question was mostly ill understood and created a lot of confusion.
The result at the end of the response process may be that the respondent does not answer the question or that an inaccurate answer is given, and a lack of comprehension may or may not become clear to the interviewer. Not all respondents will ask for clarification when they are aware of their lack of comprehension. When it is clear to the interviewer, clarification of the question may not always succeed, as there may be cultural and language barriers. Moreover, people’s personal interpretation frameworks are not always easy to change. The implications for questionnaire design and administration, discussed later in the chapter, are multiple and include the need to phrase questions in culturally appropriate terms and in the language of the respondent. Comprehension errors may be related to personal characteristics such as education level, alertness, socioeconomic status, etc. Any comprehension errors can be sources of considerable information bias, missing data, and hence imprecision. If questions are used to assess eligibility criteria, comprehension errors can result in selection bias.
1.2 Response Process, Stage-2: Retrieval of Information
Given the respondent’s understanding of the question, (s)he will now try to retrieve the information considered necessary. Information retrieval refers to facts retrieved from memory or from external sources, such as family members’ memories, co-workers’ memories, databases, diaries, or household files. For an event or experience to be remembered or retrieved, a record of it must be available, either under the form of physical data or a stored memory. Respondents cannot be expected to retrieve facts that have never been or are no longer encoded in memory or saved as an accessible physical or electronic record. Errors arising from a deficiency at this stage of the measurement process are termed ‘encoding errors’ in psychology. When the deficiency is one in retrieving from memory, they are called ‘recall errors.’ These may again take the form, at the end of the response process, of non-response or of misreporting. They can be related to participant attributes and lead to biased estimates and decreased precision.
Forgetting is the major process leading to recall errors and hence to recall bias (See: Chap. 2). In general, experiences must be very stressful or otherwise highly impactful and infrequent to be remembered for a long time (say more than a year). Questionnaire designers must keep in mind that asking respondents to count and report a frequency of a common behavior in some defined calendar period in the past is among the most difficult tasks one can ask of a respondent. For example, the question “How often have you eaten chicken in the last 12 months?” is a cognitively extremely demanding question (Jobe et al. 1990). One difficulty with it is that people’s memories tend to relate to typical episodes in their personal history (‘the time I lived in village x,’ ‘the time I worked for employer y), rather than to the defined calendar time episodes the researcher would like to know about (Schwarz and Oyserman 2001). This inherent memory structuring helps to explain why the construction of personal history calendars as an initial part of an interview process can often enhance recall accuracy of behavioral information, especially the accuracy of event dates.
Another problem with event dating is telescoping. Forward telescoping may be the most common problem and often concerns stressful events that are remembered as more recent than they actually were. Backward telescoping happens when recent events are remembered as more distant than they actually were.
As to short- and medium-term memory, recall accuracy is commonly an object of methods-oriented epidemiological investigation, and designers of questionnaires should thus verify the available evidence in the literature about what is a reasonable recall period for the specific type of event of interest. For example, a period of 2 weeks is generally considered the maximum recall period for questions to mothers about diarrhea in their children (Martorell et al. 1976). Schwarz and Oyserman (2001) suggested that, for events that are highly memorable, recall accuracy tends to increase by decomposing the recall period in sub-periods about which separate questions are asked. In taking this approach, one should work back from more recent periods to earlier periods rather than the other way around. Recall accuracy also tends to increase when the participant is given more time to think. The accuracy of retrieved information depends on how much effort the respondent is able and willing to make to remember and/or lookup information. ‘Satisficing’ can occur at this stage, meaning that the respondent settles for making little mental effort in tracing the information. Researchers should be aware that recalling relevant behaviors from memory can be time-consuming and that satisficing may be induced by any form of pressure to speed up the response process.
1.3 Response Process, Stage-3: Inference and Estimation
Additional mental effort is often required to further use the remembered events for counting or estimating total numbers of events; estimating average (‘usual’) frequencies or intensities; comparing various events to decide about the most intense or the least intense; and calculating durations (e.g., elapsed times) or other abstractions. For these tasks, too, the respondent decides what amount of motivation and time (s)he will spend and what level of accuracy (s)he will aim for. Satisficing occurs when the task seems too daunting (hint: terminal digit preference in the reporting of numerical values can be a manifestation of satisficing).
When questions are asked about prolonged periods, such as ‘in the last year,’ one naturally remembers best the last few weeks or months. Respondents may therefore be tempted to extrapolate a current or recent pattern to a longer time span.
When questions are asked about average intensity or usual intensity of a fluctuating or recurrent subjective experience (pain, anxiety, etc.), the answer may be positively biased because respondents’ memories tend to be heavily influenced by the worst episode or the peak in experience as well as by the most recent episode (Streiner and Norman 2008).
Context effects may also influence reported past behavior. For example, in the evaluation of behavioral interventions, reported pre-intervention behavior tends to be worse when it is asked about after the intervention than when it is asked about before the intervention (Ross and Conway 1986). Another example of a context effect on inference and estimation is that respondents tend to report higher frequencies and severities of common mental-behavioral characteristics when the response options list contains mostly higher frequency/intensity options than when the list contains mostly lower frequency/intensity options (Schwarz and Oyserman 2001).
1.4 Response Process, Stage-4: Formatting the Response
The next mental process for the respondent is to prepare a response to the question in the format expected by the researcher. The major types of formats are open answer versus lists of response categories. As a concrete example of the latter, the respondent may have estimated a usual frequency of nine alcoholic drinks per day but may need to choose from a list of response options (e.g., ‘0–3’, ‘4–6’ and ‘7 or more’). Preceding options lists, there may be instructions about:
-
How to choose (e.g., ‘tick on option’ or ‘tick all applicable options’)
-
The measurement units to use (e.g., the form asks for stature in centimeters)
-
The measurement scale to use (e.g., the form asks for the number of alcohol servings rather than the number of drinks, as ‘drink’ could be interpreted to mean ‘glass,’ each of which might contain more or less than one serving of alcohol)
Satisficing can also occur at this stage, especially if the list of response options is long or difficult to read. The length of the response options is therefore important. Five to seven options are often seen as a maximum. Options in the beginning of the list tend to be chosen more often in self-administered questionnaires whereas options at the end of the list tend to be chosen more often during telephone or face-to-face interviews (Schwarz and Oyserman 2001). This implies that, except for short options lists, response options should rather be presented as separate questions.
1.5 Response Process, Stage-5: Final Editing and Communication
In the final stage of the response process, the prepared response (chosen category, value, or reply) is briefly reflected upon and then communicated to the interviewer or written (ticked, circled, etc.) on the questionnaire. The respondent may, however, decide to edit the answer before communicating it, bringing in considerations other than accuracy. These considerations may concern social desirability or fear of disclosure. For example, the respondent may think that ticking the box ‘7 or more’ alcoholic drinks per day will be seen by the researcher as abnormal and decide at the last moment, for the sake of her/his own reputation, to tick the box ‘4–6’ instead.
Social desirability motives may be pursued consciously or unconsciously. They can show as a tendency to present oneself as healthier, more adherent to treatment, more ‘normal,’ and wiser than one actually is. Reported financial income is also prone to these effects, and within a single survey, different groups of participants may edit their responses for differing reasons: lower income groups may under-report income because of anticipated financial assistance or over-report to avoid stigma, whereas wealthier participants may under-report income to avoid social or tax repercussions. Sometimes a phenomenon opposite to social desirability occurs, if a direct benefit of ‘faking bad/unhealthy/deviant’ is expected. When social desirability motives affect the measurement of an attribute, the possible consequences in epidemiological studies include social desirability bias through: (1) under-estimation of the frequency and/or magnitude of socially undesirable attributes; (2) over-estimation of the frequency and/or magnitude of socially desirable attributes; and (3) biased estimates of the strength of association with other attributes.
The so-called hello-goodbye effect (Streiner and Norman 2008) means that before an intervention some people have a tendency to exaggerate their condition in the hope of getting the best possible care, whereas after an intervention, they may tend to present themselves as healthier than they are as a form of gratitude to the health workers. The consequence for interview-based research is obviously the danger of a falsely strong observed effect of the intervention on self-perceived health or on outcomes that rely on questions about symptoms.
1.6 Personal Characteristics of Respondents Affecting Responses
1.6.1 Personal Reference Points for Judgments
Another important lesson that epidemiologists have learned from cognitive psychology and from methods-oriented research about health surveys concerns the way people rate their preferences and intensities of experiences. When asked for such information, persons may take various reference points as a basis for making their judgment (Fienberg et al. 1985). The importance of this phenomenon for research was well illustrated by Groves (1991). He asked two questions about general health [reformulated]:
-
1.
Would you say that your own health in general is excellent, good, fair, or poor?
-
2.
When you answered question-1 about your health, what were you thinking about?
-
Others of the same age?
-
Myself at a younger age?
-
Myself now as compared to 1 year ago?
-
Other
-
The frequencies of the answers to the second question were highly revealing about the general and important issue of personal points of reference for judgments.
This implies that the researcher designing a question must try to know about (or at least anticipate) possible variations in such reference points and, if necessary, to learn about them in a pilot exercise. When the variation in reference points is important, one should provide the respondent with one clear reference point, or, split the question into several questions each with a specific reference point. For example, when asking a question about self-perceived general health, as above, one could ask “When you compare your health now with your health 1 year ago, would you say that your health now is good, fair, or poor?” Yet this approach would still be less than ideal because many people do not have an accurate recall of their health status 1 year ago. Indeed, personal reference points for judgments may shift considerably over time. This has important consequences for the validity of assessing changes in subjective attributes, which as a rule should be viewed with considerable skepticism, especially when efficacy of an intervention on a subjective attribute is evaluated.
1.6.2 Personal Characteristics Affecting Response Accuracy
Inclination to satisficing or optimizing may vary individually, and so may the susceptibility to be influenced by social desirability motives or fears of disclosure. ‘Yeah-saying’ and ‘nay-saying’ mean a preference for ‘yes’ and ‘true’ answers or ‘no’ and ‘false’ answers, respectively. Many people do have a slight tendency, and some have a strong tendency for one of them. A way to minimize the effects of this is to make sure that questions are formulated such that, for the average respondent, one expects that about half of the answers will be ‘yes’/’true’ and half of the answers will be ‘no’/’false’ (Streiner and Norman 2008). ‘End aversion’ is a reluctance of many people to use the extreme options in an options list of answers. The consequence is an under-estimation of frequencies of extreme categories. A possible solution, if one wants to minimize the effects of this phenomenon is to broaden the extreme categories (Streiner and Norman 2008). For example one could use ‘always or nearly always’ instead of ‘always’ and ‘almost never or never’ instead of ‘never’. Alternatively one may conceal the true extreme categories by adding extremes of a nearly impossible magnitude that nobody is expected to choose. Finally, epidemiologists should remember that age, illness, sickness, and treatments can affect all stages of the response process.
2 Questionnaire Design
2.1 Standard Components of a Questionnaire
The main building blocks of a questionnaire are ‘items,’ which are units composed of a question with instructions, response options, and answering spaces. Items about a common theme are arranged in clearly delineated sections and linked through alphanumerical sequencing, combined with skip instructions when appropriate. In addition to the items, there may be spaces on the questionnaire that serve administrative or quality control purposes. Most questionnaires will have several onscreen or printed pages. Printed questionnaires may have one or several write-through pages attached to each numbered page (e.g., one for data entry and one for archiving). Studies may use several questionnaires administered in the same session or over multiple sessions.
Figure 18.2 shows the classical components of a questionnaire. Each single page of a questionnaire has a header section that identifies, as a minimum, the study, the questionnaire within the study (if several exist), the page number, the participant identification number, and the date of completion. Participant numbers and dates of completion may be pre-printed. Note that all instructions are traditionally given in italics. A small footer indicates the version of the questionnaire and the printing date.

Excerpt of a questionnaire form with the classical components of header section, items organized into sections, questions, answering spaces, options lists, and instructions
2.2 General Approach to Questionnaire Development
The first element in the general strategy to developing a questionnaire is to avoid anything that could confuse, bore, embarrass, or otherwise burden either the interviewer or respondent. This element encompasses (1) making the questionnaire as clear, short, simple, friendly, and attractive as possible, and (2) making all possible efforts to keep motivation high.
The second element is to account for what is known about psychological response stages and influences of personal characteristics as discussed above.
The third element is to draw from what is known already about the validity of specific questions. It is unwise to produce a questionnaire item de novo if a suitable version of the item is known to exist, has been used in other studies, and has produced reliable and accurate information, except when there are reasons to believe that a translation, update, or cultural adaptation is necessary. Questionnaire developers’ websites or organizational repositories may provide access to adapted and/or translated versions that are suited to a particular research site. For example, the developers of the ‘Strengths and Difficulties’ questionnaire hosts a website that provides details about the questionnaire and a repository of versions translated into various languages (http://www.sdqinfo.com/). Another example is the World Health Organization research tools for substance abuse (http://www.who.int/substance_abuse/research_tools/en/). More examples are given in Table 10.4. That being said, one should not assume that an item is acceptable for use and has been validated merely because it has been used in other studies.
The fourth element is to make maximal use of possibilities to promote data integrity after questionnaire filling (details discussed below).
2.3 Practical Recommendations for Questionnaire Design
Panels 18.2, 18.3 and 18.4 are checklists for the content and format of questionnaire items and for the formatting of the entire questionnaire.
2.4 Questionnaire Design Decisions to Facilitate Data Entry and Analysis
To facilitate data entry, one can consider the following options when developing a questionnaire:
-
Design the electronic data entry form to resemble the paper form as much as possible
-
Provide code lists on the form as much as possible (perhaps in italics and with a smaller font size)
-
Be consistent with codes and options lists throughout the questionnaire. Try not to use separate, different code lists for data entry: data entry persons should ideally be able to type directly what they see
-
For closed answers, use boxes with a space for each character. Mind the appropriate number of characters and the number of decimal places
-
Design the questionnaire in such a way that a data entry screen can be easily made with a similar design
-
Ask feedback from data entry persons before finalizing a questionnaire
-
Mimic interview skip patterns in data entry forms
For making the questionnaire analysis-oriented consider the following options:
-
Envisage the analysis when designing questionnaire items
-
Only collect data that will be used in planned analyses of the primary and secondary outcomes
-
If the analysis uses derived variables (computed from raw data) make sure all necessary elements for the computation are collected on the forms, e.g., data elements for socio-economic status, dates for length of follow-up, etc.
3 Types of Items in Questionnaires
3.1 Structured, Semi-structured, and Open-Ended Items
All types of items include a worded question but they differ in the way responses are recorded. A fully structured item provides a clear measurement scale on which one or more specific values can be placed. For instance, it may provide a list of response options from which one or more need to be chosen. Another example is an item that depicts a visual analog scale (Fig. 18.3), on which a single value needs to be indicated. Yet another example is an item with clearly indicated spaces to record measured height.

A visual analog scale – VAS
A semi-structured item equally represents a clear range of options, but one or more of the options trigger a sub-question, the response to which is to be recorded as free text. The item is thus only structured to a certain level. This type of item is useful when an explanation or specification is desired of a chosen option. For example “If ‘other,’ please specify: __________” or “If yes, please explain reasons: _____________.”
A fully open-ended item simply provides a dedicated open space where the respondent or interviewer can freely write a textual answer to the question. Though this text is free in principle, the open-ended item can include instructions (e.g., algorithms) to help focus the respondent on particular aspects of content or instructions to request certain restrictions in the format (e.g., length) of the response.
Questionnaires that are mostly composed of structured and semi-structured items are called structured questionnaires, and those mostly containing open-ended items are called open-ended questionnaires.
3.2 Items for Counts and Continuous Attributes
For the redaction of items for continuous attributes, most of the guidelines in Panel 18.2 are relevant. Here we will discuss some particular issues and some typical forms of items.
As to the precision and units of measurement, it would be unfair to ask respondents to report a quantity in units they are unfamiliar with, or to ask to report it with a precision that is unlikely to be remembered or traced. Thus, the item needs adaptation to locally used units of measurement and locally used precision. Several options may need to be offered if there is heterogeneity in this local tradition.
3.2.1 Respondent-Reported Measurement Values
The concept of respondent-reported includes both ‘self-reported’ and ‘reported for a child or other person.’ It is usually understood that this relates to information retrieved from memory. For example, self-reported weight and height are commonly understood to be the most recent weight and height measurement values the respondent remembers. Obviously some measurements must have been done at some point in the past, but when exactly this measurement was done, how accurate the measurement value was, and how well it is remembered and reported are unknown and highly variable. In addition, remembered values may be outdated, e.g., the respondent may have gained or lost a lot of weight since the measurement (s)he remembers.
Numerous studies have indeed shown the lack of reliability of self-reported weight and height values. In general, respondent-reported numerical values based uniquely on memory need to be avoided as much as possible. In mailed survey questionnaires or in other situations where direct measurement by an observer is impossible, it can be useful to request that respondents use additional sources other than memory. For example, the item in the mailed questionnaire could include an instruction for the respondent to trace or verify the numerical value, time or date, with the help of a diary or by looking up other written information. It may also contain a request to perform the measurement again before answering, e.g., using an available scale to measure one’s weight. Whenever different sources are possible it becomes important to include a sub-question to record the sources used (e.g., memory, documentation, new measurement, or combinations).
3.2.2 The Item for Age Determination
Age is frequently used as an eligibility criterion and also as a study variable. Errors in age determination can thus potentially lead to selection bias, information bias, and confounding. Age is a continuous attribute commonly defined as ‘time elapsed since birth.’ Age is often measured by calculating the time interval between two dates: the date of birth and the date of filling the questionnaire. Both these dates are normally recorded in epidemiological studies and can often be accurately provided by respondents themselves. Alternatively, but somewhat less reliably, one can ask the respondent directly for an age or an age at last birthday. This alternative approach is based on the assumption that respondents know their birthday, remember their age at their last birthday, and sometimes that they can calculate months elapsed since their last birthday. Some participants may have difficulty remembering or counting months. Also, not everybody is familiar with the months of the Gregorian calendar: in some societies, one rather calculates in moon cycles than in months.
Consequently, the birth date-based method is generally preferable over asking for age. It makes sense to include into the item an instruction asking respondents to verify any document that may contain the birth date, preferably the birth certificate or an identification card. The same is true if the questionnaire is to be interviewer-administered, as the interviewer can then verify the documents. In areas where such documents are not systematically available, asking for a document-endorsed birth date or an age may be helpful for some but not for all. The measurement of age in such areas should then, for some of the participants, involve an interview during which approximate birth dates are derived with the help of a local events calendar or via reference to people of the same age (e.g., former class mates) who do know their birth date or age exactly. A sub-question is then useful to distinguish participants for whom this method was applied.
3.2.3 Visual Analog Scales: VAS
A VAS consists of a line and two described endpoints representing the least possible and the most possible amount of an attribute (Fig. 18.3). There are strengths and weaknesses of this method (Streiner and Norman 2008). A VAS is generally appealing although some respondents may not find it easy to understand. The optimal wording to describe the endpoints can be a problem and a source of variation. For example, an endpoint described as ‘the worst possible anger’ may mean totally different things to different respondents depending on their experiences and imagination.
3.2.4 Ordinalized Scales
Sometimes the measured attribute is continuous but the scale for measurement is ordinalized (presented as a sequence of ordinal levels). The optimal number of levels is usually in the range of 5–7. Ordinalized scales include the following types:
-
Horizontal options lists with circles (Fig. 18.4)
Fig. 18.4 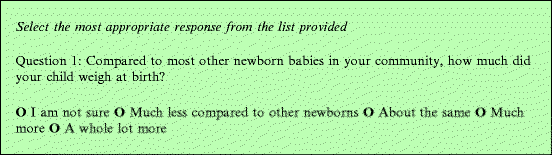
A horizontal options list with circles showing incremental values
-
Likert scales (Fig. 18.5): These are often used to measure subjective levels of agreement, acceptance, or perceived likelihood. They are characterized by the fact that there are levels of opinion in either direction away from a neutral opinion. The neutral opinion itself may or may not be mentioned as a separate level, but it usually is
Fig. 18.5 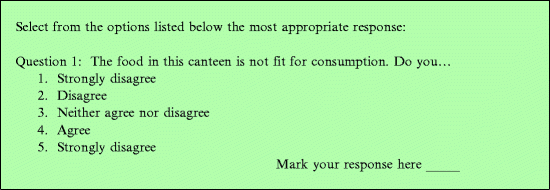
A Likert scale
-
Juster scales (Fig. 18.6) are used mostly for subjectively estimating the probability of an event. The ordinal levels are described by a numerical probability combined with a worded interpretation of that same probability
Fig. 18.6 
A Juster scale
-
Face scales (Fig. 18.7): The ordinal levels are represented by faces expressing a range of moods or of pain (Stinson et al. 2006). This makes it more feasible for children and for those with reading difficulties. Face scales can be seen as a special form of Likert scale
Fig. 18.7 
A face scale


3.3 Items for Non-continuous Attributes
For the redaction of items for non-continuous attributes, most of the guidelines of Panel 18.3 are relevant. We briefly discuss some particular types of items of interest.
3.3.1 The Item for Sex Determination
Sex is one of most frequently used variables in health research. There exist distinctions between chromosomal/biological sex, genital sex, other phenotypic sexual characteristics, sexual orientation, gender, and gender-related behavior patterns. Based on this, a small rate of mismatch is expected between respondent-reported sex and interviewer-reported sex. Respondent-reported sex and gender are expected to be more strongly correlated with each other, whereas interviewer-reported sex may be more influenced by phenotypic sexual characteristics and dress code followed. In practice, however, unless the research directly concerns issues around biological sex or gender, the mismatch will be negligible. Thus, a simple question with two response options (male/female or boy/girl) will usually be appropriate in all types of questionnaires and for all modes of administration.
Hint
Biological sex and gender are often used interchangeably, but they are in fact very different concepts. Biological sex refers principally to chromosomal patterning, where males are defined by the presence of a Y chromosome (i.e., XY, though XXY and XXYY are rare variants) and females are defined by the absence of a Y chromosome (i.e., XX, though XO and XXX are rare variants). Gender, on the other hand, is a social construct defined by behavior, actions, roles in society, and sexual orientation. Gender identification refers to a self-selected gender.
3.3.2 Items for Measuring Dichotomous Phenomena
The following types of phenomena are commonly measured:
-
Whether or not a past event, experience, or activity has occurred, e.g., by the question ‘Have you ever taken oral contraceptive pills?’
-
Whether or not a state is present or absent, e.g., by the question ‘Are you currently married?’ Note that attributes can be nested and hierarchical and that, for this reason, a particular level of one attribute may be seen as a dichotomous attribute on its own. For example, age is a continuous attribute but being an adult can be considered to be an attribute on its own
-
Opinions about whether a particular statement is true or false
The items for these types of attributes often contain short questions with ‘Yes-No-Don’t Know’ or ‘True-False’ response options. Multiple dichotomous characteristics can be measured in a single item starting with a general question such as ‘Have you ever taken any of the following medicines?’ or ‘Have you ever had one of the following illnesses?’ or ‘Are the following statements true or false?’ Such items assessing several dichotomous attributes may do so with the aim of measuring a higher-level latent attribute. For instance, a list of questions about the use of particular medications may aim at measuring whether treatment for a particular illness was given. Or, an item containing a list of statements with ‘True-False’ options may aim at measuring a level of knowledge or a psychological-behavioral characteristic. These examples are illustrations of the fact that attributes can be multi-dimensional and nested.
4 Questionnaire Administration
For questionnaire administration it is important to keep in mind that anything that can confuse, distract, bore, embarrass, or otherwise burden the respondent or the interviewer will tend to adversely affect accuracy and completeness of the recorded responses. In this section we will discuss administration styles, specific training, user’s manuals and ethical issues of questionnaire administration with a special concern for maximizing accuracy and completeness. As a reminder, in Chap. 10 we discussed modes of administration in the context of designing a measurement plan. The important choices to make included:
-
Self-administered vs. interviewer-administered
-
Face-to-face vs. internet vs. telephone vs. mixed administration
-
Administration at home vs. clinical care settings vs. other
-
Proxy-respondents vs. interviewing enrolled study subjects
One should make sure to always record the type of respondent used, for example self-about-self, mother-about-child, other-caregiver-about-child, etc. When an adult is reporting about a child, especially in environments with extended care-giving practices, it may be necessary to define the relationship of the adult to ensure validity of responses. Generally speaking, proxy-respondents must be avoided as much as possible if the enrolled subject is capable of providing accurate answers.
4.1 Styles of Interviewing
The style of interviewing tends to have an influence on the accuracy of the responses. Panel 18.5 lists the main styles and the expected effects on responses.
4.2 Training of Questionnaire Administration
Panel 18.6 shows a checklist of selected training topics around questionnaire administration.
4.2.2 Source Document Standards
ICH Good Clinical Practice guidelines state that ‘Source data is all information in original records and certified copies of original records of clinical findings, observations, or other activities in a clinical trial necessary for the reconstruction, evaluation and validation of the trial. Minimum standards as to the quality of source data are currently prescribed for clinical trials only. However, many of the specific guidelines are potentially useful for other types of studies as part of a strategy of maximizing data quality. Selected examples of this are listed below.
-
No changes to original data can be made without signed justification
-
No personal identifiers on questionnaires except with special permission
-
All questionnaires and any copies must be signed, credentialed, and dated. Copies must be certified to be an exact reflection of the original
-
Any questionnaire as well as any written communication about the participant (e.g., lab report) must mention subject study number
-
A master-list must be kept linking study number to personal information, only accessible by the investigator (not data management personnel)
-
Every protocol deviation (e.g., missed visit) should be documented with reasons for the deviation stated
-
Never obliterate entries that require correction (no barring, no use of white-out)
-
Never destroy original documents if they require error correction
-
Follow-up questionnaires must be kept in chronological order
-
Enrollment forms must document compliance with each single eligibility criterion
-
All source documents must be kept either in a same place or in a way that a monitor can easily access them during a monitoring visit
4.3 The Questionnaire User’s Manual
Also known as the Interviewer’s Guide or Instruction Sheet, the questionnaire User Manual contains detailed instructions on the use of the questionnaire form. User’s manuals usually have a section with general guidelines as well as question-specific sections. The content is influenced largely by the chosen style of interviewing. One can also consider providing a library of pre-coded answer sets in the user’s manual, e.g., occupational categories. One should make sure that each interviewer is trained extensively on how and when to use the instruction sheets. It should be a formal obligation for the interviewers to have the instruction sheets available for consultation during each interview. It is habitual to prepare a Standard Operating Procedure based on the User Manual and field logistics; this will prevent deviation from the study protocol.
4.4 Ethical Considerations Around Questionnaire Administration
It is good to ensure privacy during questionnaire administration and to avoid non-intended disclosures. These measures optimize accuracy and limit item non-response rates. When the subject matter is anticipated to reveal emotionally sensitive issues, such as partner violence or mental distress, protocols should include details on emergency counseling and professional services. Periodic counseling of interviewers is also advised in such research, though data collectors should not do this counseling. Finally, adherence to source document standards, as described above, is another ethical imperative.
This chapter discussed questionnaire design and administration. Every time a direct measurement value or response is recorded or a biological sample is taken, a further challenge lays ahead, namely to preserve the integrity of these data and samples while they are processed. The maintenance of data and sample integrity is therefore the topic of the next chapter.
References
Biemer PP, Lyberg LE (2003) Introduction to survey quality. Wiley, Hoboken, pp 1–402. ISBN 0471193755
Fienberg SE, Loftus EF, Tanur JM (1985) Cognitive aspects of health survey methodology: an overview. Milbank Mem Fund Q 63:547–564
Groves RM et al (1991) Direct questioning about comprehension in a survey setting. In: Tanur JM (ed) Questions about questions. The Russell Sage Foundation, New York, pp 1–308. ISBN 9780871548429
Jobe JB et al (1990) Recall strategies and memory for health-care visits. Milbank Q 68:171–189
Martorell R et al (1976) Underreporting in fortnightly recall morbidity surveys. J Trop Pediatr 22:129–134
Ross M, Conway M (1986) Remembering one’s own past: the construction of personal histories. In: Sorrentino RM, Higgins ET (eds) Handbook of motivation and cognition, vol 1. Guilford, New York, pp 122–144
Schwarz N, Oyserman D (2001) Asking questions about behavior: cognition, communication, and questionnaire construction. Am J Eval 22:127–160
SDQ (2012) Strengths and difficulties questionnaire. www.sdqinfo.com. Accessed Sept 2012
Stinson JN et al (2006) Systematic review of the psychometric properties, clinical utility and feasibility of self-report pain measures for use in clinical trials in children and adolescents. Pain 125:143–157
Streiner DL, Norman GR (2008) Health measurement scales. A practical guide to their development and use, 4th edn. Oxford University Press, Oxford, pp 1–431. ISBN 9780199231881
Tourangeau R, Rips LJ, Rasinski K (2000) The psychology of survey response. Cambridge University Press, Cambridge, pp 1–401. ISBN 9780521576291
World Health Organization. Process of translation and adaptation of instruments, YouthinMind. http://www.who.int/substance_abuse/research_tools/translation/en/. Accessed Sept 2012
Author information
Authors and Affiliations
Corresponding author
Editor information
Editors and Affiliations
Rights and permissions
Copyright information
© 2013 Springer Science+Business Media Dordrecht
About this chapter
Cite this chapter
Van den Broeck, J., Chhagan, M., Kauchali, S. (2013). Questionnaires. In: Van den Broeck, J., Brestoff, J. (eds) Epidemiology: Principles and Practical Guidelines. Springer, Dordrecht. https://doi.org/10.1007/978-94-007-5989-3_18
Download citation
DOI: https://doi.org/10.1007/978-94-007-5989-3_18
Published:
Publisher Name: Springer, Dordrecht
Print ISBN: 978-94-007-5988-6
Online ISBN: 978-94-007-5989-3
eBook Packages: MedicineMedicine (R0)