
Abstract
In this paper, an algorithm is proposed for mining frequent maximal itemsets. Discovering frequent itemsets is the key process in association rule mining. One of the major drawbacks of traditional algorithms is that they work only for items with single frequency per transaction. Proposed algorithm works with multiple frequency of an item per transaction. Proposed algorithm scans base database only once. The proposed algorithm took lesser time to find candidate itemsets. It uses directed graph for candidate itemsets generation. We conducted experiments on two datasets, Mushroom and Chess. Experimental results showed that proposed algorithm can quickly discover maximal frequent itemsets and effectively mine potential association rules.
Access provided by Autonomous University of Puebla. Download conference paper PDF
Keywords
1 Introduction
The Association rule mining has been a major and basic task in the data mining. Association rule mining finds interesting association or correlation relationship among a large set of items. It was first presented by Agrawal [1]. The mining of association rules is typically done in two steps: first, find all the frequent itemsets and second step is generating association rule base on frequent itemsets [2].
Many algorithms have been developed for searching association rules. The main challenge in mining association rules is developing fast and efficient algorithm that can handle large volume of data, minimum time scans database and find associated rule very quickly. Most of the proposed apriori-like algorithms for mining association rules are wasting lots of time to generate candidate itemsets. FP Growth algorithm is also very useful for finding association rule. It is faster than apriori algorithm and consumes lesser memory. The FP Growth algorithm does not generate candidate itemsets so take less time to find frequent itemsets [3]. But it also have limitation in respect of space and time. The proposed algorithms overcome these limitations. The proposed algorithm mining association rule with minimum candidate itemsets and items with multiple frequency of an item per transaction. Frequent itemsets can be of two types closed and maximal. A frequent itemset is called maximal if it has no superset that is frequent [4]. An itemset is closed if it is frequent but none of its superset has the same support count [5].
Directed graph is used in the proposed algorithm for candidate itemsets generation. It saves time and memory consumption because it generates minimum number of candidate itemsets, those are likely to be frequent. Frequent 2-itemsets required for the directed graph generation. First item of a frequent 2-itemset works as origin and second item like destination for an edge in the directed graph [6]. Directed graph gives us minimum candidate itemsets that are likely to be frequent itemsets.
Presently association rule mining algorithms is enhanced using bottom-up techniques and feature discovery based techniques. PIETM (Principle of Inclusion–Exclusion and Transaction Mapping) discovers frequent itemsets by using the bottom-up technique. It reduces database scanning only two times [7]. PIETM does not scan the database to count the support of itemsets. Instead, it presents a new method that calculates the support of itemsets using a well-known set theory property. It employs the Principle of Inclusion–Exclusion to calculate the support of candidate itemsets. Improved Apriori Algorithm Based on Features discovers more reasonable association rules [8]. The algorithm shows that different items should be given different importance. In this every transaction item has its own feature(s) to carry more information. With adding feature(s) to these items, when mining the association rules, just those transaction data with same feature(s) will be scanned and computed. The algorithm in which features are added to the transaction items to make the mining association rules more reasonable and more efficient. But in many conditions the algorithm need to repeat the calculation.
2 An Algorithm Based on Directed Graph
2.1 Definitions
- Definition 1:
-
Let I = {I1, I2,…, In} be a set of items. Let D be a database of transactions. And D = {T1, T2,…, Tm}, Each transaction T is a set of items
- Definition 2:
-
Let m be the number of transaction in D. And n be the number of distinct items in the D
- Definition 3:
-
Item has their own item_freq. item_freq is the occurrence of an itemset in a transaction
- Definition 4:
-
A matrix (m x n) with elements value corresponding to item_freq of the items
- Definition 5:
-
Let X be an itemset, itemset X contains k items. The set of all frequent k-itemset is denoted by Lk (Fig. 1)
Fig. 1 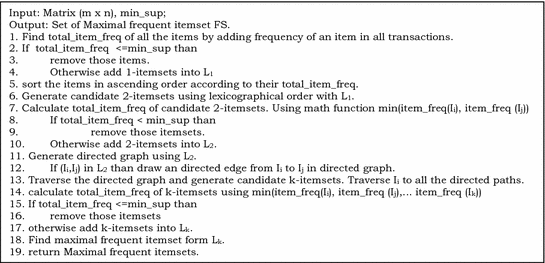
The proposed algorithm

2.2 Algorithm Details
The proposed algorithm can be divide into fives main steps. These steps explained below:
2.2.1 Transform the Transactional Database D into a Matrix
The transactional database transformed into an asymmetric matrixm*n. Total number of distinct items are the total number of columns (n) in the matrix. Total number of transaction T are the rows (m) in the matrix as shown in the Fig. 2. Item_freq of the items are value of corresponding column of that particular transaction. If the transaction does not have an item, then 0 (zero) inserted into corresponding column location. After the transformation step a transactional database became an asymmetric matrix [9].

The frequency matrix7*6
We denote Matrixm*n:
-
m = Total number of transactions &
-
n = Total number of distinct items in transaction database D.
2.2.2 Generate the Set of Frequent 1-Itemsets L1
We scan the Matrix and calculate total_item_freq of items by counting item_freq of items in a column. If total_item_freq of Ij item lesser than min_sup, itemset Ij in not a frequent 1-itemset, so remove jth column. Otherwise itemset Ij is the frequent 1-itemset and is added to the set of frequent 1-itemset L1. Sorting has been done of all frequent 1-itemsets by total_item_freq in ascending order. Sorted elements help us to generate minimum candidate itemsets as in [10], these candidate itemsets are likely to be frequent.
2.2.3 Generate the Set of Frequent 2-Itemsets
In this step, we use sorted 1-itemsets L1 and generated candidate 2-itemsets in lexicographical order. Count the total_ item_freq of the candidate 2-itemset {Ii,Ij}. Minimum item_freq of Ii and Ij are the total_item_freq of the candidate 2-itemset. If the total_item_freq of candidate 2-itemset {Ii,Ij} greater than min_sup, then itemset {Ii,Ij} frequent 2-itemset and added into L2, otherwise removed.
2.2.4 Construct the Directed Graph
We construct the directed graph by using frequent 2-itemsets L2. If itemset {Ii,Ij} frequent 2-itemset then draw a directed edge from Ii to Ij in directed graph. First item of 2-itemset are origin node and second item are destination node. We draw all directed edge by using itemset of L2. After drawn all the edges, we present a directed graph [11, 12].
2.2.5 Generate All the Candidate k-Itemsets Using Directed Graph
The proposed algorithm traverses once to the directed graph and generate candidate itemsets by using the directed neighbour nodes. Start from Ii and traverse all the possible reachable nodes. After completion of traversing, it leads to formation simple paths; these simple paths are our candidate itemsets. Nodes of possible simple paths are element of these itemsets.
2.2.6 Find Frequent Itemsets
In final step, we collect only frequent itemsets. For finding frequent k-itemsets, we traversed the matrix and count the total_item_freq of the candidate k-itemsets {Ii,Ij,…Ik}. Minimum item_freq of Ii, Ij up to Ik are the total_item_freq of the candidate k-itemsets. If the total_item_freq of candidate k-itemsets {Ii,Ij,…Ik} greater than min_sup, than {Ii,Ij,…Ik} itemsets are frequent k-itemset and added into Lk. Otherwise remove infrequent itemsets. Finally we got the final set of frequent k-itemsets Lk. Now we verify that frequent k-itemsets Lk are maximal or not. If those itemsets who do not full fill the property of maximal itemsets are removed, otherwise add into final resulted sets.
2.3 Example
The transactional database showed in Table 1. The number of items is 6 and the number of transactions is 7. The minimum support count (min_sup) is 5.
2.3.1 Transform the Transactional Database D into a Matrix
The transactional database transformed into an asymmetric matrix7*6. The items are the columns of the matrix and transactions are the rows of the matrix as shown in the Fig. 2. Item_freq of the items are values of corresponding column in particular transaction. In T1 transaction I1,I2,I5 and I6 having item_freq 3,2,4 and 2 respectively inserted in first row of the matrix as shown in Fig. 2. All other rows inserted in the same manner as T1 row was inserted.
2.3.2 Generate the Set of Frequent 1-Itemsets L1
In this step, we scan the frequency Matrix and calculate total_item_freq of items by counting values of the columns. The total_item_freq of items are I1 = 10, I2 = 8, I3 = 12, I4 = 4, I5 = 17 and I6 = 15. Total_item_freq of I4 smaller than min_sup, so removed as shown in Fig. 3. I1, I2, I3, I5 and I6 itemsets are frequent. Sort the frequent 1-itemsets according to their total_item_freq and add these into L1. Now L1 = {{I2}, {I1}, {I3}, {I6}, {I5}}

The frequency matrix with total_item_count
2.3.3 Generate Candidate 2-Itemsets
We generated candidate 2-itemsets using sorted L1. Count the total_ item_freq of the candidate 2-itemset {Ii,Ij}. Minimum item_freq of Ii and Ij are the total_item_freq of the candidate 2-itemset. The total_item_freq of itemsets are {I2,I1} = 7, {I2,I3} = 1, {I2,I6} = 6, {I2,I5} = 7, {I1,I3} = 0, {I1,I6} = 6, {I1,I5} = 8, {I3,I6} = 7, {I3,I5} = 5 and {I6,I5} = 9 as shown in Fig. 4. In itemset {I2,I1}, item_freq are 2, 3 and 2 in transactions T1, T6 and T7 respectively as shown in the Fig. 4, and total_item_freq is 7. Itemset {I2,I3} and {I1,I3} are infrequent, so removed. Now the frequent 2-itemsets are L2 = {{I2,I1},{I2,I6},{I2,I5}, {I1,I6}, {I1,I5}, {I3,I6}, {I3,I5}, {I6,I5}}.

The candidate 2-itemsets matrix10*7
2.3.4 Generate Directed Graph Using Frequent 2-Itemsets
Construct the directed graph using L2. If {Ii,Ij} in L2, then draw a directed edge from Ii to Ij in directed graph. A graph consists of two things node (V) and directed edged (E). V is the set of nodes and E is the set of edges of a graph. V = {I1, I2, I3, I5, I6} or {L1} and E = {I2,I1},{I2,I6},{I2,I5}, {I1,I6}, {I1,I5}, {I3,I6}, {I3,I5}, {I6,I5}} or {L2}. For itemset {I2,I1}, I2 is the origin point and I1 is the destination point of an edge. A graph having the number of edges is equal to the number of itemsets in L2. Completed directed graph is shown in Fig. 5.

Directed graph
2.3.5 Generate Candidate k-Itemsets Using Directed Graph
Candidate k-itemsets generated by traversal of directed graph. This process is very easy and simple as shown in Fig. 6. Start from each source node and traverse to all reachable nodes. This process gave us all candidate itemsets. Our candidate k-itemsets are {I2,I1,I6}, {I2,I1,I6,I5}, {I2,I1,I5}, {I2,I6,I5}, {I1,I6,I5}, {I3,I6,I5}.

Generation of candidate k-itemsets
2.3.6 Find Frequent Itemsets
In last, we check whether each candidate k-itemsets is frequent or infrequent itemsets. Calculate total_item_freq of all the itemset as shown in the Tables 2 and 3. Suppose we calculate total_item_freq of itemset {I2,I1,I6}, now we calculate minimum item_freq value among I2,I1 and I6 for all the transaction, and add all these minimum item_freq as shown in Table 2. Minimum item_freq for T1, T2, T3, T4, T5, T6 and T7 are 2, 0, 0, 0, 0, 2, and 1 respectively, and total_item_freq is 5 as shown in Table 2. Now the total_item_freq of candidate k-itemsets are {I2,I1,I6} = 5, {I2,I1,I6,I5} = 5,{I2,I1,I5} = 6, {I2,I6,I5} = 6, {I1,I6,I5} = 6, {I3,I6,I5} = 1. The total_item_freq of {I3,I6,I5} itemset is less than min_sup, So we remove this itemset as shown in Table 3. All other itemsets is having greater total_item_freq than min_sup, so these are added into frequent k-itemset Lk as shown in the Table 4.
In the end, we find maximal frequent itemsets from Lk. {I2,I1,I6},{I2,I1,I5} {I2,I6,I5}, {I1,I6,I5} are the subsets of the itemset {I2,I1,I6,I5}. In maximal itemset we did not include frequent subsets. So remove the subsets of the maximal itemsets. For the example our final maximal frequent itemset is {I2,I1,I6,I5}.
3 Experimental Results
Experiment results showed that proposed algorithm is simple and efficient. To find experimental results, we have used mushroom and chess dataset obtained from UCI [13] and synthetic dataset which are created by us. The algorithms were implemented in Java and tested on a windows platform. Mushroom dataset have total Number of Instances: 8124, Number of Attributes: 23, Number of items: 119. Another dataset used for experiment result is chess [14]. Chess dataset have total Number of Instances: 3196, Number of Attributes: 37, Number of items: 75. We have divided the mushroom and chess datasets into groups of 50 instances. Hence, each instance contains their corresponding count. We analysis that as support count increases, the execution time goes down as shown in the Fig. 7.

Execution time with different minimum support count thresholds for mushroom and chess datasets
Proposed algorithm took less time when minimum support count of threshold was higher. The frequent pattern generated by traditional algorithms and proposed algorithm are almost same. But proposed algorithm gives more information about item frequency. This item frequency can used to find, how many items sold together with some item frequency. This additional information can help us to determine the number of items sold with associated items. Proposed algorithm took less time as compare traditional algorithms to find frequent patterns.
4 Conclusion
The proposed algorithm use directed graph for generate candidate itemsets. The candidate itemsets are likely to be frequent, so provide efficiency and accuracy in results. So the proposed algorithm spends less time to find candidate and maximal frequent itemsets. Directed graph generates candidate itemsets by graph traversing instead of join and prune steps. The proposed algorithm scan base database only once. So the proposed algorithm suitable for find frequent itemsets when items have multiple counts or frequency. Not much difference in patterns was with proposed and traditional algorithms but the execution time of proposed algorithm is lesser than traditional algorithms.
References
Agrawal, R., Srikant, R.: Fast algorithms for mining association rules in large databases. In: Proceedings of the 20th International Conference on Very Large Databases, pp. 487–499. Santiago, Chile (1994)
Han, J., Kamber, M.: Data Mining Concepts and Techniques, 3rd edn. Morgan Kaufmann Publishers, San Francisco (2012)
Han, J., Pei, J., Yin, Y.: Mining Frequent Patterns without Candidate Generation. In: Proceedings of the ACM-SIGMOD conference management of data, pp. 1–12 (2000)
Amir, A., Anumann, Y., Feldman, R., Fresko, M.: Maximal association rules: a tool for mining associations in text. J. Intell. Inf. Sys. 25(3), 333–345 (2005)
Zaki, M.K.: Closed itemset mining and non-redundant association rule mining. In: Encyclopedia of Database Systems. Springer-Verlag (2009)
Rosen, K. H.: Discrete mathematics and its application. In: 7th Edition, McGraw-Hill publication (2012)
Lin, K.C., Liao, I.E., Chang, T.P., Lin, S.F.: A frequent itemset mining algorithm based on the principle of inclusion-exclusion and transaction mapping. Inf. Sci. 276, 278–289 (2014)
Yang. J., Li.Z., Xiang.W., Xiao.L.: An improved apriori algorithm based on features. In: Ninth International Conference on Computational Intelligence and Security, pp. 125–128 (2013)
Jain, G., Bingwu, L., Mingru, Z., Pingping, D.: A new method of computing the reachability matrix of directed graph. In: Second International Workshop on Education Technology and Computer Science, pp. 774–776 (2010)
Liu, H., Wang, B.: An Association Rule Mining Algorithm Based on a Boolean Matrix. Data Sci. J. 6, S559–S565 (2007)
Liu, N., Ma, L.: Discovering frequent itemsets an improved algorithm of directed graph and array. In: 4th IEEE International Conference on Software Engineering and Service Science (ICSESS), pp. 1017–1020 (2013)
Fang, L.: Frequent itemset mining algorithm based on graph and two-directional search. Comput. Eng. 38(1), 59–61 (2012)
Schlimmer J., https://archive.ics.uci.edu/ml/machine-learning-databases/mushroom/agaricus-lepiota.data
Shapiro, A., https://archive.ics.uci.edu/ml/datasets/Chess (KRKPA7)
Author information
Authors and Affiliations
Editor information
Editors and Affiliations
Rights and permissions
Copyright information
© 2016 Springer India
About this paper
Cite this paper
Singh, K., Shakya, H.K., Biswas, B. (2016). Discovery of Multi-frequent Patterns Using Directed Graph. In: Shetty, N., Prasad, N., Nalini, N. (eds) Emerging Research in Computing, Information, Communication and Applications. Springer, New Delhi. https://doi.org/10.1007/978-81-322-2553-9_15
Download citation
DOI: https://doi.org/10.1007/978-81-322-2553-9_15
Published:
Publisher Name: Springer, New Delhi
Print ISBN: 978-81-322-2552-2
Online ISBN: 978-81-322-2553-9
eBook Packages: EngineeringEngineering (R0)