
Abstract
The classical K-Means clustering algorithm yields means which can be called the final unchanging or fixed means around which all other points in the dataset get clustered. This is so because the K-Means clustering terminates when either the clusters repeat in the next iteration or when the means repeat in the next iteration. This reveals that if one is able to somehow calculate and find apriori the final unchanging means using the dataset, then the task of clustering reduces to only assigning the remaining points in the dataset into clusters, which are closest to these final fixed or unchanging means based on standard distance measures. Taking a cue from the result of the classical K-Means method, the K-Strange points clustering algorithm presented in this paper locates K points from the dataset equaling the number of required clusters which are farthest from each other and are hence called K-Strange points based on the Euclidean distance measure. The remaining points in the dataset are assigned to clusters formed by these K-Strange points.
Access provided by Autonomous University of Puebla. Download conference paper PDF
Keywords
1 Introduction
Data Mining is the process of detecting patterns from extremely huge quantities of data collection [1]. Data Mining explores large quantities of data in order to discover hidden rules and potentially meaningful patterns [2]. Data Mining can be performed on various types of database and information repositories, but the kind of patterns to be found are specified by various data mining functionalities [3]. Grouping or bunching of data into a set of categories or clusters is one of the essential methods in manipulating and finding patterns from data [4]. Clustering is the most common data mining process which aims at dividing datasets into subsets or clusters in such a way that the objects in one subset are similar to each other with respect to a given similarity measure while objects in different subsets are dissimilar [5]. Clustering is a task that attempts to detect similar categories or groups of objects based on the implementation of their feature dimensions [6]. One can detect the predominant distribution patterns and interesting correlations that exist among data attributes by clustering which can determine dense and sparse areas [7]. Clustering organizes and partitions objects into groups whose members are alike in some way [8]. A cluster is a collection of data objects that are similar to one another within the same cluster and are dissimilar to the objects in other clusters [9]. A good clustering algorithm will produce high quality of clusters with high intra cluster similarity and low inter cluster similarity [10]. The purpose of clustering is to detect groups or clusters of similar objects where an object is represented as a vector of measurements or points in multidimensional space. The distance measure determines the dissimilarity between objects in various dimensions in the dataset [11]. Cluster analysis is an important technique to find the similar and dissimilar groups in data mining [12]. Clustering is commonly and heavily used in a variety of applications such as in market segmentation, medical science, environmental science, astronomy, geology, business intelligence and so on. It also helps users in understanding natural groupings in a data set or structure of the data set [13].
1.1 Motivation
The classical instantiation of the K-Means algorithm begins by randomly picking K prototype cluster centers called K-Means, assigning each point to the cluster whose mean is closest in a Euclidean sense, then computing the mean vectors of the points assigned to each cluster and using these as new centers in an iterative approach until the termination criteria is reached [14]. The complexity of the K-Means method is O(nktd) where n represents the number of data points, k represents the number of required clusters, t represents the number of iterations the algorithm should undergo if the cluster centers (means) do not repeat in the next iteration or if the clusters do not repeat in the next iteration and d represents the number of attributes or dimensions [15]. Clustering, using the classical K-Means method results in obtaining final fixed points which we call the final unchanging means around which all other points in the dataset get clustered. This suggests that if we are able to somehow calculate and find apriori the final unchanging means using the dataset, then the task of clustering reduces to only assigning the remaining points in the dataset into clusters, which are closest to these final fixed or unchanging means based on standard distance measures. Taking a cue from the result of the K-Means method the algorithm presented in this paper locates K points from the dataset equaling the number of required clusters which are farthest to each other based on the Euclidean distance measure. The remaining points in the dataset are assigned to clusters formed by these K-Strange points.
2 Proposed Work
This paper presents an algorithm for clustering by finding K points in a dataset equaling the number of required clusters which are most dissimilar to each other. The K points are referred to as K-Strange points because these K points are located farthest from each other or are the most dissimilar points to each other in the dataset. The Algorithm initially randomly chooses a point from the dataset representing the first of the K-Strange points (Fig. 1). It then locates a point which lies farthest from the first initially chosen point (Fig. 2). Then it finds a third point in the dataset which is farthest from the two strange (maximally separated) points located in the previous steps (Fig. 3). For k = 5 clusters, it finds the fourth point which is maximally separated from the previous 3 farthest points (Fig. 4). And eventually the fifth strange point from the four maximally separated farthest points is found thus forming five points which are strangers to each other or in simple words five points which are at maximum distance from each other (Fig. 5). If the required number of clusters is K = 5, then the five clusters can be formed by assigning the remaining points in the dataset into clusters formed by these 5 strange points (Fig. 6). If the clustering requirement is of K = T clusters then continue the procedure of finding the T Strange points which are the K = T points which are farthest from each other and then assign the remaining points in the dataset into clusters formed by these K = T Strange points based on the Euclidean distance measure.

First randomly chosen strange point

Calculated second strange point

Calculated third strange point

Fourth strange point

Fifth strange point

Five clusters formed from the k = 5 strange points
2.1 K-Strange Points Clustering Algorithm
Input:
-
(i)
A database containing n objects. D = {D1, D2, D3, D4, …, Dn}
-
(ii)
The number of required clusters K = T
Output: A set of K clusters.
-
Step 1: Select two points Dk and Dw from the dataset which are at maximum distance from each other by finding distances between the all points in the dataset from each other using the Euclidean distance measure. The Euclidean distance between 2 points is defined as the square root of the sum of the squared differences [16]. The Euclidean distance between the points i(w1,x1, y1,z1) and j(w2,x2, y2,z2) is given by:
$$ d(i,j) = \sqrt {(w_{1} - w_{2} )^{2} + (x_{1} - x_{2} )^{2} + (y_{1} - y_{2} )^{2} + (z_{1} - z_{2} )^{2} } $$ -
Step 2: Locate a third point Df which is farthest from Dk and Dw such that the sum of the distances between points Df, Dk and Dw is larger than any other combination with Dk and Dw
-
Step 3: Repeat the above procedure until we locate K points equaling the number of required clusters mentioned in the problem
-
Step 4: Assign the remaining points in the dataset into clusters formed by these K-Strange (farthest) points using the Euclidean distance measure
-
Step 5: Output K clusters.
2.2 Implementation of the Proposed Algorithm
Consider a clustering requirement for 3 clusters of any dataset. The Euclidean distance between all points in the dataset can be found using the piece of code (1) given below.

On finding the Euclidean distance of all the data points from each other we find the two points which are at maximum distance from each other using the below piece of pseudo-code (2).

Then we locate a point which is farthest from these two points. If the nth data item Dn−1 and the mth data item Dm−1 are these two points then we locate a third point which is farthest from Dn−1 and Dm−1 such that the sum of the distances between the third point, Dn−1 and Dm−1 is larger than any other combination with Dn−1 and Dm−1. This can be done as shown in the following pseudo-code (3).

Once the third point is found using the above code, we stop finding any more farthest points since the clustering requirement is to group the points in the dataset into 3 clusters and as we have already found the K = 3 Strange points equaling the number of required clusters from the dataset we stop searching for any more farthest points. The next step is to assign the remaining points in the dataset into clusters formed by the K-Strange points. Finally, this is implemented as shown in the pseudo-code (4) below.

2.3 Experimental Results
The algorithm is tested with a 2D array dataset of 10,000 points each with 4 columns randomly generated by the following pseudo-code for finding 3 clusters.

-
Step 1: The Euclidean distance between all points in the dataset found using the pseudo-code (1)
-
Step 2: On finding the Euclidean distance of all the data points from each other we see that the two points which are at maximum distance from each other. Using pseudo-code (3) we locate the third farthest point Dk such that the sum of the distances between Dk, Dn−1 and Dm−1 is larger than any other combination with Dn−1 and Dm−1. The snapshot of the 3 strange points can be seen in Fig. 7
Fig. 7 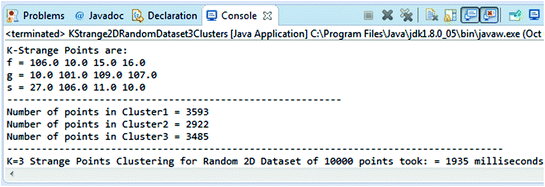
K-Strange Clustering for a random array of size [1 0 0 0 0] [4] for 3 clusters
-
Step 3: Here the remaining points in the dataset are assigned into clusters formed by the K-Strange points and this is done using the pseudo-code (4). On execution, the code gives the information on the formation of the 3 required clusters as follows:

2.4 Comparison with K-Means and Inference for 3 Clusters
Table 1 shows the results of the K-Means and K-Strange points clustering algorithms for a random dataset of 1,000, 5,000, and 10,000 data points each with 4 dimensions for 3 clusters. Although the K-Strange clustering algorithm executes slower than the classical K-Means, the K-Means algorithm takes an exponential time to converge as the number of data points and dimensionality increases. Hence K-Means clustering algorithm uses t as the number of iterations to terminate the clustering process if it tends to go into an infinite loop. This will result in inaccurate clusters. Though the K-Strange Points Clustering algorithm takes a little more time for its execution than the K-Means algorithm in lower dimensions, it performs better than the K-Means in higher dimensions as seen from Fig. 8 and the Table 2 that follows.

K-Strange Clustering for a random array of size [1 0 0 0 0] [13] for 3 Clusters
We see that as the dimensions increase, the K-Strange Points Clustering algorithm gives us the results as seen in Fig. 8 but the K-Means algorithm doesn’t converge.
3 Conclusion
The complexity of the K-Means Clustering method being O(nktd), there is a strong likely hood that the clusters so formed may not be accurate because according to the K-Means method, for clustering to yield accurate results, either the cluster centers (means) should repeat in the next iteration or the clusters should repeat in the next iteration. As dimensions increase, K-Means takes exponential time and so, abruptly terminating the clustering process after a certain number of specified iterations will not yield the desired accurate clusters. This issue is addressed by finding K points in any dataset equaling the number of required clusters which are at maximum distance from each other making them the most dissimilar or Strange points to each other and then assigning the remaining points in the dataset into clusters formed by these K = T strange points based on the Euclidean distance measure, and thereby eliminating the abrupt terminations associated with t, the number of iterations.
References
Abbas, O.: Comparisons between data clustering algorithms. Int. Arab J. Inf. Technol. 5(3), 320–325 (2008)
Prabhu, P., Anbazhagan, N.: Improving the performance of k-means clustering for high dimensional dataset. Int. J. Comput. Sci. Eng. 3(6), 2317–2322 (2011), ISSN: 0975-3397
Micheal, J.A.: Berry Gordon Linoff.: Mastering Data Mining. Wiley, Singapore (2001)
Bouveyrona, C., Girarda, S., Schmid, C.: High dimensional data clustering. J. Comput. Stat. Data Anal. 52(1), 502–519 (2007)
Kaufman, L., Rousseeuw, P.J.: Finding Groups in Data: An Introduction to Cluster Analysis. Wiley, New York (1990)
Jain, A., Murty, M., Flynn, P.: Data clustering: a review. ACM Comput. Surv. 31(3), 264–323 (1999)
Alijammaat, A., Khalilian, M., Mustapha, N.: A novel approach for high dimensional data clustering. In: Proceedings of the Third International Conference on Knowledge Discovery and Data Mining, Phuket, Iran, pp. 264–267 (2010)
Johnson, T.: Bisecting collinear clustering algorithm. Int. J. Comput. Sci. Eng. Inf. Technol. Res. 3(5), 43–46 (2013), © TJPRC Pvt. Ltd., ISSN: 2249-6831
Johnson. T., Lobo, J.Z.: Collinear clustering algorithm in lower dimensions. IOSR J. Comput. Eng. 6(5), 08–11 (2012), ISSN: 2278-0661, ISBN: 2278-8727
Singh, S.K., Johnson, T.: Improved collinear clustering algorithm in lower dimensions. In: Proceedings of Second International Conference on Emerging Research in Computing, Information, Communication and Applications (2014) (in press)
Nagi, S,. Bhattacharya, D.K., Kalita, J.K.: A preview on subspace clustering of high dimensional data. Int. J. Comput. Technol., 6(3), 441–448 (2013). ISSN: 22773061
Aravinder D.J., Naganathan, E.R.: Efficient centroids based clustering algorithm with data intelligence. J. Theor. Appl. Inf. Technol. 56(1), 126–130 (2013). ISSN: 1992-8645
Jahirabadkar, S., Kulkarni, P.: SCAF-An efficient approach to classify subspace clustering. Int. J. Data Mining Knowl. Manage. Process, 3(2) (2013)
Hand, D.J., Mannila, H., Smyth, P.: Principles of Data Mining, MIT Press, Cambridge, pp. 302–305 (2001)
Tan, P., Steinbach, M.K.: An Introduction to Data Mining. Wesley, London (2005)
A. Alfakih, A. Khandani, and H. Wolkowicz.: Solving Euclidean distance matrix completion problems via semide¯nite programming. Comput. Optim. Appl. 12, 13–30 (1999)
Author information
Authors and Affiliations
Corresponding author
Editor information
Editors and Affiliations
Rights and permissions
Copyright information
© 2015 Springer India
About this paper
Cite this paper
Johnson, T., Singh, S.K. (2015). K-Strange Points Clustering Algorithm. In: Jain, L., Behera, H., Mandal, J., Mohapatra, D. (eds) Computational Intelligence in Data Mining - Volume 1. Smart Innovation, Systems and Technologies, vol 31. Springer, New Delhi. https://doi.org/10.1007/978-81-322-2205-7_39
Download citation
DOI: https://doi.org/10.1007/978-81-322-2205-7_39
Published:
Publisher Name: Springer, New Delhi
Print ISBN: 978-81-322-2204-0
Online ISBN: 978-81-322-2205-7
eBook Packages: EngineeringEngineering (R0)