
Abstract
This chapter looks at the condition monitoring of the micro-injection moulding process (µ-IM). This manufacturing process has been applied successfully to a wide range of products in the micro-scale and is also an appropriate technology for manufacturing meso-parts with both micro- and nano-features. Improvement in the quality and the accuracy of parts made from polymers can be successfully achieved by determining the optimum conditions for replication. Process control in manufacturing is critical, and condition monitoring of µ-IM is a control method for improved understanding of the effects of selected parameter settings. This chapter reports on the condition monitoring methods used to improve the factors that affect part’s quality. For each of the examples, the Taguchi design of experiments (DOE) method is used together with demonstrations of various experimental set-ups and the acquisition of data. The chapter advises on the obtainment of information regarding the behaviour of the µ-IM and the significant factors affecting the process. The selected case studies demonstrate the condition monitoring of the cavity pressure, forces, temperature distribution and air evacuation. For each, the research findings are discussed and conclusions are made.
Access provided by CONRICYT-eBooks. Download chapter PDF
Keywords
1 Introduction
The trend for broadening existing part functionality with micro-features and the downscaling of existing designs has led to new micro-products entering the industrial market place. With size decreases, cost reductions can be achieved through the use of less material, energy, storage space and transport. To capitalise on this economic potential of new products, it is paramount that production systems are created to allow for the translation of micro-engineering ideas into commercial opportunities. However, downscaling requires that traditional design concepts may need to be reconsidered. The physical properties of micro-parts may be influenced by forces, pressures, speed, temperature and time in an unexpected way, and the behaviour of the parts is less understood when compared to meso-scale parts. Product miniaturisation requires the development of key technologies for producing the parts in high volumes. In particular, mass production requires the capabilities of replication techniques such as micro-injection moulding (µ-IM). µ-IM is a complex process with many control factors such as temperature, pressure and injection speed for producing quality parts. To further understand and recognise the importance of individual or combinations of process factors, an investigative analysis is required. This chapter highlights novel condition monitoring methods for measuring the demoulding forces and cavity pressure, temperature and airflow. The understanding of the phenomena being monitored is presented, along with an experimental case study. Finally, validation and verification of the results are shown in order to demonstrate to engineers and designers the opportunities that condition monitoring provides for further understanding the behaviour of the replication process.
2 Condition Monitoring of Cavity Pressure
2.1 Understanding Cavity Pressure
During the cooling stage of the IM process, the polymers experience volume change. These variations are due to the pressure–volume–temperature (PVT) behaviour. Importantly, part shrinkage can be known using the PVT data and there is an increasing recognition that cavity pressure can be used to experimentally validate the PVT behaviour and theoretical shrinkage.
Condition monitoring of pressure in moulding is important to compensate the effects of shrinkage and confirm that pressure (P) in the cavity is maintained. The monitoring of cavity P is particularly important for thin wall parts where the high P can cause tool deformation by flexuration or compression from the polymer material. This section will investigate a cavity pressure condition monitoring system and highlight proven experiments for identifying pressure control for improved part quality. The link between part quality and cavity P has been investigated by researchers [1,2,3,4,5,6,7]. Condition monitoring of P in µ-IM can be used to understand the process better and by incorporating a piezoelectric transducer into the injection pin the following conditions can be identified:
-
The start of injection.
-
Filling of the cavity volume.
-
The second stage pressure.
-
P reduction during solidification.
-
A drop to atmospheric pressure after part demoulding.
Condition monitoring is used in µ-IM to quantify relationships between part quality and process factors. In this case study, Dynisco PCI piezoelectric force transducer with the data acquisition unit and Labview 8 software was used to investigate the P in the cavity area. The mould and the Battenfeld Microsystem 50 moulding machine had been adapted to allow for a transducer behind the measuring pin (d) (see Fig. 1). When the transducer experiences a mechanical load, there is an electrical signal which is converted into a measurable voltage using a Kistler charge amplifier. The specifications of the transducer and charge amplifier are:

Piezo sensor assembled to the mould
-
transducer: 0 to 10,000 N range and force sensitivity (E f) of 4.2 pC/N;
-
amplifier: 5000 pC measuring range and 0–10 V output.
The output is monitored with a 16-bit module instrument. The pressure sensitivity (E p) is expressed as follows:
P in MPa is calculated as follows:
In the following example, the influence of process parameters on maximum pressure (\(P_{ \hbox{max} }\)), pressure work (\(P_{\text{work}}\)) and rate of pressure change (\(P_{\text{rate}}\)) is analysed using a condition monitoring set-up [8]. This investigation focuses on the filling during μ-IM (Fig. 2). With a large amount of recorded condition monitoring data pre-processing is required. In this way, it is possible to construct the data for further analysis. A MATLAB software tool is used to identify the key values, and a t series function provides key variables to determine the P conditions. \(P_{ \hbox{max} }\) is measured to find the highest P value that the tool experiences. This is a maximum P that the cavity reaches at \(t_{ \hbox{max} }\).

Pressure during filling curve
\(P_{\text{work}}\) is calculated using P over t. This is defined as the integral value of the filling stage pressure P start and ending with \(P_{max}\). \(P_{\text{work}}\) is a P sum starting at time (t start) and ending at the time of \(P_{max}\), \(t_{ \hbox{max} }\). This is multiplied with a time step of \(\Delta t\) (0.01 s) based on the data acquisition sampling rate. Thus, \(P_{\text{work}}\) is calculated with the following equation:
The rate of pressure change (\(P_{\text{rate}}\)) represents a gradient of the cavity pressure curve during the compression stage of the process. It starts when the cavity pressure reaches 10% above the compression threshold and the end point is determined to be at 10% below \(P_{ \hbox{max} }\) of the pressure curve.
where 1.1 and 0.9 are constants to reduce the gradient error for P start, \(1.1 \cdot P_{\text{start}} = P_{\text{cavity}} (t_{{{\text{slope\_start}}}} )\), and \(P_{ \hbox{max} }\), \(0.9 \cdot P_{ \hbox{max} } = P_{\text{cavity}} (t_{{{\text{slope\_end}}}} )\), respectively.
2.2 An Experimental Case Study for Pressure Monitoring
In this study, the design of a 15 mm × 20 mm × 1 mm microfluidics part was used to analyse P in the cavity during the production of micro-parts (Fig. 3a). The design has commonly microfluidics features such as reservoirs and channels. The pins are 500 µm diameter and 600 µm height, and the main channels cross section is 50–200 µm. The tool is made of brass machined by conventional and micro-milling techniques (Fig. 3b). Three commonly used moulding materials, Polypropylene (PP), Acrylonitrile Butadiene Styrene (ABS) and Polycarbonate (PC), are used for the experiments. The make of moulding machine used is Battenfeld Microsystem 50. To investigate the process influence on P, the following four factors T b, T m, P h and V i were considered, each was set at two different settings and a DOE was used to plan the experiments. The assessment would be based on the results obtained for the 50 µm channel width features and the part weight is also considered.

a Mould design and b its microfluidics features
2.3 Validation, Verification and Results Using Pressure Monitoring
Using a Taguchi design of experiments approach and employing a L16 Orthogonal array, the effects on \(P_{ \hbox{max} }\), \(P_{\text{work}}\) and \(P_{\text{rate}}\) were studied. The average \(P_{ \hbox{max} }\) result showed the highest \(P_{ \hbox{max} }\) was 48 MPa when processing PC material and ABS was the lowest at 7.29 MPa. For all three materials, there was a wide distribution of results. The \(P_{ \hbox{max} }\) normal distribution identified PC with an average pressure of 29.24 MPa, PP had 16.78 MPa and ABS was the lowest with 13.01 MPa. The distribution result also shows that process factors have more of an influence on PC compared to ABS and PP. The normal distribution for \(P_{\text{work}}\) also shows that the highest result was for PC (1267.8 MPa.s) and the lowest was for ABS (15.6 MPa.s). There is also a wide variation in the results, with the highest average recorded for PC (633.7 MPa.s) then PP (200.1 MPa.s) and ABS, (130.3 MPa.s). The results also show that the chosen control factors influence PC the most, this indicates that the choosing the correct settings for \(P_{\text{work}}\) control this material is critical. For \(P_{\text{rate}}\), the results show that the highest and lowest recorded measurements were for PC at 1.88 MPa/s and 0.05 MPa/s, respectively. The highest average change in pressure was for PP (0.54 MPa/s) then ABS (0.50 MPa/s), and PC (0.37 MPa/s).
The results were used to identify the process effects on pressure using analysis of variance (ANOVA), in this way the influence of each parameter on \(P_{ \hbox{max} }\), \(P_{\text{work}}\) and \(P_{\text{rate}}\) can be known. For \(P_{ \hbox{max} }\), the results show that there is no specific selection of settings that is optimum for controlling the pressure for the three polymers chosen. Temperature is shown to be the most important factor, with T m ranking high for PP and T b being high for ABS and PC. A T b increase results in a \(P_{ \hbox{max} }\) decrease for ABS (32%) and PC (41%). The viscosity curves for ABS and PC show that melt temperature has an influence on the polymers so the condition monitoring results confirm this relationship. For optimisation of \(P_{\text{work}}\), there is also no specific selection of settings for the three polymers. V i was identified as the important factor for ABS and PC and ranked second for PP, for all three materials an increase in V i reduces \(P_{\text{work}}\). An increase in T m results in an increase in \(P_{\text{work}}\) for the three materials. The influence of the parameter setting on \(P_{\text{rate}}\) was similar for each of the polymers, where an increase of T B and V i increase the \(P_{\text{rate}}\). The control factors of T m and P h, when increased, decrease the \(P_{\text{rate}}\). Overall T m had the highest influence where an increase in the temperature setting reduced \(P_{\text{rate}}\), this shows that through temperature control viscosity is maintained causing an increased rate of filling.
This case study reports on the effects of four process factors: T b, T m, P h and V i on pressure conditions in micro-cavities when replicating parts in three different polymers and employs a design of experiment approach. Three cavity pressure related factors (\(P_{ \hbox{max} }\), \(P_{\text{work}}\), \(P_{\text{rate}}\)) were investigated and the research showed the following:
-
It is possible to assess cavity pressure conditions during part filling by employing a specially designed condition monitoring set-up. It was shown that \(P_{ \hbox{max} }\), \(P_{\text{work}}\) and \(P_{\text{rate}}\) were dependent on both materials and processing conditions.
-
The mean value of \(P_{ \hbox{max} }\), \(P_{\text{work}}\) and \(P_{\text{rate}}\) was analysed, and the results identify a clear relationship between \(P_{ \hbox{max} }\) and \(P_{\text{work}}\). It was shown that the mean values for each material were similar in terms of their distribution over the considered pressure range. PC had the broadest \(P_{ \hbox{max} }\) and \(P_{\text{work}}\) distributions while PP the narrowest, thus indicating that PC is affected more by the process factors (Fig. 4). The \(P_{\text{rate}}\) distributions showed that the process factors led to a similar rate of pressure change.
Fig. 4 
Normal distribution of \(P_{\text{work}}\) results
-
The process parameters’ effects on P suggest that in context of \(P_{ \hbox{max} }\), \(P_{\text{work}}\) and \(P_{\text{rate}}\) there are no specific parameter levels considered to be optimum for the selected polymers. Temperature can be considered the most influential parameter for \(P_{ \hbox{max} }\), while V i for \(P_{\text{work}}\). Increasing both decreases the P.
-
T m dominates as the most influential parameter for \(P_{\text{rate}}\). Also, it can be concluded that the parameters influence is similar for all materials, furthermore for all materials, it is shown that increasing the T B and V i increases the \(P_{\text{rate}}\), and an increase of T m and P h decreases \(P_{\text{rate}}\).

3 Condition Monitoring of Forces
3.1 Understanding Demoulding Forces
In this section, the effect of the process on the forces in the demoulding of micro-parts is discussed and an experimental study is reported. Micro-parts have a high surface to volume ratio (SVR), and this causes fast cooling times that can result in high residual stresses in the parts [9]. After cooling the parts need to be removed from the cavity and the applied force should not be higher than the polymer material tensile yield stress [10]. The part-mould forces are due to contact pressure that is increased because of the inherent shrinkage of the polymer onto the surface and the coefficients of friction at the surface [11]. Ejecting parts and the associated demoulding force (F e) can cause part damage such as cracks and stress to the design features [12]. The higher SVR of micro-parts increases the risk of damage during demoulding, and studies on F e have shown that surface friction, the amount of surface area and the contact pressure in this area play an important part [11]. P is known to influence part warpage [13], but it can also increase the demoulding stress [14]. The influence of temperature at ejection is also important; experimental results show that surface T influenced F e and a decrease can be observed with an increase in T, so increasing the control factor T m can be used to reduce F e [15]. A critical temperature range (Tcr) has been identified as important when considering F e for micro-structures [16]. The tool design also has an influence of force where the deformation experienced by the part is influenced by the positions and the number of pins in the mould cavity [17]. Monitoring the factors in the IM process is a method for identifying quality of the moulded parts. Therefore, it is critical to research the influence of different factors on Fe and identify processing optimisation routes to reduce the forces.
Forces experienced during moulding can cause elastic deformation of part features and this can influence part quality. To acquire the necessary information about these forces, a condition monitoring experimental set-up is demonstrated (Sect. 6.3.2). The recorded force curves are of special interest for process optimisation, and in this section, a solution for extracting the force data will be shown. This case study demonstrates a condition monitoring set-up to investigate both injection pressure (P i) and cavity pressure (P c) influences on the demoulding. It has been shown in the previous section that P can be measured by integrating a piezoelectric transducer behind the injection pin. This study also used a second transducer integrated behind the ejector pin where \(P^{\text{i}}_{ \hbox{max} }\) and \(P^{\text{c}}_{ \hbox{max} }\) are used to obtain the highest P value that the tool experiences. The pressure work (\(P^{\text{i}}_{\text{work}}\) and \(P^{\text{c}}_{\text{work}}\)) is calculated using P over t during filling. The P curve is defined with values, corresponding to the data acquisition sample rate, where \(P_{\text{work}}\) starting with P at t start and ending with the mould opening time (t mould_opening), multiplied with the time step of \(\Delta t\) (0.001 s) based on the sample rate of the data acquisition. Thus, the \(P^{\text{i}}_{\text{work}}\) is calculated as follows:
P during demoulding, (Fig. 5), is used to calculate F e (Fig. 6). Here, the focus is on maximum ejection force (\(F^{\text{e}}_{ \hbox{max} }\)) that parts can experience calculated using the following equation:

Injection pressure, cavity pressure and demoulding curves

Enlarged force curve from the demoulding cycle in Fig. 5
P i is indirectly measured using a piezoelectric transducer behind the injection pin, and P c was measured using different transducer behind the ejector pin (Fig. 1). The mould tool was modified to allow the measuring ejector pin at the centre of the insert, and the transducer is positioned on the ejector assembly. When the ejector pushes the part from the cavity, the transducer is subjected to a load that generates an electric power. The power is then converted by a ICAM Type 5073A Industrial Charge Amplifier. The sensor signals are then downloaded to a data acquisition unit and ready for accessed using Labview 8 software.
3.2 An Experimental Case Study for Force Monitoring
A microfluidics part used for smart diagnostic chips is used for this study [18]. The system design has a microfluidics channel system and sections for the application of biosensors for disease detection. The dimensions of the chip are 10 mm in diameter and 1 mm thickness, and the main channels are 50 µm in width with a depth of 80 µm. The mould insert shown in Fig. 7 is made of steel and the polymer material used is Topas cyclic olefin copolymers (COC) 5013. A L16 Taguchi DOE is used to plan experiments where the effects of T b, T m, P h and V i were investigated at two levels and the response variables measured were \(F^{\text{e}}_{ \hbox{max} }\), \(P^{\text{i}}_{ \hbox{max} }\), \(P^{\text{i}}_{\text{work}}\) \(P^{\text{c}}_{ \hbox{max} }\) and \(P^{\text{c}}_{\text{work}}\).

a Microfluidics central inlet b Mould insert c microfluidics rib features
3.3 Validation, Verification and Results Using Force Monitoring
In this case study also a Taguchi design of experiments approach was adopted. For each trial, the effects of the four selected process factors on F e were investigated. For the 160 experiments, the mean \(F^{\text{e}}_{ \hbox{max} }\) was 21.5 N, and the highest and lowest recorded \(F^{\text{e}}_{ \hbox{max} }\) were 26.3 and 8.7 N, respectively. The results for the control factors and their selected levels show that they have a varying influence on \(F^{\text{e}}_{ \hbox{max} }\) and pressure. This is identified by the difference in the results for experiments 1–16, with some experiments showing significant variations. The variation in \(F^{\text{e}}_{ \hbox{max} }\) can be explained with changes in process conditions especially those due to P h and V i. For these two factors, the high settings cause a high \(F^{\text{e}}_{ \hbox{max} }\). It is also observed that a high V i with high P h leads to high \(F^{e}_{ \hbox{max} }\) measurements. The high V i and P h settings result in the highest peaks for both \(F^{\text{e}}_{ \hbox{max} }\) and pressure. A correlation between the pressure and \(F^{\text{e}}_{ \hbox{max} }\) results is observed through measurement and this result from condition monitoring shows the dynamics nature of the process and the differing state of the polymer during processing.
In order to analyse the significance of the process parameters affecting F e, an ANOVA was performed based on the results of the study. The P h was found to be most significantly contributed (20.9%) and increase in its value causes in an increase of \(F^{\text{e}}_{ \hbox{max} }\). V i settings provide the lowest effect (2.7%) meaning that a high or low setting has little influence compared to P h. The main effects of the parameters on \(F^{\text{e}}_{ \hbox{max} }\) show that force is influenced mainly by P h but also that \(F^{\text{e}}_{ \hbox{max} }\) increases as T m is increased. The packing pressure factor associated with P h compresses the polymer in the cavity and this pressure is only released after ejection making demoulding increasingly difficult. A further interaction analysis was used to look at the relationships between one or more control factors. It was shown that P h and V i interactions had a high influence \(F^{\text{e}}_{ \hbox{max} }\), and that interactions between T m and V i had a low influence \(F^{\text{e}}_{ \hbox{max} }\). For optimum parameters levels, it was possible to identify the best settings in respect to controlling F e using the selected µ-IM parameters. In this case, the best condition for part quality is when \(F^{\text{e}}_{ \hbox{max} }\) is at its lowest. It is observed that the lowest \(F^{\text{e}}_{ \hbox{max} }\) values can be obtained by the low settings of the process parameters. The only factor that did not follow this observation was V i where the high settings caused lower force values.
This case study reports on the effects of injection and cavity pressures on demoulding conditions that influence the ejection of the parts from the mould. The following conclusion can be drawn:
-
It was identified that \(P_{ \hbox{max} }\), \(P_{\text{work}}\) and \(F^{\text{e}}_{ \hbox{max} }\) were dependent on the processing conditions and the demoulding force behaviour can be analysed easily by monitoring P.
-
The study showed a direct correlation exists between the P and the demoulding force (Fig. 8). The \(F^{\text{e}}_{ \hbox{max} }\), \(P_{ \hbox{max} }\) and \(P_{\text{work}}\) interval plots showed significant variations between the experiments. These variations are due to the two different P h and V i settings, with the high levels providing an increase of P and \(F^{\text{e}}_{ \hbox{max} }\). The \(P^{\text{i}}_{\text{work}}\) response is closest to the \(F^{\text{e}}_{ \hbox{max} }\) response.
Fig. 8 
Histogram of \(P_{\text{work}}\) and \(F^{\text{e}}_{max}\) results
-
A correlation between the process and the force experienced during demoulding is observed and it is possible to identify factors with a significant (Table 1). \(P^{\text{i}}_{ \hbox{max} }\) variations are attributed to P h with high settings providing a high P.
Table 1 Response table for \(F^{\text{e}}_{ \hbox{max} }\), \(P_{ \hbox{max} }\) and \(P_{\text{work}}\) -
Process setting influence on P and \(F^{\text{e}}_{ \hbox{max} }\) show that T b was the most important factor for \(P^{\text{c}}_{ \hbox{max} }\) and \(P^{\text{c}}_{\text{work}}\), P h was important for \(F^{\text{e}}_{ \hbox{max} }\) and \(P^{\text{i}}_{\text{work}}\) and V i was for \(P^{\text{i}}_{ \hbox{max} }\). For each factor increased settings resulted in a P increase.
-
The high influence of P h shows that the holding phase is critical for filling. A trade-off between P h and demoulding is thus important when considering part damage.

4 Condition Monitoring of Temperature
4.1 Understanding Cavity Temperature
In injection moulding, it is critical to completely fill the parts if a multi-impression cavity is used, and to do this a high melt temperature (T b) and mould temperature (T m) needs to be maintained [19]. For moulding of micro-components, it has been found that filling was influenced mostly by T m and injection speed (V i) [20]. During filling a frozen layer forms at the walls of the mould and this affects the polymer flow. Subsequently, a thicker frozen layer reduces the flow of polymer melt and heat loss increases and further adding to the frozen layer volume. The flow resistance during filling can then cause pressure increases when filling multiple cavities [21]. Runners are generally required to fill multiple cavities and it is important to study the effects of different runner designs on the frozen layer thickness. One solution is to use condition monitoring to measure the maximum cavity pressure (\(P_{ \hbox{max} }\)) during filling [22, 23]. Runner systems for meso-scale components consider the relationship between the part size and weight. The main runner diameter is an important variable for controlling the heat loss [24] and several cross-sectional shapes can also be considered. Some designs have increased heat loss at the walls and use more material volume when compared to circular cross-sectional designs, and for this reason circular geometry is the most efficient [11, 25]. Another option for avoiding runner heat loss is to increase the temperature. However, high temperature settings also mean additional time is required to cool down the polymer to a sufficient ejection temperature [26].
In multi-cavity mould tools, simultaneous filling is essential in order to replicate all features. The mould and polymer temperatures in the cavity are often unknown. Therefore, to ensure the selected temperatures are optimum for filling and cooling cycles, a condition monitoring system can be applied. In this section, a state-of-the-art of cavity condition monitoring for identifying temperature variation during the moulding filling cycle is shown. The case study investigation will provide an experimental procedure for recording temperature readings directly from the runner area of a mould tool. The temperature readings are taken at the entry and end of the runner, where the difference signifies thermal efficiency. The purpose of the runner systems is to fill all of the cavities simultaneously at the same pressure and temperature without a drop in the melt temperature (T b) [27]. Other than cyclic iso-thermal temperature changes the runner temperature is the same as T m. When designing runner systems the selected polymer viscosity (η) change due to heat loss is critical. The heat loss in the material starts at the runner walls where a vitrified layer of polymer becomes an insulator to the polymer at the flow core. The chosen T b must be maintained for the cavity to be filled completely. For micro-moulding, the SVR of the runner should be a consideration and this is due to the high SVR of micro-parts having an effect on the filling behaviour [28]. As a circular geometry is the most efficient cross section, only this runner type is looked at in this case study. To monitor temperature variation, thermocouples at the tool–polymer interface have been used in previous studies [29]. The temperature measurements were taken directly from the runner. K type thermocouples with 500 µm diameter were accommodated to assess the thermal efficiency of the runners (Fig. 9). Temperature measurements were taken at the entry and exit of the runners; the difference between the two identifies the efficiency of the runner. The readings are measured with a 24-bit module instrument.

Condition monitoring mould insert with a runner and 4 × spiral parts
4.2 An Experimental Case Study for Temperature Monitoring
A spiral with a total length of 29 mm and a cross section of 500 × 250 μm was used to investigate the runner size influence on the filling (Fig. 9) [30]. Three tools were made with four identical spiral cavities that are symmetrical in position, and the runner cross section is round with a melt overflow (Fig. 10). The diameter of the runner is in the range of 1–3 mm for the three tools. Two materials PP and ABS are chosen for the experiments and Battenfeld Microsystem 50 was used. The speed and temperature control determine the filling of micro-cavities; therefore, the effects of T b, T m, V i and holding pressure time (t h) are also considered. For each runner size and material, a Taguchi L9 DOE is used. With three runners and two materials selected, six L9 arrays are used and there are ten trials for each combination. For each, the temperature difference in the runner was measured.

3 mm runner test part cross section (40–200 °C scale)
4.3 Validation, Verification and Results Using Temperature Monitoring
The case study demonstrates a condition monitoring system for monitoring the change in the temperature of micro-parts in micro-cavities with a focus on the filling of parts and runner size. The following findings are derived from this research [30].
A temperature rise of the T b was shown for each of the materials and the runner sizes, except for ABS with the 1 mm runner system (Fig. 11). The use of the 2 mm runner resulted in the highest increase of the average temperature while the 1 mm runner was the least subjected to temperature variations. For PP, the temperature variations in the runner system do not seem to affect the filling performance. Markedly, the micro-cavities were completely filled when using the 1 and 2 mm runners yet not with the 3 mm one in spite of the significant increase of temperature compared with the 1 mm runner system. This suggests that PP is not sensitive to temperature fluctuations due to its low viscosity characteristics. On the contrary, the results for ABS suggest that the flow temperature affects the filling performance. Notably, the highest flow length was obtained when the highest temperature increase was recorded using the 2 mm runner system. In contrast, for the 1 mm runner the decrease in temperature led to the lowest flow length.

The temperature changes in the runner system
5 Condition Monitoring of Airflow
5.1 Understanding Cavity Air Evacuation
In this section, the focus will be on the factors that influence the air evacuation from the cavity during the filling stage. One condition for consistent replication results is the evacuation of air or gas from the cavity. Inadequate venting can result in air pockets trapped against the cavity walls and/or between converging flow fronts. A novel condition monitoring of airflow in the micro-cavity will be identified for the purpose of improved part quality and also the prevention of tool damage. The case study will focus on the factors that influence the air evacuation (E a) from the cavity during filling. In μ-IM, the T settings can exceed those used in conventional IM. Distinctly, high T b can improve the polymer flow while high T m leads to a more uniform distribution of residual stresses in moulded parts [31]. However, high T and V i settings can also result in uneven melt fronts, gas traps and burning of the moulded polymers [32]. Increasing T b, T m and V i improves cavity filling, though in some cases the part edge definition can be compromised. One explanation is that the expanding residual air is not completely vented and therefore hinders the melt flow [19]. Liou and Chen observed residual cavities of air in sub-micron structures with high-aspect ratios [33]. Yuan et al. [28] identified that during injection when trapped air was compressed, T could increase and resulting in thermal degradation of the polymer. Ruprecht et al. [34] used E a to prevent the burning of plastic caused by the diesel effect. In this study, \(\dot{Q}\) variations in the cavity area were investigated using an airflow transducer, Omron D6F-01A1-110, as shown in Fig. 12 [35]. This gas flow sensor uses MEMS technology to accurately measure low \(\dot{Q}\) over a range of T. Inside each sensor there is a MEMS flow chip that has two thermopiles on a heater element for measuring deviations in heat symmetry from passing airflow. With no \(\dot{Q}\) present, the T distribution at the heater is uniform and the differential voltage of the two thermopiles is zero volts. With a \(\dot{Q}\) presence, the sensor facing the source of the airflow cools and the opposite side warms thus disturbing the T equilibrium. The T difference results in a differential voltage between the thermopiles which allows \(\dot{Q}\) to be calculated. A National Instruments cDAQ-9172 USB data acquisition records the signal. When the gas sensor is subjected to \(\dot{Q}\), this results in an electrical output that is monitored by a National Instruments NI 9205 16-bit module. In this study, the effects of the process are analysed using a condition monitoring experimental set-up which is capable to measure the maximum flow rate, \(\dot{Q}_{\hbox{max} }\) [ml/s], and calculate the integral of Q [ml]. \(\dot{Q}_{\hbox{max} }\) is monitored in order to determine the peak \(\dot{Q}\) value that the gas sensor has experienced. This value is the maximum of \(\dot{Q}\) over t where \(t_{ \hbox{max} }\) represents the time when \(\dot{Q}\) in the cavity reaches its maximum.

Mould moving half
The total airflow over time, Q, determines \(\dot{Q}\) over the whole duration of the filling stage and is the integral of \(\dot{Q}\). Resulting from the fact that the \(\dot{Q}\) curve (Fig. 13) is defined by the measured discrete values, Q is the sum of \(\dot{Q}\) from the start of the filing stage, t start, until its completion, t end, multiplied by a time step (\(\Delta t\)). The chosen \(\Delta t\) is 1 ms is determined by the sampling rate of the measuring system. Thus, \(Q\) is calculated employing the following equation:

Airflow over time
5.2 An Experimental Case Study for Cavity Airflow Monitoring
The test design used to analyse E a is a 5 mm × 21 mm × 250 µm microfluidics part (Fig. 14). The part includes seven micro-channels with cross sections of 100 × 100 µm2 and 14 mm in length. The part surface area is 226.5 mm2, and the volume is 18.7 mm3. ABS polymer is chosen for experiments and the machine used was a Battenfeld Microsystem 50. The mould tool uses Hasco K-standard modular system parts. To control the amount of E a from the cavity through such a primary vent, a circular channel is machined to accommodate a 4 mm diameter O-ring (46 mm inside diameter). The O-ring surrounds the cavity, seals the shut off faces and restricts E a through the primary vent. The 3 mm diameter half round runner, gate and micro-part cavity, as shown in Fig. 12, are machined on the moving half of the mould by micro-milling . At the flow path end and as far as possible from the gate, a secondary vent, 1 mm × 5 mm × 200 µm, is machined on the cavity face. This vent leads to a 1 mm diameter air relief orifice, through which E a from the cavity is channelled to a sealed airflow transducer. This experimental set-up uses a Taguchi L16 orthogonal array (OA) and the response variables considered are \(\dot{Q}\) max, Q and part flow length.

Part design
5.3 Validation, Verification and Results Using Monitoring
This case study reports on the effects of air evacuation conditions in micro-cavities when moulding. To analyse the airflow during filling, a condition monitoring system is designed and integrated into the mould cavity. The main conclusions from the research are:
-
It is possible to assess air evacuation (E a) conditions during part filling by employing a specially designed condition monitoring set-up. It was shown that maximum airflow (\(\dot{Q}_{\hbox{max} }\)) and airflow over time (Q) were dependent on the processing conditions.
-
The data recorded for \(\dot{Q}_{\hbox{max} }\) and Q shows a normal distribution of the experimental results. This indicates that the process factors significantly influence \(\dot{Q}_{\hbox{max} }\) and Q. Regarding the flow length results, it was observed that the part length was not uniform (Fig. 16).
Fig. 15 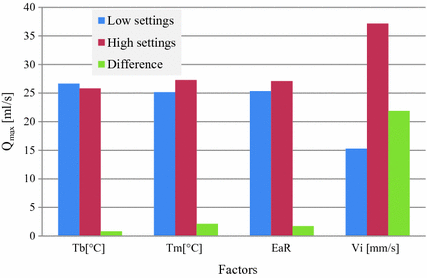
Experiment results for \(\dot{Q}_{\hbox{max} }\) showing the high influence of V i
-
The recorded \(\dot{Q}_{\hbox{max} }\) and Q data have identified the influence of the selected factors for process control. The parameters’ effects on E a suggest that V i can be considered as the most influential parameter (Fig. 15). In particular, an increase of V i led to an increase of \(\dot{Q}_{\hbox{max} }\). This suggests that the increase in the speed of the polymer entering the cavity contributes to an increase in the rate of E a.
-
The part flow length data has identified that an increased resistance to air evacuation (\(E_{\text{a}}^{\text{R}}\)) results in a lower overall flow length (Fig. 16).
Fig. 16 
Variation in the part flow length


6 Conclusions
The characteristics of manufacturing systems are mainly responsible for the development of miniaturised products. Micro-injection moulding is a cost-effective method to develop precision micro-parts in high volume. The engineering challenge tackled in this chapter is to broadening understanding of the moulding process using condition monitoring. To validate this method, four experimental condition monitoring set-ups were designed and implemented, together with a design of experiments approach. The main conclusions from the case studies are as follows:
-
For monitoring of pressure conditions, it is possible to assess cavity pressure conditions during part filling by employing a specially designed condition monitoring set-up. It was shown that results were dependent on both materials and processing conditions. The similar process behaviour for all three polymers has been investigated. The significant reduction in filling has been observed with increase in injection speed and decrease in mould temperature.
-
The study on the effects of injection and cavity pressures on demoulding conditions identified that pressure and force were also dependent on the processing conditions. The findings showed a direct correlation exists between the pressure and force and that by monitoring the pressure behaviour it is possible to analyse the demoulding force. In terms of the chosen settings, it is possible to identify factors with a significant influence on part quality.
-
Temperature condition monitoring was used for the investigation of runner size effects together with other process factors. The results showed that polymer temperature and injection speed settings have a direct influence on the runner filling performance. A chosen runner size can affect the pressure and temperature of the polymer flow and an optimum runner surface to volume ratio can aid filling performance. Importantly, it is shown that runner selection is very important when designing micro-moulds.
-
Filling of mould cavities can be improved by understanding the effects of airflow. The study showed that high process settings and poor venting significantly impact on the filling behaviour. An inability of the cavity air to vent can result in air traps that are bad for the mould and part quality, so there is a design necessity for vents and vacuum for air evacuation in µ-IM.
Condition monitoring as a means of gathering empirical data using a systematic experimental approach is invaluable to engineers who need to identify processing conditions that are difficult to predict. The chapter shows that it is possible to gather and assess complex process behaviour by developing specially designed systems for condition monitoring. In order for engineers to determine the best production routes for less well-known manufacturing processes they consider a wide range of condition monitoring approaches. It is also important for practitioners to investigate new sensor technologies and to find innovative ways of applying those to novel micro-manufacture systems for improved productivity and high precision of micro-parts.
Abbreviations
- ABS:
-
Acrylonitrile Butadiene Styrene
- ANOVA:
-
Analysis of variance
- D :
-
Diameter of the runner
- d :
-
Diameter of measuring
- DOE:
-
Design of experiments
- E a :
-
Air evacuation
- E p :
-
Pressure sensitivity
- \(F^{\text{e}}_{ \hbox{max} }\) :
-
Maximum ejection force
- P:
-
Pressure
- PC:
-
Polycarbonate
- P c :
-
Cavity pressure
- P i :
-
Injection pressure
- \(P_{ \hbox{max} }\) :
-
Maximum pressure
- PP:
-
Polypropylene
- \(P_{\text{rate}}\) :
-
Pressure rate
- PVT:
-
Pressure–volume–temperature
- \(P_{\text{work}}\) :
-
Pressure work
- Q :
-
Airflow rate
- \(Q_{ \hbox{max} }\) :
-
Maximum air flow rate
- SVR:
-
Surface to volume ratio
- T b :
-
Melt temperature
- T m :
-
Mould temperature
- t :
-
Time
- t max :
-
Maximum time
- t h :
-
Holding pressure time
- V i :
-
Injection speed
- µ-IM:
-
Micro-injection moulding process
- η :
-
Viscosity
References
Orzechowski S, Paris A, Dobin CJB (1998) A process monitoring and control system for injection molding using nozzle-based pressure and temperature sensors. In: Proceedings of the 1998 56th ANTEC, pp 424–428
Hellmeyer HO, Lixfield HD, Menges G (1977) Control of maximum pressure in the injection mould. Kunstst Ger Plast 67(4):4–6
Homes W, Kabus R (2001) Controlling injection moulding processes in real time. Kunstst Plast Eur 91(1):29–30
Kuek SC, Angstadt DC (2007) Process monitoring in micro-injection molding. In: Proceedings of the ASME international manufacturing science and engineering conference 2007, MSEC2007, Atlanta, GA
Michaeli W, Schreiber A (2009) Advanced process control for injection molding based on cavity pressure. In: ANTEC 2009—Proceedings of the 67th annual technical conference and exhibition, Chicago, IL, 22–24 June
Michaeli W, Hopmann C, Gruber J (2004) Process control in injection moulding. Kunstst Plast Eur 94(1):20–24
Schnerr O, Kudlik N, Michaeli W (1998) Self-adaptive closed-loop cavity pressure control for injection moulding. In: Society of plastic engineers, Proceedings of the annual technical conference—ANTEC, Atlanta, GA, vol 1, pp 410–413
Griffiths CA, Dimov SS, Scholz S, Tosello G (2011) Process factors influence on cavity pressure behaviour in micro-injection moulding. ASME Trans, J Manufact Sci Eng 133(3):031007 (10 pages). doi: 10.1115/1.4003953
Haberstroh E, Brandt M (2002) Determination of mechanical properties of thermoplastics suitable for micro systems. Macromol Mater Eng 287(12):881–888
Navabpour P, Teer DG, Hitt DJ, Gilbert M (2006) Evaluation of non-stick properties of magnetron-sputtered coatings for moulds used for the processing of polymers. Surf Coat Technol 201(6):3802–3809
Menges G (1993) How to make injection molds. In: Menges G, Mohren P (eds) Hanser Publisher, Munich, Vienna, New York
Heyderman LJ, Schift H, David C, Gobrecht J, Schweizer T (2000) Flow behaviour of thin polymer films used for hot embossing lithography. Microelectron Eng 54(3–4):229–245
Gui DY, Ernst LJ, Jansen KMB, Yang DG, Goumans L, Bressers HJL, Janssen JHJ (2008) Effects of molding pressure on the warpage and the viscoelasticities of HVQFN packages. J Appl Polym Sci 109(3):2016–2022
An C-C, Chen R-H (2007) Experimental study of demolding properties on stereolithography tooling. J Manuf Sci Eng 129(4):843–848
Pontes AJ, Pouzada AS (2004) Ejection force in tubular injection moldings. Part I: effect of processing conditions. Polym Eng Sci 44(5):891–897
Fu G, Tor SB, Loh NH, Tay BY, Hardt DE (2008) The demolding of powder injection molded micro-structures: analysis, simulation and experiment. J Micromech Microeng 18(7):075024 (12 pp)
Kwak S,Kim T, Park S, Lee K (2003) Layout and sizing of ejector pins for injection mould design using the wavelet transform. Proc Inst Mech Eng, Part B: J Eng Manufact 217(4):463–473
Griffiths CA, Dimov SS, Scholz S, Tosello G (2014) Influence of injection and cavity pressure on the demoulding force in micro-injection moulding. ASME Trans, J Manufact Sci Eng 136(3):(10 pages). Paper No: MANU-11-1170. doi:10.1115/1.4026983
Sha B, Dimov S, Griffiths C, Packianather MS (2007) Investigation of micro-injection moulding: factors affecting the replication quality. J Mater Process Technol 183(2–3):284–296
Sha B, Dimov S, Griffiths C, Packianather MS (2007) Micro-injectionmoulding: factors affecting the achievable aspect ratios. Int J Adv Manufact Technol 33(1):147–156
Spina R (2004) Injection moulding of automotive components: comparison between hot runner systems for a case study. J Mater Process Technol 155–156:1497–1504
Coates PD, Whiteside BR, Martyn MT, Spares R, Gough T (2006) Micromoulding—precision processing for controlled products. In: Proceedings of the second international conference on multi-material micro manufacture (4 M), pp 13–15
Min BH (2003) A study on quality monitoring of injection molded parts. J Mater Process Technol 136(1–3):1–6
Yen C, Lin JC, Li W, Huang MF (2006) An abductive neural network approach to the design of runner dimensions for the minimization of warpage in injection mouldings. J Mater Process Technol 174(1–3):22–28
Tang SH, Kong YM, Sapuan SM, Samin R, Sulaiman S (2006) Design and thermal analysis of plastic injection mould. J Mater Process Technol 171(2):259–267
Zhao J, Lu X, Chen Y, Chow LK, Chen G, Zhao W, Samper V (2005) A new liquid crystalline polymer based processing aid and its effects on micro-molding process. J Mater Process Technol 168(2):308–315
Yen C, Lin JC, Li W, Huang MF (2006) An abductive neural network approach to the design of runner dimensions for the minimization of warpage in injection mouldings. J Mater Process Technol 174(1–3):22–28
Yuan S, Hung NP, Ngoi BKA, Ali MY (2003) Development of microreplication process—micromoulding. Mater Manufact Process 18(5):731–751
Bendada A, Derdouri A, Lamontagne M, Simard Y (2004) Analysis of thermal contact resistance between polymer and mold in injection molding. Appl Thermal Eng 24(14–15):2029–2040
Griffiths CA, Dimov SS, Brousseau EB (2008) Micro injection moulding: the influence of runner systems on flow behaviour and melt fill of multiple micro cavities. Proc Inst Mech Eng Part B, J Eng Manufact 222(B9):1119–1130. ISSN 0954-4054. doi:10.1243/09544054JEM1084
Young WB (2005) Effect of process parameters on injection compression molding of pickup lens. Appl Math Model 29(10):955–971
Griffiths CA, Dimov SS, Brousseau EB, Hoyle RT (2007) The effects of tool surface quality in micro-injection moulding. J Mater Process Technol 189(1–3):418–427
Liou AC, Chen RH (2006) Injection molding of polymer micro- and sub-micron structures with high-aspect ratios. Int J Adv Manufact Technol 28(11–12):1097–1103
Ruprecht R, Gietzelt T, Müller K, Piotter V, Haußelt J (2008) Injection molding of microstructured components from plastics, metals and ceramics. Microsyst Technol 8(4–5):351–358
Griffiths CA, Dimov SS, Scholz S, Tosello G (2011) Cavity air flow behaviour during filling in microinjection moulding. ASME Trans, J Manufact Sci Eng 133(1):011006 (10 pages). doi:10.1115/1.4003339
Author information
Authors and Affiliations
Corresponding author
Editor information
Editors and Affiliations
Rights and permissions
Copyright information
© 2018 Springer International Publishing AG
About this chapter
Cite this chapter
Griffiths, C.A. (2018). Condition Monitoring in Micro-Injection Moulding. In: Gupta, K. (eds) Micro and Precision Manufacturing. Engineering Materials. Springer, Cham. https://doi.org/10.1007/978-3-319-68801-5_6
Download citation
DOI: https://doi.org/10.1007/978-3-319-68801-5_6
Published:
Publisher Name: Springer, Cham
Print ISBN: 978-3-319-68800-8
Online ISBN: 978-3-319-68801-5
eBook Packages: EngineeringEngineering (R0)