
Abstract
To accelerate market penetration of EVs, installing a proper charging infrastructure is necessary. The total cost of operating electric vehicles includes vehicle cost, infrastructure cost, and energy consumption cost. We compared the total cost associated with plug-in hybrid (PHEV) and On-Line Electric Vehicles (OLEV), i.e., plug-in versus wireless charging. Because of the high cost of the battery, OLEV is more cost efficient in a mega-city where many vehicles can share the roadways’ wireless charging infrastructure. As battery costs fall, EVs with larger batteries will become more cost competitive. Even then, the infrastructure for OLEV can be used as charging infrastructure for PHEVs or PEVs by adding onboard pickup devices to the vehicles.
Access provided by CONRICYT-eBooks. Download chapter PDF
Keywords
- Electric Vehicle
- Electricity Price
- Hybrid Electric Vehicle
- Gasoline Price
- Energy Information Administration
These keywords were added by machine and not by the authors. This process is experimental and the keywords may be updated as the learning algorithm improves.
1 Introduction
Increasing concerns about global warming and soaring, energy costs are stimulating technological innovation in the transportation sector to make it greener. Among the eco-friendly vehicles recently developed or under development, the electric vehicle (EV) is the most feasible and economical alternative with potential to displace a significant portion of petroleum consumption by using electricity for all or a portion of given trips [1]. According to [2], hybrid-type EVs will grow rapidly (global CAGR of 16.6% between 2008 and 2015). To accelerate market penetration of EVs, installing proper charging infrastructure is required. Depending on the charging infrastructure type, vehicle cost , infrastructure cost for EVs, and consumers’ charging behavior should be determined. The most well-known charging infrastructure type in the current market is the plug-in charging system. Under the plug-in-type infrastructure, the EV is only able to recharge at locations with plug-in charging stations and charging takes a longer time. Overnight charging at a home garage or apartment complex is a generally accepted charging scenario for plug-in EVs. To achieve longer trips without recharging, plug-in EVs require larger batteries, which are expensive and heavy.
Another charging infrastructure for EVs is the so called roadway power system [3], OLEV system [4], and dynamic connection [1]. Under these systems, EVs can be connected to an external source of energy along a roadway while moving. While there are many different terminologies for EVs under roadway power systems, currently only the OLEV is commercialized in Korea. Compared to plug-in EVs, the OLEV requires a smaller battery and consumers do not need to allocate time for charging, although it requires infrastructure along a small percentage of heavily travelled roadways.
As mentioned above, charging infrastructure type affects many aspects of EV cost and market penetration. It is therefore necessary to compare the total cost associated with EV market penetration considering certain charging infrastructure type. In this chapter, we consider vehicle cost , infrastructure cost , and energy cost in Seoul, Korea, a case of particular interest because Seoul is a typical mega-city, which is the most appropriate venue for an EV test bed. By evaluating the total cost related to EV infrastructure and utilization, a more cost-efficient system can be determined. The results of the comparison provide useful insight into installing EV infrastructure country wide, a task that requires large investment. Nevertheless, the infrastructure can be used for a long time once installed.
2 Comparison OLEV with IC Engine
Before we compare the economic effect of charging infrastructure type of electric vehicle, we would like to mention the economic benefit of OLEV bus compared to CNG bus based on real operation data. From March of 2014, we start operate two OLEV buses as ‘7’ line bus in Gumi city. Each OLEV bus operated about 250 km per day.
The major economic benefit of OLEV comes from energy cost saving. Energy costs differ from different countries. So, this comparison result is based on Korea and the results will be different in other country. Table 22.1 shows the energy cost and efficiency of different vehicle types.
As results, OLEV bus can save 73% of energy cost comparing to CNG bus. The energy cost is calculated with 250 km driving per day. If the driving distance increases, the cost saving effect will increase accordingly.
Based on energy cost comparison results, we can compare two different types of buses as life time cost perspectives. We assume that each bus can be operated for 10 years and basic operating cost and maintenance cost are same. Table 22.2 summarizes the life time cost comparison results.
After ten years operation with government subsidy, OLEV bus can save 337,960$ comparing to CNG buses, 54% of total cost. If we consider CO2 emission as cost, the saving amount will increase. By using OLEV bus, the city can save 118 ton∙CO2/year compared to CNG bus.
The results shows that OLEV bus is more efficient system compared to CNG without considering government subsidy. Also, OLEV bus cost will be decreased with the increasing the production volume, while CNG bus cost is almost saturated.
3 Vehicle Technologies and Cost
The vehicle type considered is a four passenger compact car that is the same size as popular HEVs and PHEVs in the current market. At present, pure EVs have limitations in use because of the limited driving range from the lack of infrastructure and the high battery cost . Hence, we use a hybrid-type EV in the comparison, which uses electricity as the primary power source. Hybrid-type EVs have the same efficiency as HEVs after the charge-depleting range. To compare the total cost under different EV charging systems, we use two types of hybrid-type EVs in the comparison: a PHEV(Plug-in Hybrid Electric Vehicle) and an OLEV (On-Line Electric Vehicle).
3.1 PHEV
A PHEV is an HEV with the ability to recharge its energy storage system with electricity from a plug-in charging station. With a fully charged energy storage system, a PHEV will bias toward using electricity over liquid fuels. The secondary energy carrier for the PHEV is a liquid fuel, such as gasoline, stored in the vehicle.
In EV mode, the driving efficiency (motor input energy/distance) of the PHEV is 0.2 kWh/km which is an average of commercialized PHEVs and EVs in the market. In HEV mode, the efficiency is the same as that of a HEV. The efficiency of currently available HEVs in the market, such as the Toyota Prius and GM Volt, is 50 mpg. The PHEV is assumed to have a 16 kWh Lithium-ion battery, as used in the GM Volt.
For the PHEV, the electricity power transfer efficiency from the inverter to the motor is presented in Fig. 22.1.

Electricity power transfer efficiency of PHEV
To calculate overall power transmission efficiency in charging plug-in-type EVs, power transmission efficiency from inverter to pickup (Efficiency 1) and from battery to motor (Efficiency 2) need to be considered. The overall power transfer efficiency is 76%. This means 24% energy loss occurs during the transfer at the current technology state. The total efficiency for the PHEV in EV mode including driving efficiency and power transfer efficiency is 0.26 kWh/km.
3.2 OLEV
The On-Line EV (OLEV), a so called Roadway-Powered EV [5,6,7,8], uses wireless charging technology based on the concept of shaped magnetic field in resonance (SMFIR) charging. The transmitted electric energy based on magnetic resonance is used for powering motors and recharging batteries on the vehicle. It also has a relatively smaller battery than PHEVs to minimize the installation of underground power supplier lines. In the study, the typical OLEV is assumed to have a 5 kWh lithium-ion battery and the capacity of the onboard pickup device is assumed as 10 kWh/h, which means 10 kWh can be transmitted to the OLEV in one hour, through the magnetic resonance charging technology.
An OLEV is an HEV with the ability to recharge its energy storage system, as is the case of the PHEV. On a power supply road or with a fully charged energy storage system, the OLEV will bias toward using electricity over liquid fuels. In EV mode and HEV mode, the driving efficiency is the same as that of the PHEV. The only difference is the charging mechanism.
For the OLEV , the electricity power transfer efficiency from the roadway inverter to the motor is described in Fig. 22.2. The overall power transfer efficiency is 64%. Because of the loss that occurs in the air gap, the overall efficiency of the OLEV is lower than that of the PHEV. The total efficiency of the OLEV in the EV mode including driving efficiency and power transfer efficiency is 0.31 kWh/km.

Electricity power transfer efficiency of OLEV
3.3 Vehicle Cost
The PHEV and the OLEV are based on the HEV paradigm. The main differences are the onboard pickup charging device and the size of the battery due to the distinct charging mechanism. Hence, we estimate the vehicle costs based on a currently available HEV, the Toyota Prius, and add the cost of the onboard charging device and battery. The average Prius manufacturer suggested retail price (MARP) in 2013 was $24,200 including a 1 kWh lithium-ion battery. The PHEV is assumed to have a 16 kWh lithium-ion battery, as used in the GM Volt, which is most dominant PHEV model in the market. For the OLEV, a 5 kWh lithium-ion battery is assumed. To estimate the vehicle cost, we use the estimated battery cost from [9]. According to a medium cost scenario [9], the battery cost in 2011 is $915/kWh and it will decline at a CAGR (Compound Annual Growth Rate) of 8.8% until 2019 and at 3.5% from 2020 to 2030. The estimated vehicle costs in 2013 are summarized in Table 22.3.
HEV base cost means the cost of the HEV excluding the battery. We assumed the onboard pickup device cost for both PHEV types is $1000 [1]. The onboard pickup for the OLEV is assumed as $5000 according to the OLEV manufacturer with the assumption of mass production. We also estimated the vehicle cost until 2022. The only underlying assumption is that the battery cost will decline according to [9] and other costs such as motor, chassis and body will be same because those are quite matured component and no much change to decline as time pass. The reason for the cost difference between two types of EV stems from the size of the battery and the others are shared. With declining battery cost , the cost difference between the PHEV and the OLEV decreases.
4 Charging Infrastructure Types
For EVs, the infrastructure is a necessary condition for their penetration. To install the infrastructure, huge social investment is required. Once the infrastructure is installed, it will undergo very little change. Various types of infrastructure for EVs are under evaluation by many stakeholders to better understand their capability and potential benefits. The cost associated with providing certain type of charging infrastructure for the EV, along with additional costs for onboard electronics and added battery capacities with different EV technologies, will be a key factor in the success of particular EVs.
4.1 Plug-in Infrastructure for PHEV
The standalone EV charger for the home is around $5000, and the construction cost is about $2000 in Korea. The Korean government supports up to $7000 per home to install the charger. Therefore, we assumed $7000 for the PHEV infrastructure per vehicle.
4.2 On-Line Infrastructure for OLEV
To estimate the On-Line infrastructure cost for the OLEV , we need to determine the length of power supplied roadway and the unit cost. To estimate the length, we consider the Seoul case as a representative mega-city.
-
(1)
OLEV energy harvesting and consumption pattern
We assume that the power supplied roadway is installed only in the inner city where most traffic occurs to maximize the cost efficiency of the infrastructure. Outside of the city, the OLEV operates in HEV mode. To decide the length of power supplied roadway installed in the inner city, we test the OLEV energy harvesting from the power supplied roadway and consumption pattern according to the typical driving cycle in the mega-city. In the test, we assume that the power supplied roadway is only installed where vehicles stop and idle on the roadway. Vehicles usually spend much time stopping in front of traffic lights. We use the Japan 10–15 case which shows typical vehicle driving patterns in the mega-city. It involves an average speed of 22.7 km/h and 32% idling time during the total driving time with a total distance of 4.2 km. The case is very similar to Seoul’s driving cycle. The average speed of vehicles in Seoul is 23 km/h and the idling time is 27% (during the total driving time). For the OLEV, 20% of the battery capacity(1 kWh) is always restored and not usable and another 1 kWh is restored to be used in HEV mode. Hence, 3 kWh is available to supply power to the motor during driving. To investigate the energy harvesting from the power supplied road and energy consumption, we test three different cases based on the initial battery SOC (State of Charge): 4 kWh (full charge), 2.5, 1 kWh (minimum charge).
-
Initial battery SOC: 4 kWh (Full charge)
Figure 22.3 shows the battery SOC and energy consumption. Energy is harvested when the vehicle stops and the onboard pickup capacity of the OLEV is 10 kWh/h. With a fully charged battery, the OLEV is operated fully in EV mode during the test by using 1 kWh while harvesting 0.45 kWh energy from power supplied roadway . After the test, the battery SOC is 3.45 kWh.
Fig. 22.3 
OLEV battery SOC and energy consumption: 4 kWh
-
Initial battery SOC: 2.5 kWh (Full charge)
Figure 22.4 shows the OLEV is also fully operated in EV mode when the initial battery SOC is 2.5. During the test, the OLEV harvests 0.6 kWh while consuming 1 kWh. After the test, the battery SOC is 2.1 kWh.
Fig. 22.4 
OLEV battery SOC and energy consumption: 2.5 kWh
-
Initial battery SOC: 1 kWh (Minimum charge)
According to Fig. 22.5, the OLEV uses 0.6 kWh, which is harvested while idling in EV mode. From the battery to the motor, the power transfer efficiency (Efficiency 1) is 85% and the driving efficiency is 0.235 kWh/km. With 0.6 kWh, the OLEV travels 2.52 km of the 4.2 km test bed. Therefore, with the minimum battery SOC, the OLEV travels 60% of the total distance in EV mode.
Fig. 22.5 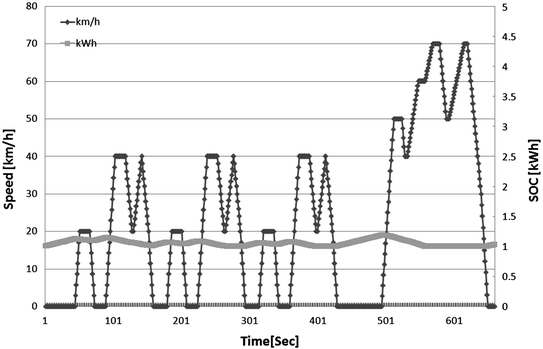
OLEV battery SOC and energy consumption: 1 kWh
From the three cases, it is shown that the OLEV travels at least 60% of the total distance in EV mode in the worst case and in other cases it is fully operated in EV mode. In the comparison, we assume that he OLEV travels 80% of the total distance in EV mode in the inner city where the power supplied roadway is installed in case vehicles are idling and the OLEV starts to operate with full charge.


-
(2)
Length of power supplied roadway
To estimate the length of power supplied roadway in Seoul, we assume that the distance of idling is 15% of the total distance. Mostly, vehicles idle in front of traffic lights. Table 22.4 shows the roadway profile of Seoul and the length of power supplied roadway that should be installed.
Table 22.4 Roadway profile in Seoul and power supplied roadway We exclude 2-lane roadways for installation of the power supplied roadway . The length of 2-lane highways is quite substantial but in most cases 2-lane roads are used to travel very short distances, and thus can be disregarded. As a result, a power supplied roadway of 1453 km is constructed in the inner city and it covers 6% of the total lane-km. By installing 6% of the total lanes, the OLEV can travel 60% of the total distance by using electricity, which is cheap and emits less CO2 than the use of fossil fuels.
-
(3)
Unit cost per kilometer for power supplied roadway
Cost associated with the power supplied roadway includes the roadway inductor, the power conditioners and distribution system, and labor involved with installation as well as engineering. According to the PATH project, the estimated roadway cost under a conservative scenario is $1,950,000 per lane-mile and $1,180,000 per lane-mile under an optimistic scenario. In the comparison, we assume $0.5 m/km for the power supplied roadway cost for an OLEV with mass production.
In installing the power supplied roadway for the OLEV in Seoul, $726 M is needed. The cost is the same as the infrastructure cost for the PHEV when the number of PHEVs in the market reaches 103,772, which is 4% of the total number of vehicles in Seoul. In Seoul, there are 2.5 million vehicles.
5 Energy Cost
PHEV and OLEV use gasoline in HEV mode and electricity in EV mode. The different infrastructure systems affect the energy consumption patterns and this results in a difference in energy costs for the two vehicle types.
5.1 Key Assumptions
To estimate the energy cost for PHEVs and OLEVs in Seoul, we employ the underlying assumptions presented in Table 22.5.
-
Projected gasoline price
To estimate the energy cost during the vehicle life time, the gasoline price in the next 10 years is required. To project the gasoline price, we use the annual world oil price from 2005 to 2035 by the U.S. Energy Information Administration (EIA) in 2010. We use the reference case among three cases. According to the projected oil price in the reference case, we project the gasoline price by 2035 because gasoline price is mainly influenced by the material price 5.
-
Projected electricity price
To project the electricity price, we also use the reference case of the average annual U.S. retail electricity prices from EIA (2010). Electricity price is influenced by many factors such as fuel, generation method, and distribution. Fuel cost accounts for most of the cost and EIA uses the projected worldwide fuel cost to estimate the electricity price in the future. Similar to the U.S.A., Korea plans to increase renewable and nuclear energy dependence in the future. Hence, we project the electricity price based on electricity prices from EIA (2010) by 2035.
5.2 PHEV Energy Cost
To estimate the energy cost for the PHEV, we use the distribution of driving distance per trip based on national statistics (KTSA 2009) rather than a constant distance assumption. The distribution of driving distance has an important impact on fuel economy. Figure 22.6 shows the ratio of driving distance per trip in terms of frequency and distance. Most trips involve short driving distance. While long trips are infrequent, they are important because their length makes them a significant portion of the total distance travelled.

Driving distribution per trip
Long trips reduce the PHEV energy efficiency because the PHEV travels in HEV mode after the charge-depleting range. In the study, we assume that the PHEV has a fully charged battery when it starts each trip. This is an optimistic assumption because it assumes higher fuel cost saving by using more electricity rather than gasoline, which is more expensive.
A PHEV with a 16 kWh battery can use 12 kWh for power. 3 kWh is always restored for the minimum battery SOC and 1 kWh for the HEV mode. With a fully charged battery, the PHEV travels 50 km with 0.23 kWh/km driving efficiency considering 85% of power transmission efficiency from inverter to pickup. The PHEV travels in HEV mode after 50 km. According to Fig. 22.6, the PHEV travels 24% of the total distance in HEV mode.
Estimated energy cost for the PHEV in 2013 under the assumption is $589. Energy cost during the vehicle life (10 years) can be calculated according to the projected gasoline and electricity prices.
5.3 OLEV Energy Cost
The OLEV travels in EV mode in the inner city where the power supplied roadway is installed. During the inner city travel, 80% of the total distance is travelled in EV mode. According to a national household travel survey by the Ministry of Land, Transport and Marine affairs (2009), trips to and from work account for 81% of total driving. Therefore, we assume that 81% of total vehicle travel distance occurs in the city. Consequently, the OLEV is assumed to travel 64% of the total distance in EV mode.
Estimated energy cost for the OLEV in 2013 under these assumptions is $803. The OLEV energy cost for 10 years can be calculated according to the projected gasoline and electricity prices.
6 Results of Comparison Analysis
To compare the effects of infrastructure type in EV penetration in a mega-city, we compare the total cost between the PHEV and OLEV . Lower total cost will allow faster and more efficient market penetration. The OLEV has a lower vehicle price due to its smaller battery but has higher energy cost . The whole infrastructure for the OLEV must be installed before a single OLEV appears. The PHEV has a higher vehicle cost due to the larger battery size and lower energy cost. Its infrastructure increases as the PHEV increases. These differences are mainly due to the different charging infrastructure. Hence, the economic impact of the different charging infrastructure is analyzed to predict the EV market penetration potential.
6.1 Comparison Results
In the comparison, the total cost includes vehicle cost , energy cost for the vehicle life time, and infrastructure cost . Since the PHEV and OLEV are in the same category of an advanced hybrid vehicle, tax, insurance, and repairs have not been considered.
-
Total cost comparison
Table 22.6 shows the associated costs in 2013. Energy cost reflects the next projected gasoline and electricity costs for the next 10 years.
Table 22.6 Total cost comparison in 2011 The infrastructure cost for the PHEV is a variable cost whereas the OLEV has a fixed infrastructure cost and the cost is shared by the number of OLEVs distributed. Hence, we need to compare the total cost according to the number of vehicles. In the comparison, we assume that the number of vehicles is assigned to each type of vehicle and compare the total cost along the given number of vehicles. In 2013, if the number of vehicles exceeds 75,573 the total cost of the OLEV becomes less than that of the PHEV. 75,573 vehicles cover only 3% of the total number of vehicles in Seoul. The total number of vehicles in Seoul is 2,500,000. Economic benefit by adopting OLEV compared to PHEV is mainly due to the high vehicle cost of PHEVs compared to OLEVs in 2013. If 10% of the total number of vehicles is changed to hybrid based EVs in 2014, the total cost for the OLEV is $10,947 while the PHEV’s total cost is $12,324. By adopting the OLEV, $1377 M can be saved. If the number of vehicles increases, the amount of cost savings will increase.
-
Total cost comparison from 2013 to 2022
Each year, total cost changes according to the estimated vehicle cost and project energy cost . We compare the total cost between the PHEV and OLEV from 2013 to 2022, when the hybrid type of EV is expected to be dominant in the market [2]. Figure 22.7 illustrates the breakeven point of the total cost for the OLEV compared to the PHEV regarding the number of vehicles.
Fig. 22.7 
Breakeven point for OLEV compared to PHEV
Until 2022, the total cost of the OLEV is always less than that of the PHEV. In the earlier stage, the breakeven point for the OLEV is lower because the vehicle cost of the PHEV is higher due to its expensive battery. The large fixed cost of infrastructure for the OLEV is compensated by the high vehicle cost of the PHEV with a small number of vehicles. As time passes, the breakeven point increases because the vehicle cost decreases according to the cost change of batteries and increased gasoline price. In 2020, the OLEV reaches the breakeven point where 6% of conventional vehicles are converted to hybrid-type EVs.
-
Comparison of cost factor
To analyze each cost factor’s impact on the total cost along the time period, we fixed the number of converted vehicles each year at 250,000 (10% of total number of vehicles). Figure 22.8 shows the comparison results.
Fig. 22.8 
Comparison of cost factors
In both vehicle types, the vehicle cost occupies most of the total cost. The vehicle cost for the PHEV is relatively higher and its energy cost is lower than that of the OLEV . The total cost of the PHEV decreases due to the diminishing vehicle cost even though the energy cost increases slightly. The OHEV’s energy cost increases at a relatively steeper rate because it depends on gasoline more than the PHEV. The total cost for the PHEV is higher all the time because the vehicle price itself is higher and the infrastructure cost increases as the number of vehicles increases. Even though the OLEV requires a huge investment for initially installing the infrastructure, if the number of vehicles converted to HEV based EVs is over 103,772 (4% of total passenger cars in Seoul), the total infrastructure cost for the OLEV falls.
-
Oil price change effect to total cost
According to our assumptions, OLEV is driving in EV mode for 64% of its total mileage, while PHEV for 76%. Hence, OLEV’s energy cost is more sensitive to the oil price. In our comparison, we assumed the reference oil price is 1.65$/l in Fig. 22.5. If the oil price increase 30%, and 10% of the total number of vehicles is changed to hybrid based EVs in 2014, the total cost for the OLEV is $11,398 while the PHEV’s total cost is $12,609. By adopting the OLEV, $1211 M can be saved and the saving is decreased by $166 M, 12% of total saving comparing to the original Oil price. Even though, OLEV depends more on Oil resource, the sensitivity is not crucial to affect the total cost comparison because the oil resource cost is very small portion in total cost.


6.2 Discussion
According to the results, the OLEV is more cost efficient when the battery cost is high. To advance EVs to the market to ensure a secure energy source and address environmental issues, the charging infrastructure decision should be made to adopt the On-Line system for OLEVs in the future. When the battery cost becomes sufficiently low, the PHEV or a pure EV also can be an alternative. Even at that time, the infrastructure for the OLEV can be used by adding an onboard pickup device to the PHEV or a pure EV. Hence, the investment to the power supplied roadway will not be wasted if any type of EV is ultimately used, as they always require charging.
In addition to advancing the OLEV technology, there are strong implications regarding the commercial value of this technology. Researchers from the National Renewable Energy Laboratory in the U.S.A. assessed the economics of the various types of electric vehicles based on U.S. market data-based assumptions for the battery, motor, and engine [1]. Under the U.S. environment, they compared the economics of conventional vehicles, hybrid electric vehicles (HEVs), plug-in hybrid electric vehicles (PHEVs) with various all-electric driving ranges, pure electric vehicles (EVs) with an 80 mile range, and electrified hybrid electric vehicles (EHEVs). The EHEV can connect to an external source of energy along some roadways while moving. The OLEV technology is a candidate for this kind of dynamic plug-in. According to their results, using current battery cost and life, PHEVs and EVs were not cost effective for many different configurations. The EHEV is the only alternative to provide a cost-effective pathway to vehicle electrification. Therefore, the outcome of [1] strongly supports our results from a different angle.
7 Conclusions
To accelerate market penetration of EVs, installing a proper charging infrastructure is necessary. Depending on the charging infrastructure system, vehicle cost , infrastructure cost , and energy consumption patterns are determined. In the study, we compared the total cost associated with PHEVs and OLEVs regarding the infrastructure system. Due to the expensive battery, the OLEV is more cost efficient in a mega-city where lots of vehicles share the roadways in the city. As battery costs fall, EVs with larger batteries will be more efficient. Even at that time, the infrastructure for OLEVs can be used as charging infrastructure for PHEVs or PEVs by adding onboard pickup devices to the vehicles.
The current analysis results are based on various assumptions regarding the technology of vehicles and battery cost trend and projected energy cost . These assumptions accordingly impact the results. Another limitation is that the study considers only the total cost minimization for EV penetration. The perspective of consumers who make a decision of purchasing vehicles is not included. Another limitation is that the comparison analysis is done based on a mega-city, Seoul, Korea. Smaller cities or different countries will have different driving patterns and energy costs. Hence, to generalize the results, it is necessary to expand our study to different city sizes and different countries.
In further comparison, the optimal system for PHEV and OLEV should be identified. By adapting the battery size, onboard pickup capacity, and the ratio of power supplied roadway , optimal PHEV and OLEV systems that minimize the total cost can be established. Based on optimal systems, the comparison results and related conclusions can be different. Also, the optimal PHEV and OLEV should be compared for other green car options such as fuel cell vehicles and pure electric vehicles.
References
Brooker A, Thornton M, Rugh J (2010) Technology improvement pathways to cost-effective vehicle electrification. NREL/CP-540-47454
Pike Research (2010) Hybrid electric vehicles for fleet markets. Available via http://www.pikeresearch.com/research/hybrid-electric-vehicles-for-fleet-markets. Accessed 08 Dec 2010
California PATH Research Report (1996) Roadway powered electric vehicle project, parametric studies: phase 3D final report. UCB-ITS-PRR-96-28
Lee SL, Park CB, Cho GH, Huh J, Choi NS, Rim CT (2010) On-line electric vehicle using inductive power transfer system. Energy Convers Congr Exposition (ECCE): 1598–1602
Bolger JG, Kirsten FA, Ng LS (1978) Inductive power coupling for an electric highway system. IEEE Veh Technol Conf 28:137–144
Zell CE, Bolger JG (1982) Development of an engineering prototype of a roadway powered electric transit vehicle system: A public/private Sector Program. IEEE Veh Technol Conf 32:435–438
Shladover SE (1987) Roadway-powered electric transit vehicle—progress and prospects. Transp Res Rec 1155:28–36
Covic GA, Boys JT, Kissin MLG (2007) A three-phase inductive power transfer system for roadway-powered vehicles. IEEE Trans Industr Electron 54(6):3370–3378
Hensley R, Knupfer S, Pinner D (2009) Electrifying cars: how three industries will evolve. McKinsey quarterly 3:87–96
Author information
Authors and Affiliations
Corresponding author
Editor information
Editors and Affiliations
Rights and permissions
Copyright information
© 2017 Springer International Publishing AG
About this chapter
Cite this chapter
Park, J.H., Jeong, Y.H. (2017). The Economics of Wireless Charging on the Road. In: Suh, N., Cho, D. (eds) The On-line Electric Vehicle. Springer, Cham. https://doi.org/10.1007/978-3-319-51183-2_22
Download citation
DOI: https://doi.org/10.1007/978-3-319-51183-2_22
Published:
Publisher Name: Springer, Cham
Print ISBN: 978-3-319-51182-5
Online ISBN: 978-3-319-51183-2
eBook Packages: EngineeringEngineering (R0)