
Abstract
The seismic response of a building structure is generally evaluated using simplified methods based on elastic response spectra which pass by a linear elastic analysis still takes no account of the true behavior of the structure which may be the both linear and non-linear. To consider the problem of non-linearity, non-linear methods have emerged as static methods (Pushover) and nonlinear temporal dynamics. The purpose of this communication is to use these two methods to evaluate the seismic response of two types of structures: (1) mixed (web + frame) and (2) freestanding gantry, both located in a zone of high seismicity. The dynamic analysis is conducted from two known accelerograms: El Centro 1940 Kobe 1995. The results show that the mixed structure has a better performance vis-à-vis the seismic actions.
Access provided by CONRICYT-eBooks. Download conference paper PDF
Keywords
These keywords were added by machine and not by the authors. This process is experimental and the keywords may be updated as the learning algorithm improves.
1 Introduction
In seismic regulations, the study of the response of building structures to the effects of earthquakes is conducted using simplified methods based on response spectra. These methods allow engineers to use either a linear analysis for the calculation of forces and displacements, but conventional linear elastic methods are not generally consistent, so we had to find nonlinear methods to determine the design of a structure, for example the method of nonlinear static analysis “Pushover” and the non-linear temporal dynamic method based on accelerograms. The recent earthquakes such as earthquakes (El Centro 1940 Boumerdes 2003; Kobe 1995) where the majority of reinforced concrete structures were damaged or destroyed have indicated the need to assess the actual seismic behavior of existing buildings. In particular, the seismic rehabilitation of reinforced concrete structures in areas with strong sismicités. The main objective of this study is to apply the application of Pushover method on two types of reinforced concrete structures (R + 5): one consists of a mixed bracing system (web + frame) and the other consists of a freestanding system in both directions located in a high seismic zone and dimensioned according to the Algerian seismic regulations RPA 99/2003 [1]. The 2nd structure are used as a reference used for comparison by the structure 1st specifically calculating the capacity curve, the point of seismic performance, check the vulnerability and the state of damage that can occur in the structure of an upcoming earthquake terre. Egalement, for comparison a direct non-linear dynamic analysis was conducted on the specific structures based on two chosen accelerograms (El Centro 1940 and Kobe 1995) to assess the dynamic response of structures themselves considered in terms maximum relative displacement, lateral displacement and maximum floor shear and check the results obtained with the Algerian seismic regulations RPA99 2003 [1] version.
2 Nonlinear Static Method
The Pushover method is based on the assumption that the response of the structure which can be likened to the response of a system with a single degree of freedom equivalent, which means that the response is basically controlled by a single mode of vibration and the form of this mode, remains constant during the duration of the quake. As part of the analysis “Pushover”, we considered a modal distribution of applied forces established by FEMA 450 code:
where:
-
\( C_{v,i} \) the coeficient of distribution of forces.
-
V the total lateral force.
-
\( w_{j}^{{}} \) the weight of the level j.
-
\( h_{j} \) the height of the level j (measured from the base).
3 Evaluation of the Seismic Response of Structures Considered by the Nonlinear Static Method (Pushover)
The methodology of the nonlinear static method on structure considered for obtaining the capacity curve and the performance point, and determining lateral displacements at each stage and the distribution of shearing forces at the floors, and to highlight what level of damage can be classified structures.
3.1 Mixed Structure (Web + Frame)
The non-linear calculation provides a structure capacity curve. This curve represents the horizontal force to the base of a function building movement there of (Fig. 1). The capacity curve is generally formed by a linear elastic nature phase followed by a nonlinear phase corresponding to the formation of plastic hinges, features elastic limits (shear-displacement) show that the structure has a greater margin plastic.

Shear force to the base according to the movement of the roof of the structure
Several reference points were placed on the curve to show the different states of the building when loading.
-
Point A: corresponds to the point of origin.
-
Point B: is the elastic behavior of the structure and represents the normal level of seismic design. It therefore indicates a state of surface damage (or non damage).
-
Point C: We continue loading, the appearance of plastic hinge type B at the left of the inner ends of the beams line C.
-
Point D: With the increased loading capacity curve and reached the maximum at this level is moderate lamination type IO and LS at the beams so the building is considered damaged.
Following transformation of the screen capacity curve (D-T) format (S d -S a ) (Fig. 2), and after changing the seismic coefficients Cv and Ca, the intersection between the curve and capacity of the response spectrum gives the performance point at coordinates (S a -S d ) = (0.865; 0.028) this corresponds to a lateral force to the base of the structure 6 162.820 Kn for 4.00 cm displacement of the stage gravity center roof. The appearance of the plastic phase is numerically very divergence.

Curve capacity of the mixed structure (web + frame)
3.2 Freestanding Structure
Figure 3 illustrates the size capacity curve (D-T) is generally formed by a linear elastic nature phase followed by a nonlinear phase corresponding to the formation of plastic hinges, features elastic limits (shear-displacement) show that the structure has a larger plastic margin.

Shear force to the base according to the movement of the roof of the freestanding structure
-
Point A: corresponds to the point of origin.
-
Point B: corresponds to the appearance of the first plasticity in the building (points on the structural elements). The first points of plasticity appear in the beams of the RDC (axis 1) reaches its elastic limit (type of plastification B) and is localized at their ends and the shear force is still lower than that of Algerian regulation, after appearance ball joints at the columns of the DRC (1 file axis A, B, C and D) due to the axial force required to balance the time dictated by the lateral force, and also under the effect of the weight of the upper floors. These elements verify the real behavior of the structure.
-
Point C: we continue loading, the appearance of plastic hinges IO type and capacity curve reaches the maximum level at which the building is considered damaged.
-
Point D: The maximum shear force is obtained approximately at this point and plasticizing to moderate type LS, beyond this value the system is no longer able to support the load and shear force that remains constant the displacement increases.
-
Point E: shear takes the maximum value to the maximum displacement after a rapid decrease in the value of the sheer force and the appearance of various important plastification (CP, C and D) so the collapse of structure.
Figure 4 shows the formation of plastic hinges to the type “D” corresponding to the ruins at the columns, especially those in the RDC because of the significant efforts submitted to them and at the level of the beams.

Formation plastic hinges just before the ruin
The coordinates point of the performance (S a , S d ) = (0.126, 0.104) corresponding to a lateral force to the base of the structure of 619.541 kN to 12.5 cm of displacement at the center of gravity of the roof floor (Fig. 5).

Curve capacity of the freestanding structure
-
A comparison of the responses is conducted for both types of structure in terms of maximum lateral and shear forces to the base. From Fig. 6 it is found that:
Fig. 6 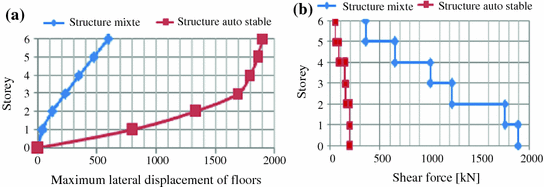
Maximum lateral displacements a and sharp Efforts b of the analyzed structures obtained by nonlinear static analysis
-
The maximum lateral movement of the free-standing structure is more important. For example it is noted for the last stage a shift of 0.19 m for the freestanding structure and a displacement of 0.07 m for the mixed structure.
-
The values of the shear force at the base of the mixed structure is greater than a value of 1900 kN contrary to the freestanding structure equal to 200 kN.

4 Evaluation of the Response Structures Considered by the Nonlinear Dynamic Analysis
Under this method the results will be more accurate, because it sets the actual behavior of a structure facing an earthquake in presenting the response directly as displacement, velocity and acceleration versus time. However, in this type of method, the difficulty is in the choice of the earthquake and in particular its accelerogram. Indeed, the study should be based on either a measured natural earthquake or an artificial accelerogram. The characteristics of two accelerograms considered in this research, in this case El Centro (USA) and Kobe (Japan), are shown in Table 1 given below, and graphs in Fig. 7.

Structures analyzed responses comparison obtained under the accelerograms of El Centro and Kobe a relative displacements, b lateral displacements and c shearing forces
Analyzes are performed on the two structures considered previously (mixed and freestanding) to evaluate their dynamic response in terms of lateral displacement, relative movements and shear forces of floors under the effect of the selected acceleration time. This evaluation aims to situate the previous results obtained by nonlinear static method with those obtained by nonlinear dynamic method.
From this figure we see that:
-
The maximum relative displacement of the free-standing structure is always greater than that of the mixed structure but we note that there is a large gap displacement between floors as opposed to the mixed structure; this is due to the difference in rigidity between levels.
-
The level where the reinforcement and section columns are reduced inter-floor relative displacement also decreases for freestanding structure.
-
The maximum lateral displacement of the freestanding portico floors are larger than those of the portico reinforced concrete walls reinforced especially on the top floors, this is due to the flexibility of the freestanding portico in which the lateral stiffness is lower.
-
The freestanding structure has a larger distance along the structure (0.045, 0.274) in contrast to the composite structure which are respectively (0.00092; 0.0126).
-
The lateral movement of the freestanding structure beyond the elastic limit contrary to the mixed structures is always lower.
-
The mixed structure braced by reinforced concrete sails presents Room shear stresses higher compared to freestanding structure.
-
Little variation between the efforts of the summit and the base of the portico.
-
By against, a large difference is registered between the force of the top and that of the base structure (wall + frame) due to the variation in the rigidity of the structural elements along the structural height.
For a better comparison of the results under the two acceleration time to the maximum lateral displacements, displacement interstage relative ETAGS buildings considered is given in Fig. 7a–c. The figure clearly shows the difference of nonlinear dynamic responses of structures considered under the action of accelerograms used the El Centro and Kobe. On the basis of these comparisons it is found that:
-
Structures subject to accelerogram Kobe have a greater deformation and are superior in terms of maximum lateral displacements, displacement stage relative compared to those obtained under the action of the accelerogram El Centro, except in the case of lateral movement of the free-standing structure. This difference is of normal character because of the type of accelerograms Played. Particularly as regards the duration and magnitude.
-
The movements of joint structures in accordance with the movement calculated by the code RPA99 (1 % he = 0.0306 m) by two accelerograms contrary to the freestanding structure where the displacement exceeds the limit required by the code RPA99.
-
Compared to shear forces at the base is observed that the mixed structure (wall + frame) has a gap of 39 % under the Kobe earthquake compared to the earthquake in El Centro and a gap of 25 % for freestanding structure.
5 Conclusion
According to the study the most important results are summarized as follows: structure braced by webs has a greater elastic range that the plastic phase because of the distribution of the webs in the two directions which increases the rigidity of the structure where the damage is probably acceptable with respect to the freestanding structure having a greater elastic phase to the total collapse of the structure and the addition sails walls increases the resistance of the structure.
The non-linear static calculation is able to assess the seismic vulnerability of existing structures and study the condition of the structure under the effect of an earthquake. The Pushover analysis is a powerful and very useful method that can allow studying several reinforcement schemes of existing buildings and propose new structures that will perform adequately during future earthquakes. Moreover, despite nonlinear dynamics produced all the desired results (effort and moving every moment of the earthquake), but it is very costly in time compared to the nonlinear static method is therefore proof of promoting static method nonlinear its speed diagnose structures.
Reference
RPA: Règles Parasismiques Algériennes RPA99/Version 2003. Centre de Rechreche Appliquée en Génie Parasismique, Alger (2003)
Author information
Authors and Affiliations
Corresponding authors
Editor information
Editors and Affiliations
Rights and permissions
Copyright information
© 2017 Springer International Publishing Switzerland
About this paper
Cite this paper
Bouyakoub, S., Branci, T. (2017). Evaluation of Nonlinear Seismic Response of Reinforced Concrete Structures. In: Boukharouba, T., Pluvinage, G., Azouaoui, K. (eds) Applied Mechanics, Behavior of Materials, and Engineering Systems. Lecture Notes in Mechanical Engineering. Springer, Cham. https://doi.org/10.1007/978-3-319-41468-3_28
Download citation
DOI: https://doi.org/10.1007/978-3-319-41468-3_28
Published:
Publisher Name: Springer, Cham
Print ISBN: 978-3-319-41467-6
Online ISBN: 978-3-319-41468-3
eBook Packages: EngineeringEngineering (R0)