
Abstract
This section is dedicated to the contribution of geomorphic processes in dislocation, setting in motion and removal of rock particles from the drainage system in Romania. The total volume of eroded material amounts to ca. 126 Mt/year for the entire territory of Romania. Sediments are dislodged by means of various processes including sheet erosion or rill and gully erosion, as well as mass movements (landslides, collapse, mudflows, creep, etc.). The arable lands yield approximately 80 % of the total soil loss in Romania, slightly above the European mean value of 70 %. The contribution of slope processes (sheet and rill erosion, gully erosion, landslides) was estimated at about 67 % and of fluvial processes at about 33 %. The ratio of the two major domains (slopes and river beds) in terms of sediment source contribution was 90:10 according to estimates from the 1980s. In our days, our own evaluations indicate a more balanced ratio, i.e., 67:33. We believe the tendency of adjustment of the relationship between the two sediment source domains is factual and strongly dependent on the changes of controls during the past three decades. The VII and VIII order drainage network (Strahler’s system) from Romania discharges into the Danube sediments which may account for less than 1 % of the amount of sediment yielded by the hillslopes and river beds from the investigated area. At Ceatal (before the Danube enters the deltaic sector), the river transfers on average an annual volume of 20.5 Mt of sediments (from 1985 to 2006). Between 1840 and 1970 the mean amount of alluvium carried by the Danube was 57.3 Mt/year. The difference is accounted for by the sediment storage in the river basin which represents over 37.5 %. The largest sediment storage occurs in reservoirs, and the value determined by us is very similar to the global value (36.6 %).
Access provided by CONRICYT-eBooks. Download chapter PDF
Keywords
Introduction
Sediment transfer from sources to delivery is a key topic of dynamic geomorphology. The rate at which this process occurs can change dramatically, which is commonly a signal of major landform adjustments. In this section dedicated to sediment sources and delivery we aim to document the contribution of geomorphic processes in dislocation, setting in motion and removal of rock particles from the drainage system in Romania. This sample objective was addressed through case studies from various Romanian regions whereby individual investigations were conducted during the past decades.
Deciphering sediment dynamics was a necessity in the early 1980s when hundreds of dams became operational and their reservoirs turned into retainers of upstream landform erosion products. The need to find answers as to where these sediments originate and whether it is possible to control sediment transfer rates has brought forward new approaches in Romanian geomorphology. Thus, the newly created concept of sediment system was introduced in Romania by Ichim (1986, 1988, 1992), Ichim and Rădoane (1987). The sediment system approach was interdisciplinary and major results yielded by these investigations were showcased in the national symposia on “Sediment sources and delivery” (1986, 1988, 1990, 1992). Hence, the results presented in this section are the product of this concept applied to various drainage basins across the Romanian territory, and particularly to basins with relevant hydropower production potential.
The sediment system concept was defined as part of a fluvial geomorphic system and is structured on four levels: (i) controls; (ii) geomorphic processes; (iii) sediment sources (in terms of processes and areas of origin) and sinks (natural and anthropogenic); (iv) sediment delivery (Fig. 27.1).

Levels of organization of the sediment system (redesigned after Ichim 1986)
The sediment system pertaining to the Romanian territory, of which the autochthonous drainage network tributary to the Danube accounts for over 97.8 %, was approached based on this concept. Neither the space nor the available data are sufficient to tackle all four levels of the sediment system structure; however, in this chapter we will focus on at least two levels, i.e., sediment sources and sediment delivery ratio. As regards the sediment sinks, in the absence of factual data, these can be estimated based on the difference of the two levels mentioned above.
Studies on the sediment system or targeted only at certain levels of the system have been carried out in a large variety of drainage basins differing in terms of size, geological substrate, main landforms, land use, etc., which are illustrated in Fig. 27.2, with the synthetic data on the results of research summarized in Table 27.1. The total area of investigated drainage basins amounts to ca. 40,000 km2.

Location of study areas investigated by the authors of this section on the topic of sediment systems in Romania
The research methods employed in these studies consisted primarily of field geomorphological mapping, inventorizing sediment-generating geomorphic processes, estimating the amounts of displaced rock, and assessing the sediment delivery ratio according to the order of the drainage basins and the sum of controls responsible for sediment transfer. In the early stage of research (1980), many of the large Romanian reservoirs were already functional or were being designed or built in these drainage basins, such that studies were focused mainly on producing forecasts on the evolution of reservoir silting in the respective basins.
The following sections of this chapter address a brief analysis of the types of sediment-yielding processes which can provide a clearer perspective on transformations occurring in this field.
Sediment Sources in Relation with Sediment–Yielding Processes
The analysis of sediment sources requires the identification of the entire range of processes transferring alluvium from the slopes to the stream channels. Sediments are dislodged by means of various processes including sheet erosion or rill and gully erosion, as well as mass movements (landslides, collapse, mudflows, creep, etc.). The entire amount of sediments displaced from the hillslopes is not transferred to the river channels, as a large share is stored for certain duration at different levels of the slope or at the contact with the channel.
For the Romanian territory Moţoc (1984) determined that the total volume of eroded material yielded by all the aforementioned processes amounts to ca. 126 Mt/year (Table 27.2). During the three decades that passed since this evaluation the factors controlling sediment-producing processes have altered their action due to both climatic variability and multiple human interventions in the sediment system.
By comparing our results shown in Table 27.1 with the estimates listed in Table 27.2 we determined that some sediment-yielding processes (i.e., gully erosion and mass movements) have similar contributions, with few differences between the two sets of data. However, the contribution of riverbank and in-channel erosion to the sediment supply is as high as 33 % compared to 10 % as estimated by Moțoc (1984). The contribution of bedload as a sediment source has increased steadily during the last 20 years due to the general trend of channel incision throughout most of the Romanian drainage network (Rădoane et al. 2013), whereas the share of sheet erosion is at least 10 % lower according to our assessment compared to the data in Table 27.1; the latter is, to a large extent, an effect of land restitution after 1991 which resulted in a large share of agricultural land turning fallow (cf. Popa, Chap. 15, this volume).
Sheet Erosion as Sediment Sources
The assessment of sheet erosion rates for various land use classes was introduced in Romania in the 1950s and employed experimental plots for determinations (Arghiriade 1977; Gaşpar et al. 1982; Rădoane 2002; Ailincăi et al. 2012; Popa et al. 2013). The data provided by these studies were used to generate Fig. 27.3 based on which the following general conclusions were inferred:

Centralized data on erosion rates by measuring plots in Romania (summarized from data provided by Arghiriade 1977; Gaşpar et al. 1982; Rădoane 2002; Ioniţă et al. 2006; Ailincăi et al. 2012; Popa et al. 2013). 1 Spruce forest; 2 Spruce forest without litter; 3 Beech forest; 4 Meadow–land; 5 Pastureland; 6 Non-vegetated land; 7 Orchard; 8 Dead-fallow land; 9 Corn; 10 Wheat; 11 Sunflower
-
(i)
both the layer of runoff water and the specific erosion rates depend to a significant degree on the land use/land cover (LULC) (Vanacker et al. 2007);
-
(ii)
on lands protected by vegetation (i.e., pastureland, meadows), sheet erosion rates are very low, ranging from 0.003 to 1.4 t/ha/year. On degraded grasslands, the sheet erosion rates increase with the degree of usage;
-
(iii)
in deciduous forests with good consistency (0.8–1) and thick layers of litter, both the runoff and sheet erosion are very low, under 0.2 t/ha/year. Higher values are typical for spruce forests where litter is largely missing, in which case sheet erosion rates can be as high as 7 t/ha/year;
-
(iv)
the highest sheet erosion rates were documented in non-vegetated plots (25.6–68.6 t/ha/year). Such lands are infrequent in mountain areas, and therefore sheet erosion is generally rather low compared to hills and plateaus;
-
(v)
on arable land used for various crops sheet erosion ranged between 0.12 t/ha/year in the case of plots with perennial grasses and 20.8 t/ha/year in plots cultivated with sunflower. The obtained results on the potential erosion (conditioned by geomorphological, soil and climate factors) have shown that on the fields uncovered by vegetation from the Moldavian Plateau, the mean soil losses due to erosion were 18.17 t/ha/year (Bucur et al. 2011), whereas the maximum value is as high as 42.37 t/ha/year (Popa et al. 2013).
Like any other geomorphic process, sheet erosion is highly variable in time and across space. Within the Romanian territory, Ioniţă (2011) distinguished five stages of amplification or reduction in sheet erosion as a result of human intervention: (1) a preparing stage for future land degradation (1829–1899) when the most dynamic change of the native landscape was recorded. Following the Treaty of Adrianople (1829) the Romanian Principalities liberalized the timber and grain trade which resulted in large scale forest clearing for agricultural purposes; (2) a transitory stage (1900–1920) associated with the extension of the cultivated land up to 48 % of the total area; (3) the climax stage (1921–1970) defined by both the traditional up and down hill farming and the peak rate of land degradation during the 1960s; (4) a decreasing tendency of land degradation (1971–1990) as a result of the extension of conservation practices and of the rainfall pattern; (5) the present-day revival of land degradation associated to the Act no. 18/1991 when up and down hill farming under small plots is on the screen again. Under these circumstances, the rate of land division increased and it is higher than before World War II (Ioniţă et al. 2006). While in 1940 the number of plots amounted to 22 million, in 2004 there were no less than 48 million small plots in Romania (Ambăruş 2007). On the other hand, large and very large farms (50–100 ha and over 100 ha) with a trading profile represent only 0.3 % (Bălteanu and Popovici 2010). Another law, no. 1/2000, was promulgated and is focusing on the forestland division for private ownership.
By comparing the values listed in Table 27.2 with the tolerable value of soil erosion in Europe, i.e., of 1.4 t/ha/year (Verheijen et al. 2009) (whereas according to Bucur et al. 2011; Sevastel 2012; Popa et al. 2013, the value for Romania is 4–6 t/ha/year) it appears that large areas of the investigated basins (with the exception of those located in the plateaus) fall within normal limits in terms of sheet erosion. However, to date the effects generated by changes in the land use/land cover (i.e., the excessive division of property, down hill farming, the destruction of erosion control works, forest clearing) or by climate changes (mainly the increasing rainfall intensity) on soil erosion in Romania were not quantized.
The amount of material supplied to the river channels through sheet erosion ranges from 5 to 20 % (Lu et al. 2003; Belyaev et al. 2005; Wilkinson and McElroy 2007). Dumitriu (2007) calculated the sheet erosion rate in Trotuş drainage basin based on the correlation between the measurements on sheet erosion on plots located under similar conditions (in terms of climate, runoff, soil, etc.) to those from the basin and the detailed geomorphological mapping of sheet erosion in relation to the slope classes, land use classes and the types of hillslope surface. Thus, it was estimated that sheet erosion provides 136 t/km2/year (or ca. 1.4 t/ha/year) of the total annual sediment yield in Trotuş drainage basin, which accounts for approximately 20 %. The sediment delivery ratio through this type of process was estimated at ca. 10.2 %. The same algorithm was employed by Rădoane et al. (2014) to assess the sheet erosion in Bonţu drainage basin (upstream of Ştiucii Lake), which accounts for 16.5 % of the gross erosion (568 t/km2/year).
Furthermore, the assessment of sheet erosion in Trotuş basin using the SedNet (Sediment River Network) model was attempted (Prosser et al. 2001; Wilkinson et al. 2004). The model is based on physical processes estimating the annual sediment yield and its components (mean annual stream flow discharge and sediment load; sheet erosion; gully erosion; river bank erosion; hillslope delivery ratio–HSDR) and provides good results for basins larger than 3000 km2.
Using the SedNet model it was determined that sheet erosion in Trotuș basin accounts for ca. 15 % of the total effective hillslope erosion, with a mean value of approximately 1.75 t/ha/year. The sheet erosion in the entire Trotuș basin was estimated at 77,925 t/year. In the majority of the 146 catchments generated by the SedNet model (38.89 %) the rate of sheet erosion ranges between 100 and 500 t/year, whereas the percentage of catchments with rates between 500 and 1000 t/year is ca. 25.4 %. In 21.43 % cases the annual sheet erosion rate exceeds 1000 t/year. Only in 14.29 % instances the estimated rates are below 100 t/year (Fig. 27.4).

Sheet erosion in catchments from Trotuș drainage basin calculated using the SedNet model
To conclude, arable lands yield approximately 80 % of the total soil loss in Romania, slightly above the European mean value of 70 %. The mean calculated value of sheet and rill erosion in Europe is around 1.2 t/ha/year for the entire area and ~3.6 t/ha/year for arable land (Cerdan et al. 2010). In Romania, the mean estimated value of sheet and rill erosion is ca. 4.2 t/ha/year (Ioniță et al. 2006).
Gully Erosion Processes as Sediment Sources
Regarded as sources of alluvium, gully erosion processes can account for 10 % up to as high as 95 % of the total sediment yield in a drainage basin (Poesen et al. 2003). The effectiveness of these processes in terms of land degradation and evacuation over short periods of time of large amounts of material originating in the fertile layer of soil has caught the attention of Romanian researchers: Moţoc et al. (1979), Mihai et al. (1979), Moţoc (1982, 1984), Gaşpar and Cristescu (1987); Rădoane (1980, 2002); Radoane et al. (1995a, 1999); Ioniţă (1999); (see also Chap. 16, this volume).
Based on the data on sediment sources provided by these studies we were able to draw some general conclusions regarding a large portion of the Romanian territory, as follows:
-
(i)
The greatest density of gullies occurs in the plateaus on lands with gradients between 10 and 15 degrees, used mainly as pasturelands. However, gullies are present on all lands which are subjected to inappropriate exploitation, regardless of the landform where they occur (Rădoane et al. 1999);
-
(ii)
The volume of soil and rock dislodged by gullying processes in the area located between Siret and Prut Rivers was estimated at 274 million m3 or 411 Mt. The most active period of gullying from the Moldavian Plateau varies between 25 and 50 years. Hence, in this region of Romania the contribution of gully erosion to the sediment budget ranges from 3.3 to 6.5 t/ha/year;
-
(iii)
In the mountain areas gully erosion can be significant if the anthropogenic impact is exacerbated (by overgrazing, down hill roads, logging transport tracks, etc.). In Pângărați and Oanțu catchments, whereby the road density is 2 km/km2, of which 80 % are forest roads, 20–30 % of the total evacuated sediments are produced solely by road degradation (Rădoane 2002). In some oil extraction areas from Trotuș basin, the density of the downslope road network is as high as 2.5–6.5 km/km2 (Surdeanu et al. 1988; Dumitriu 2007), whereas the drainage network density is just 1082 km/km2.
The aggregate length of gullies from Trotuș drainage basin in 2006 was ca. 622 km, while the mean density of gullies was 0.14 km/km2. Approx. 95.7 % of the drainage basin area falls into the lowest density class, below 1 km/km2; 2.6 % of the basin area ranges between 1 and 2 km/km2; the areas with gully densities above 2 km/km2 account for 1.7 % of the basin area (Dumitriu et al. 2010).
The gully erosion assessed using the SedNet model in the same basin has a share of 40 % of the sediment yield, i.e. ca. 47.5 t/km2/year. In nearly 50 % of the catchments generated by the SedNet model the gully erosion rates range between 100 and 1000 t/year (Fig. 27.5). Exceptional values, above 10,000 t/year, occur in Comăneşti Depression and on the left hillside of Trotuș valley downstream of Căiuţi (where gully erosion accounts for over 90 % of the effective erosion of hillslopes).

Gully erosion as a sediment source in Trotuș drainage basin calculated using the SedNet model
To conclude, gully erosion processes can provide on average up to 31 % of the alluvia reaching the drainage network. The contribution of these processes as sediment sources is roughly 0.7 t/ha/year, or, in absolute values, 13.8 Mt of the total amount of 44.6 Mt of sediments carried annually by rivers (Moţoc et al. 1992).
Mass Movement Processes as Sediment Sources
Landslides mobilize considerable amounts of slope deposits, thus ranking among the major sediment-supplying processes, particularly in the Subcarpathian and plateau regions, as well as in the flysch highland area (Surdeanu 1986; Bălteanu et al. 2010). When regarded as sediment sources, one of the most significant elements of a landslide resides in the coupling or the connectivity between the slope and the fluvial system (Harvey 2001; Peart et al. 2005; McCabe et al. 2013; Jurchescu 2014). This aspect was observed in the inventory of the landslides from the study areas illustrated in Fig. 27.1. The conclusions concerning the contribution of mass movements in providing sediments are summarized as follows:
-
(i)
The percentage of the material supplied to river beds by landsliding varies depending on the characteristics of reaches whereby the transfer occurs (confined, partly confined or laterally unconfined sensu Brierley and Fryirs (2005); the nature of sectioned deposits; the land use/land cover). Thus, on Bâsca Mare River, (Varlaam–Bâsca Rozilei reach) landslides contribute ca. 78 % to the sediment yield. On the middle sector of Buzău River (Cislău–Cândeşti reach) whereby the valley widens considerably and the contact with the hillslopes is reduced to a few sectors, the mean sediment input of mass movement processes was estimated at ca. 4.2 %. However, if we accept the idea that at recurrence intervals of 10–12 years these can be reactivated at average velocities of at least 1 m/month, the volume transferred to the river bed can increase up to 30 % of the total amount of sediment carried by Buzău River (Ichim et al. 1990);
-
(ii)
According to estimates, at present, mass movement processes play a decisive role in providing alluvium to the Subcarpathian river reaches, such that in the years with peaking relapse of the process the amount of material evacuated by mass movement accounts for 30 % up to 65 % of the total material supplied to river beds. For instance, in the Subcarpathian sector of Putna River, landslides with average velocities of 1 m/month and recurrence intervals of 10–12 years have a transfer potential of ca. 65 % of the mean total sediment yield, which was estimated at ca. 3,567,000 t/year (Ichim et al. 1998).
-
(iii)
In the case of rivers from the central and northern sectors of the Eastern Carpathians located north of Putna basin, mass movements have a lower contribution compared to the other categories of processes by which sediments are transferred to river beds, both due to the reduction of the Subcarpathian area northward, and the increase in the percentage of forested land. Against this background, it was determined that mass movement processes only account approx. 10 % of the total sediment yield in Trotuş drainage basin (Dumitriu 2007).
-
(iv)
In the plateaus, the contribution of mass movement processes to the sediment yield is considerably lower due to low connectivity with the river channels. According to the survey carried out during a 21 years period in the Moldavian Plateau by Pujină (1998), it appears that only 2 % of the amount of material mobilized by landslides is eventually evacuated into the 2nd to 4th order drainage network (Strahler’s system). In Bonţu basin located in the Transylvanian Plateau Rădoane et al. (2014) found that whereas landslides dislocate approx. 2745 t/km2/year (which accounts for 80 % of the gross erosion), they only contribute to the sediment yield with less than 2 % due to the phenomenon known as drainage network sedimentation.
To conclude, forwarding a realistic mean value regarding the input of landslides to the total sediment yield at the scale of a broad territory is not a facile task. The variation margin in the basins comprised in our study was large, ranging between 2 % (in basins located in the plateaus) and 60 % (for catchments from the Subcarpathians and the flysch mountains). Albeit, Moțoc (1984) suggested a mean percentage of 12 %, which is likely a realistic figure.
Fluvial Processes as Sediment Sources
River bed sediments are provided by two major types of processes, i.e., riverbank erosion and bed erosion. We will not focus on bed processes in this section, as they are discussed in two separate chapters in this volume (e.g., see Chap. 21 for the dynamics of river bed and bank processes or Chap. 28 for bed deposits and the role of rivers in processing the sediment influx); however, we retain some conclusions regarding the assessments on the contribution of river beds as sediment sources
-
(i)
The contribution of fluvial processes to the sediment budget in a drainage basin becomes relevant from the third order drainage network onwards. Starting from this level of the river network, the valleys acquire the typical elements of fluvial relief under the temperate climate whereby Romanian rivers evolve (Ichim and Rădoane 1984);
-
(ii)
Lateral erosion varied within a broad margin, from several cm/year (in the case of small stream channels deepened in cohesive rocks) up to 27–35 m/year (in alluvial beds of large wandering or braided rivers). Investigations on lateral erosion on Trotuș River determined that the lateral erosion rate differs depending on the landform traversed by the river (or, moreover, indicates the increase of the drainage basin size), as well as on the period of occurrence of major floods (1960–1980 and 2005–2010) (Fig. 27.6).
-
(iii)
Bed erosion has a significant contribution as sediment source, as the dominant bed process documented in the majority of rivers (ca. 60 % in Eastern Romania, cf. Rădoane et al. 2010) is channel deepening. Along most river beds lies a mobile layer of sediments under 50 cm thick; however, in some instances this layer can exceed 100–150 cm in thickness along river reaches undergoing massive human intervention such as gravel mining.
Fig. 27.6 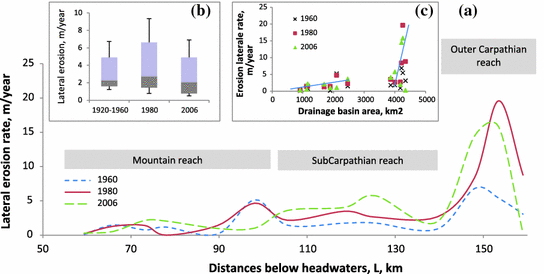
Lateral erosion as sediment source along the Trotuș River. a Lateral erosion rate on Trotuș River along 100 km of the river length from 1920 to 2006; Variation of lateral erosion rates depending on the main relief units traversed by the river valley; b Temporal variation of lateral erosion rates represented as boxplots; c Variation of lateral erosion rates depending on the size of the drainage basin

Finally, we can conclude that the average ratio of 33 % pertaining to river beds as sediment sources determined by our investigations (Table 27.1) is supported by the reality of Romanian rivers.
Sediment Sources According to Area of Origin
The significant amount of suspended sediment evacuated from a drainage system, particularly during large flood events, has prompted us to find an answer to the question whether the domains from the upstream drainage basin which have the greatest contributions in providing these sediments are the hillslopes or the river beds? The more accurate the answer, the higher will be the effectiveness of sediment transfer control measures. Our interest targeted mainly the evacuated suspended sediment originating particularly in the erosion of the topsoil horizon. Our analysis of case studies presented in Table 27.1 resulted in some concrete data; we hereby illustrate the situation of two drainage basins (Olteț and Topolog) originating in the Southern Carpathians, with elongated shapes overlying diverse landforms and geological units.
By applying the method introduced by Grimshaw and Lewin (1980) the area of suspended sediment origin was deduced based on the eq. Qs = f(Q). This relation acquires different forms depending on the season and the size of transported material, resulting in high dispersion which can suggest the following aspects:
-
(i)
the top of the plot indicates the summer discharge when the stream flow discharge and solid load are high and alluvium originates mainly in the catchment;
-
(ii)
the bottom of the plot commonly indicates the autumn–winter discharge, when alluvium derives mostly from the river bed.
In the case of Olteț River, the Qs–Q correlation plot between 1990 and 1991 (Fig. 27.7a) indicates the occurrence of a threshold at Q = 4–10 m3/s, depending on which the two types of sources according to the dominant areas of origin were distinguished, i.e., the catchment domain or the river bed domain. As regards Topolog River (Fig. 27.7b), at stream flow discharge values above 1–3 m3/s the catchment may contribute to the total volume of sediments evacuated from the basin with fine alluvium. Below this threshold value, the fine sediments discharged by the river originate mainly in the channel banks.

Identifying suspended sediment sources using the hydrograph method in two drainage basins. a Olteț, tributary of Drăgașani reservoir (on Olt River). b Topolog, tributary of Băbeni reservoir (on Argeș River). Basin location is indicated in Fig. 27.2
On an average, over the duration of a year, the bed of Olteț River supplies ca. 40 % of the suspended sediment, whereas the catchment provides the remaining 60 %. The seasonal variation is significant, as during the summer the input of the catchment may be as high as 80–90 % of the amount of alluvium, while the contribution of the river bed (although quantitatively relevant) is much lower; in the autumn and winter the input of the catchment slopes decreases such that the bed supplies 70–80 % of the alluvium, particularly the banks. Extreme events, and floods, in particular, leave a strong mark on the scale of the slope/bed ratio: for example, in 1990, when precipitation and consequently the stream flow discharge were low, 72.3 % of the total volume of measured suspended sediments of 75,402 t came from the river bed; in 1991, when precipitation were abundant and the maximum discharge amounted to 1190 m3/s, only 9.7 % of the total volume of suspended alluvium originated in the bed; in 1992 precipitation were diminished and the peak discharge was as low as 29 m3/s, 37.9 % of the total 18,309 t of suspended sediment, coming from the bed.
In Topolog River, the variability of correlations is higher due to the numerous human interventions altering the discharge. However, results indicate percentages similar to Olteț River as follows: on Milcoiu reach, the slopes provide 58 % of the suspended sediment, and the remaining 42 % are delivered by the channel bed. During the years when precipitation and streamflow discharge are high, the contribution of slopes is considerably higher (e.g., in 1991 the catchment provided 79 % of the suspended alluvium), whereas in drier years the bed becomes the main source of sediments (for example, in 1990 the bed yielded 51 % of the total suspended alluvium).
On Trotuș River, Dumitriu (2007) employed a research methodology combining direct field measurements and the SedNet model. Thus, within the drainage basin the input of the slopes amounts to ca. 65 % while the river beds supply 35 % to the sediment yield.
The data cited in the Romanian literature regarding the ratio of contribution of the two domains (river beds versus hillslopes) to the sediment yield refer particularly to small basins/catchments (under 50 km2) derived from field experimental research. Thus, in Colinele Tutovei, river beds account for 26–75 % of the sediment sources (Moţoc et al. 1979); in the Subcarpathians the share of river bed domain increases from 55 up to 85 % (Gaşpar and Untaru 1979). In small catchments from the flysch mountains the river beds contribute ca. 32 % (Rădoane 1986); in Nandra basin (Getic Piedmont) the input of the beds is approx. 65 % of the total amount of sediment evacuated from the basin (Bălteanu and Teodorescu 1985). Overall, it was observed that as the basin size increases, the contribution of river bed domain as a sediment source augments as well.
At the conclusion of this review, we return once more to the results presented in Tables 27.1 and 27.2 in order to infer a comparative average state of global estimates for the Romanian territory. Based on the assessment made by Moțoc (1984) the ratio of the two major domains (hillslopes and river beds) in terms of sediment source contribution is 90:10. Instead, our evaluations indicate a more balanced ratio, i.e., 67:33. We believe that the tendency of adjustment of the relationship between the two sediment source domains is factual and strongly dependent on the changes of controls during the past three decades.
Sediment Yield
The earliest investigations focusing on the sediment yield of Romanian rivers (i.e., the sediments evacuated through the drainage network) were carried out by Diaconu (1964, 1971). His study from 1971 provides the first overview of the sediment yield and transport throughout the Romanian territory; within this analysis a large volume of data on the suspended solid load measured in 202 drainage basins from 1952 to 1967 was processed, based on which the earliest maps depicting the nationwide spatial distribution of the sediment yield in t/ha/year were produced. For the Romanian territory, the calculated mean specific suspended sediment load was 1.88 t/ha/year, which corresponds to a volume of 44.5 Mt of solid materials discharged by rivers (Fig. 27.8).

Mociorniță and Birtu (1987) updated the map of specific sediment yield with data from 1950 to 1984; furthermore, additional data was provided on the influence of major flood events from 1970, 1972, 1975, and 1979, on the sediment yield, as well as on the role of reservoirs in the sediment system. The authors established that with the exception of the Danube, Romanian rivers transfer on average ca. 1550 kg/s/year of suspended alluvium, which translates to an annual sediment yield of 48.9 Mt. The specific sediment yield amounted to 2.06 t/ha/year. The largest amount of suspended sediment was transported by rivers crossing the Subcarpathian region, whereby the mean values of the specific sediment yield are above 10 t/ha/year, up to a maximum value exceeding 20–25 t/ha/year in the Curvature Subcarpathians.
We attempted to update the map of sediment yield in Siret drainage basin with data regarding the suspended solid load until as recently as 2010 (Obreja 2013) and other data resulting from our own investigations on the drainage basins from this region. Based on the series of maps illustrating this process between 1971 and 2010 (Fig. 27.9), we were able to outline several observations.

Evolution of knowledge on the specific suspended sediment yield in Siret drainage basin
The area where the highest rates of sediment yield were constantly documented is the Curvature piedmont; the Mociorniță and Birtu (1987) edition of the map can be disregarded due to the erroneous depiction of sediment yield isopleths. A second area with increasing sediment yield is located in the middle sector of Bârlad basin whereby the rate has increased from 5–10 to 10–15 t/ha/year, ranking into the upper class. The last edition of the map (2010) was based on a dense network of measurement points (shown on the map) and an advanced interpolation technique (which took into account land erodability). We regard this exercise as suggestive for the evolution of sediment yield values and aerials throughout the Romanian territory in relation to the mutations in land use/land cover and climate changes during the last 50 years (Rădoane et al. 2013).
By processing a complex database acquired from various sources (measurements in hydrometric cross-section from the national network ensured by the Romanian Waters Administration, indirect estimations on the account of sediment stock from some reservoirs, personal measurements on small basins) two controls were selected as criteria for the analysis of the sediment yield across a broad territory such as Romania. The two criteria are the lithological composition of the substrate generating alluvium and the size of drainage basins which provide a selection of the volume of sediments transferred from the source area to the delivery area. This control is well shaped in the relations presented in Fig. 27.10 and which were determined based on measurements performed in 336 drainage basins from Romania.

Regional distribution of the specific sediment yield (estimated based on the transfer of suspended sediment by rivers by Rădoane and Rădoane 2005, updated)
Results confirm that, overall, the sediment yield is inversely proportional to the drainage basin area according to a general regression slope b = −0.239. However, against the background of this negative trend a multitude of particular situations arise whereby the lithological substrate exerts significant control. The variation slope of the sediment yield with the lowest decline (regression slope = −0.092) was documented in basins overlying crystalline and volcanic rocks where SY was below 100 t/km2/year. Conversely, in the drainage basins overlying friable deposits in the Getic Piedmont where SY varies between 1000 and 10,000 t/km2/year according to a steeper slope (b = −1.102) depending on the basin size. The basins located in the molasse and piedmont area of the Carpathian Curvature falls in the same category (see also Figs. 27.8 and 27.9).
Against the regional context analysed by Vanmaercke et al. (2011), the Romanian territory ranks among the continental and alpine areas with the Carpathian region, and the mediterranean and steppe area with the regions located on friable rocks with energetic potential.
Sediment Delivery Ratio (SDR)
The studies conducted thus far, particularly in eastern Romania (Moldavian Plateau, Moldavian Subcarpathians, and Eastern Carpathians) and the Getic Subcarpathians and Piedmont allow for an assessment of the sediment delivery ratio (i.e., the percentage of the total amount of alluvium from the source area evacuated from the drainage system) throughout the national territory. Several factors influence the sediment delivery ratio, and their interactions are extremely complex (Walling 1983; Richards 2002). Therefore, an empirical method is used for a SDR regionalization.
One of the most well-established relationships is the one between the SDR and the catchment area as a power function (Fig. 27.11). The SDR may range from 0 to 1 or 0 to 100 %, but the correlation slope between the SDR and the catchment area differs according to the location of the catchment on the Globe. Its values may range from −0.01 to −0.7 (according to Walling 1983; Ferro and Minacapilli 1995; Lu et al. 2006).

The sediment delivery ratio curve as a function of the catchment size in the Carpathian and Sucarpathian area (SDR1) compared to the plateau and higher plain areas (SDR2) in Romania
We selected and synthesized a number of results obtained for the Romanian territory (Rădoane and Ichim 1987; Rădoane and Rădoane 2001; Dumitriu 2007) (Fig. 27.11). The diagram indicates that the SDR varies greatly even within areas smaller than the national territory: the variation in the slope (−0.232) is smaller for the Carpathian and Subcarpathian catchments (SDR1) and greater (−0.33) for the plateau and higher plain catchments (SDR2). This phenomenon is linked to the energetic potential and the sediment evacuation capacity. If the area is approximately 10 km2, the correlation curves have very similar slope gradients; for example, as the catchment area increases, the rhythm of the variation changes noticeably. In the catchments in the plateau and higher plain areas, the SDR drops under 5 %. In the Carpathian and Subcarpathian areas, the evacuation of sediment in catchments over 2000 km2 constantly ranges above 20 %.
The evacuation of sediment from a drainage system is dependent on the capacity of the outflow and the organization of the drainage network (Richards 2002). Our empirical approach included exploring the effects of the drainage network order (Strahler’s system) (Rădoane and Ichim 1987). The slope-channel coupling phenomenon for sediment displacement and evacuation played an important role for the drainage network.
By using a vastly enhanced database with new entries (Table 27.3), we re-computed the relationship between the SDR and the drainage network order in the same regional context across Romania. We can better understand the rank of our study area regarding sediment dynamics.
By plotting the data (Fig. 27.12), we were able to find subtle differences in the changes in the SDR throughout a given area. In drainage networks with an order (Strahler’s system) below VII, the variability in the SDR is described by sinusoidal bends, either concave or flared. The shape of the SDR curves is strongly related to the landform hosting the catchment. Moreover, the catchments from the higher plains and plateaus rank among a very sinuous group of curves whose shape is generated by the rapid decline in the sediment load from 2nd to 3rd order elements of the drainage system. Conversely, all other catchments from the Subcarpathian and piedmont areas rank among the flared-type curves because the sediment load remains significant in higher order drainage networks. In the mountain area, the SDR curve is largely concave, with the inflexion point occurring in the lower order drainage network and the curve becoming asymptotic in higher order networks.

Relationship between the sediment delivery ratio and the drainage network order (Strahler’s system) in several Romanian regions: 1 Small catchments from the flysch mountain area; 2 Catchments from the Moldavian and Curvature Subcarpathians; 3 Jijia drainage basin (Moldavian Tableland); 4 Bârlad drainage basin (Moldavian Tableland); 5 Olteț drainage basin (piedmont area); 6 Topolog drainage basin; 7 Jiu drainage basin (mining effect); 8 Small catchments, Olt River left side (piedmont area); 9 Argeș River, upstream of Oiești Reservoir; 10 Bonțu drainage basin (upstream of Știucii Lake, Transylvania Plain)
In the mountain catchments, the SDR curves have higher concavity in 1st, 2nd, 3rd, and 4th order networks, after which the variation slope ranges approximately 20 %. Although the transport capacity of the drainage network is high because of the relatively low amount of sediments, the balance is maintained between the sediment supply and evacuation.
The largest amount of sediment displaced by the drainage network occurs in the Subcarpathian and piedmont catchments (the connectivity to sediment sources is maximal); however, the evacuation of sediments is also high, reaching almost 50 % in the 6th and 7th order networks. The SDR curves are elongated and irregular, with large variations depending on the drainage network order.
The variability of the SDR curves shown in Fig. 27.12 is maximal in the case of the Jiu drainage network. We documented an extremely high sediment load resulting from the coal ore washing (Rădoane et al. 1995a, b), such that the delivery ratio reached 95 % regardless of the river order (Strahler’s system). Under natural conditions, such an SDR curve is not achievable; however, anthropogenic interference (e.g., through mining activities) can also result in this outcome.
To conclude, we estimate that the VII and VIII order drainage network (Strahler’s system) from Romania discharges into the Danube, sediments which may account for less than 1 % of the amount of alluvium yielded by the hillslopes and river beds from the investigated area. At Ceatal (before the Danube enters the deltaic sector), the river transfers on average an annual volume of 20.5 Mt of sediments (from 1985 to 2006). Between 1840 and 1970 the mean amount of alluvium carried by the Danube was 57.3 Mt/year (Bondar 2008). The difference is accounted for by the sediment storage in the river basin which represents over 37.5 %. The largest sediment storage occurs in reservoirs, and the value determined by us is very similar to the global value (36.6 %) estimated by Syvitski et al. (2005). One of the highly effective rivers in terms of sediment transfer is Siret River (see also Fig. 27.1 and Chap. 28, this volume) which evacuates annually ~10 Mt of alluvium into the Danube, despite the fact that several reservoirs are functional in the upper Siret basin.
Conclusions
Sediment transfer from sources to delivery is a key topic of dynamic geomorphology. The rate at which this process occurs can change dramatically which is commonly a signal of major landform adjustments. The arable lands yield approx. 80 % of the total soil loss in Romania, slightly above the European mean value of 70 %. The mean calculated value of sheet and rill erosion in Europe is around 1.2 t/ha/year for the entire area and ~3.6 t/ha/year for arable land. In Romania the mean estimated value of sheet and rill erosion is ca. 4.2 t/ha/year.
Regarding the input of landslides to the total sediment yield at the scale of a broad territory this is not a facile task. The variation margin in the basins comprised in our study was large, ranging between 2 % (in basins located in the plateaus) and 60 % (for catchments from the Subcarpathians and the flysch mountains). Albeit, Moțoc (1984) suggested a mean percentage of 12 %, which is likely a realistic figure.
About the fluvial field, we can conclude that the average ratio of 33 % pertaining to river beds as sediment sources determined by our investigations is supported by the reality of Romanian rivers. Based on the assessment made by Moțoc (1984) the ratio of the two major domains (slopes and river beds) in terms of sediment source contribution was 90:10. Instead, our own evaluations indicate a more balanced ratio, i.e., 67:33. We believe the tendency of adjustment of the relationship between the two sediment source domains is factual and strongly dependent on the changes of controls during the past three decades.
The VII and VIII order drainage network (Strahler’s system) from Romania discharges into the Danube sediments which may account for less than 1 % of the amount of alluvium yielded by the hillslopes and river beds from the investigated area. At Ceatal (before the Danube enters the deltaic sector), the river transfers on average an annual volume of 20.5 Mt of sediments (from 1985 to 2006). Between 1840 and 1970 the mean amount of alluvium carried by the Danube was 57.3 Mt/year. The difference is accounted for by the sediment storage in the river basin which represents over 37.5 %. The largest sediment storage occurs in reservoirs, and the value determined by us is very similar to the global value (36.6 %).
References
Ailincăi C, Jităreanu G, Bucur D, Ailincăi D (2012) Eroziunea solului și măsuri de conservare în Podișul Moldovei. Cercetări Agronomice în Moldova 45(152):29–42 (in Romanian)
Ambăruș D (2007) Cercetări privind evoluția proceselor erozionale și a amenajărilor pentru atenuarea lor, funcție de dinamica categoriilor de folosință de pe terenurile în pantă. Ph. D thesis, University “Gh. Asachi”, Iaşi (in Romanian)
Arghiriade C (1977) Rolul hidrologic al pădurii. Ceres Press, Bucureşti (in Romanian)
Bălteanu D, Popovici EA (2010) Land use changes and land degradation in post-socialist Romania. Rev Roum Géogr 54(2):95–105
Bălteanu D, Teodorescu V (1985) Element for sediment budget of small catchment, the Getic Piedmont, Romania. Rev Roum Géol Géophys Géogr 29:73–78
Bălteanu D, Chendeş V, Sima M, Enciu P (2010) A country–wide spatial assessment of landslide susceptibility in Romania. Geomorphology 124:102–112
Belyaev VR, Wallbrink PJ, Golosov VN, Murray AS, Sidorchuk AY (2005) A comparison of methods for evaluating soil redistribution in the severely eroded Stavropol region, southern European Russia. Geomorphology 65:173–193
Bondar C (2008) Hydro morphological balance of the Danube river channel on the sector between Bazias (km 1072.2) and Danube Delta Inlet (km 80.5). Paper presented at the international expert conference on ‘the safety of navigation and environmental security in a transboundary context in the Black Sea Basin’, Odessa
Brierley GJ, Fryirs KA (2005) Geomorphology and river management: applications of the river style framework. Blackwell Publications, Oxford
Bucur D, Jităreanu G, Ailincăi C (2011) Soil erosion control on arable lands from north–east Romania. In: Godone D, Stanchi S (eds) Soil erosion issues in agriculture, pp 295–314
Cerdan O, Govers G, Le Bissonnais Y, Van Oost K, Poesen J, Saby N, Gobin A, Vacca A, Quinton J, Auerswald K, Klik A, Kwaad F, Raclot D, Ioniță I, Rejman J, Rousseva S, Muxart T, Roxo MJ, Dostal T (2010) Rates and spatial variations of soil erosion in Europe: a study based on erosion plot data. Geomorphology 122:167–177
Diaconu C (1964) Rezultate noi în studiul scurgerii de aluviuni în suspensie a râurilor R.P.R. Studii de Hidrologie 11:81–223 (in Romanian)
Diaconu C (1971) Probleme ale scurgerii de aluviuni pe râurile României. Studii de Hidrologie 31:5–213 (in Romanian)
Dumitriu D (2007) Sistemul aluviunilor din bazinul râului Trotuș. Universității Suceava Press, Suceava (in Romanian)
Dumitriu D, Condorachi D, Miclăuș C, Niculiță M (2010) Modele de evaluare a bugetului de aluviuni în relaţie cu impactul antropic dintr-un bazin hidrografic. Studiu de caz: bazinul râului Trotuş. Technical report PNCD II–Idei, 146/2007 (in Romanian)
Ferro V, Minacapilli M (1995) Sediment delivery processes at basin scale. Hydrol Sci J 40:703–717
Gașpar R, Cristescu C (1987) Cercetări asupra scurgerii și transportului de aluviuni în bazine hidrografice torențiale mici parțial amenajate. ICAS, Bucureşti (in Romanian)
Gașpar R, Untaru E (1979) Contribuții la studiul transportului de aluviuni a bazinelor torențiale parțial împădurite. ASAS Informative Bull 8:22–30 (in Romanian)
Gaşpar R, Untaru R, Roman F, Cristescu C (1982) Cercetări hidrologice în bazine hidrografice torenţiale mici. ICAS, Bucureşti (in Romanian)
Grimshaw DL, Lewin J (1980) Source identification for suspended sediment. J Hydrol 47:151–162
Harvey AM (2001) Coupling between hillslopes and channels in upland fluvial systems: implications for landscape sensitivity, illustrated from the Howgill Fells, northwest England. Catena 42:225–250
Ichim I (1986) Sistemul aluviunilor. In: Ichim I, Rădoane M, Rădoane N (eds) Lucrările Simpozionului “Proveniența și efluența aluviunilor”, Piatra Neamt I, pp 1–31 (in Romanian)
Ichim I (1988) Semnificaţia mărimii suprafeţei bazinului hidrografic în dinamica proceselor fluviale. Hidrotehnica 33:17–28 (in Romanian)
Ichim I (1992) Probleme ale cunoașterii sistemului aluvionar din Romania. Lucrările celui de-al IV lea Simpozion “Proveniența și efluența aluviunilor”, Piatra Neamț, pp 1–7 (in Romanian)
Ichim I, Rădoane M (1984) Cercetări privind sursele de aluviuni şi energia potenţială de eroziune cu exemplificări din regiunea Vrancei. Hidrotehnica 29:183–187 (in Romanian)
Ichim I, Rădoane M (1987) A multivariate statistical analysis sediment yield and prediction in Romania. Catena Suplements 10:137–146
Ichim I, Rădoane M, Rădoane N, Surdeanu V (1990) Provenienţa şi efluenţa aluviunilor râului Buzău. Abordare geomorfologică. In: Ichim I, Rădoane M, Rădoane N (eds) Lucrările Simpozionului “Proveniența și efluența aluviunilor”, Piatra Neamt III, pp 71–93 (in Romanian)
Ichim I, Rădoane M, Rădoane N, Catană C (1994a) Sediment balance in the Argeş drainage basin (Vidraru Dam–Oeşti Reservoir). Rev Roum G.G.G. 38:105–110
Ichim I, Rădoane M, Rădoane N, Grasu C, Cochior C (1994b) Bugetul de aluviuni al bazinului râului Olteț. In: Lucrările Sesiunii Ştiințifice Anuale, Institutul de Geografie, Bucureşti, pp 139–144
Ichim I, Rădoane M, Rădoane N, Grasu C, Miclăuş C (1998) Dinamica sedimentelor. Aplicaţie la râul Putna-Vrancea, Tehnică, Bucureşti (in Romanian)
Ioniţă I (2000) Formarea și evoluția ravenelor din Podișul Bârladului. Carson Press, Iași (in Romanian)
Ioniţă I (2011) The human impact on soil erosion and gulling in the Moldavian Plateau, Romania. Land Anal 7:71–73
Ioniță I (1999) Studiul geomorfologic al degradărilor de teren din bazinul mijlociu al văii Bârladului. Ph.D thesis, University “Al. I. Cuza”, Iaşi (in Romanian)
Ioniţă I, Rădoane M, Mircea S (2006) Soil erosion in Romania. In: Boardman J, Poesen J (eds) Soil erosion in Europe. Willey, England, pp 155–167
Jurchescu M (2014) Analysing connectivity through landslide-channel geomorphic coupling in a large drainage system of Southern Romania. Paper presented at the EGU General Assembly, 27 April–2 May, Vienna
Lu H, Moran CJ, Prosser IP, Raupach MR, Olley J, Petheram C (2003) Hillslope erosion and sediment delivery: a basin wide estimation. Technical report 15/03. CSIRO Land and Water, Canberra
Lu H, Moran CJ, Prosser IP (2006) Modelling sediment delivery ratio over the Murray Darling basin. Environ Model Softw 21:1297–1308
McCabe M, Fuller IC, McColl ST (2013) Shallow landsliding and catchment connectivity within the Houpoto Forest, New Zealand. GeoScience: a working paper series in physical geography. School of People, Environment and Planning. Massey University, Auckland
Mihai Gh, Taloescu I, Neguț N (1979) Influența lucrărilor transversale asupra evoluției ravenelor formate pe alternanțe de orizonturi permeabile și impermeabile. Buletinul ASAS 8:17–28 (in Romanian)
Mociorniță C, Birtu E (1987) Câteva aspecte ale transportului de aluviuni în România. Hidrotehnica 32(7):241–245 (in Romanian)
Moţoc M (1984) Participarea proceselor de eroziune şi a folosinţelor terenului la diferenţierea transportului de aluviuni în suspensie pe râurile din România. Buletinul ASAS 13:25–33 (in Romanian)
Moțoc M (1982) Ritmul mediu de degradare erozionala a solului din Romania. Buletinul ASAS 11:47–65 (in Romanian)
Moţoc M, Ioniţă I, Nistor D, Vătău A (1992) Soil erosion control in Romania. The Bulletin of Regional Environmental Centre, Budapest
Moțoc M, Stănescu P, Taloiescu I (1979) Metode de estimare a eroziunii totale şi a eroziunii efluente pe bazine hidrografice mici. Buletinul ASAS 8:20–30 (in Romanian)
Obreja F (2013) Studiul transportului de aluviuni în bazinul hidrografic Siret. Ph.D. thesis, University of Suceava, Suceava (in Romanian)
Peart MR, Ng KY, Zhang DD (2005) Landslides and sediment delivery to a drainage system: some observations from Hong Kong. J Asian Earth Sci 25:821–836
Poesen J, Nachtergale J, Vertstraeten G, Valentin C (2003) Gully erosion and environmental change. Importance and research needs. Catena 50:91–134
Popa N, Nistor D, Filiche E, Petrovici G (2013). Studies on runoff and erosion rates in Eastern Romania. In: Proceedings of the 1st CIGR inter–regional conference on land and water challenges, Bari
Prosser IP, Rustomji P, Young B, Moran C, Hughes A (2001) Constructing river basin sediment budgets for the national land and water resources audit, 15(01). CSIRO land and water technical report, Canberra, p 34
Pujină L (1998) Cercetări privind efluența aluvionară de pe terenurile agricole afectate de procese complexe de alunecare din podișul Bârladului și valorificarea economică superioară a acestora. Ph.D thesis, University “Gh. Asachi”, Iaşi (in Romanian)
Rădoane N (1980) Contribuţii la cunoaşterea unor procese torenţiale din bazinul râului Pângăraţi în perioada 1976–1979. Stud Cercet G.G.G. 27:53–63 (in Romanian)
Rădoane N (1986) Efectul antropic în provenienţa şi efluenţa aluviunilor din bazine hidrografice mici. In: Ichim I, Rădoane M, Rădoane N (eds) Lucrările Simpozionului “Proveniența și efluența aluviunilor”, Piatra Neamț I, pp 189–205 (in Romanian)
Rădoane N (2002) Geomorfologia bazinelor hidrografice mici. Universităţii Suceava Press, Suceava (in Romanian)
Rădoane M (2004) Dinamica reliefului în zona lacului Izvorul Muntelui. Universității Suceava Press, Suceava (in Romanian)
Rădoane M, Ichim I (1987) Probleme ale scurgerii aluviunilor pe râurile din România. Hidrotehnica 32:44–49 (in Romanian)
Rădoane M, Rădoane N (2001) Eroziunea terenurilor și transportul de aluviuni în sistemele hidrografice Jijia și Bârlad. Revista de Geomorfologie 3:73–86 (in Romanian)
Rădoane N, Rădoane M (2003) Cercetări geomorfologice pentru evaluarea rolului albiei râului Olteţ ca sursă de aluviuni. Anal. Univ. “Ştefan cel Mare” 10:27–35 (in Romanian)
Rădoane M, Rădoane N (2005) Dams, sediment sources and reservoir silting in Romania. Geomorphology 71:112–125
Rădoane M, Rădoane N (2007) Geomorfologie aplicată. Universității Suceava Press, Suceava (in Romanian)
Rădoane M, Ichim I, Rădoane N, Miclăuș C, Grasu C (1992) Bugetul de aluviuni în bazine hidrografice mici din Valea Oltului. In: Ichim I, Rădoane M, Rădoane N (eds) Lucrările Simpozionului “Proveniența și efluența aluviunilor”, Piatra Neamț IV (supl.), pp 189–205 (in Romanian)
Rădoane M, Ichim I, Rădoane N (1995a) Gully distribution and development in Moldavia, Romania. Catena 24:127–146
Rădoane N, Rădoane M, Ichim I, Miclăuş C (1995b) Influenţele mineritului asupra tranzitului de aluviuni pe râul Jiu, amonte de Sadu. Studii și cercetări G.G.G. 42:63–72 (in Romanian)
Rădoane N, Rădoane M, Ichim I, Grasu C, Miclăuş C (1997) Sursele de aluviuni şi transportul aluvionar în Bazinul hidrografic Bâsca Chiojdului. Anal Univ “Ştefan cel Mare” 6:33–44 (in Romanian)
Rădoane M, Rădoane N, Ichim I, Surdeanu V (1999) Ravenele. Forme, procese, evoluţie. Presa Universitară, Cluj–Napoca (in Romanian)
Rădoane M, Pandi G, Rădoane N (2010) Contemporary bed elevation changes from the Eastern Carpathians. Carpathian J Earth Environ Sci 5:49–60
Rădoane M, Obreja F, Cristea I, Mihăilă D (2013) Changes in the channel–bed level of the Eastern Carpathian rivers: climatic vs. human control over the last 50 years. Geomorphology 193:91–111
Rădoane N, Zamoşteanu A, Rădoane M (2014) Sediment budget of the Ştiucii Lake catchment (Transylvania Plain). Carpathian J Earth Environ Sci 9(4):31–46
Richards K (2002) Drainage basin structure, sediment delivery and the response to environmental change. In: Jones SJ, Frostick LE (eds) Sediment flux to basins: causes, controls and consequences. The Geological Society of London, Special Publication 5(191):149–160
Sevastel M (2012) Some aspects concerning evaluation of the alluvia sources from agricultural watersheds. Anal Univ Oradea, Protecţia Mediului 19:878–885
Surdeanu V (1986) Alunecările de teren ca surse de aluviuni. In: Ichim I, Rădoane M, Rădoane N (eds) Lucrările Simpozionului “Proveniența și efluența aluviunilor”, Piatra Neamt I, pp 229–237
Surdeanu V, Rădoane N, Catana C (1988) Alunecarea de teren de la Tașbuga (Carpații Orientali). Lucrările Stațiunii “Stejarul” Piatra Neamț, 9:39–52 (in Romanian)
Syvitski JPM, Vörösmarty CV, Kettner AJ, Green P (2005) Impact of humans on the flux of terrestrial sediment to the global coastal ocean. Science 308:376–380
Vanacker V, Von Blanckenburg F, Govers G, Molina A, Poesen J, Deckers J, Kubik P (2007) Restoring dense vegetation can slow mountain erosion to near natural benchmark levels. Geology 35:303–306
Vanmaercke M, Poesen J, Verstraeten G, de Vente J, Ocakoglu F (2011) Sediment yield in Europe: spatial patterns and scale dependency. Geomorphology 130:142–161
Verheijen FGA, Jones RJA, Rickson RJ, Smith CJ (2009) Tolerable versus actual soil erosion rates in Europe. Earth Sci Rev 94:23–38
Walling DE (1983) The sediment delivery problem. J Hydrol 65:209–237
Wilkinson BH, McElroy BJ (2007) The impact of humans on continental erosion and sedimentation. Geol Soc Am Bull 119:140–156
Wilkinson S, Henderson A, Chen Y (2004) SedNet user guide. Client report for the cooperative research centre for catchment hydrology. CSIRO Land and Water, Canberra
Acknowledgements
This research is part of a project funded by the Fund for Scientific Research, Romania (research project PN-II-ID-PCE-2011-3-0057 and PN-II-RUTE-2017-4-0855).
Author information
Authors and Affiliations
Corresponding author
Editor information
Editors and Affiliations
Rights and permissions
Copyright information
© 2017 Springer International Publishing Switzerland
About this chapter
Cite this chapter
Dumitriu, D., Rădoane, M., Rădoane, N. (2017). Sediment Sources and Delivery. In: Radoane, M., Vespremeanu-Stroe, A. (eds) Landform Dynamics and Evolution in Romania. Springer Geography. Springer, Cham. https://doi.org/10.1007/978-3-319-32589-7_27
Download citation
DOI: https://doi.org/10.1007/978-3-319-32589-7_27
Published:
Publisher Name: Springer, Cham
Print ISBN: 978-3-319-32587-3
Online ISBN: 978-3-319-32589-7
eBook Packages: Earth and Environmental ScienceEarth and Environmental Science (R0)