
Abstract
The normal lumbar spine consists of five vertebral bodies which constitute some kind of lordosis and which are, in normal cases, perfectly aligned by three major ligaments:
-
Anterior longitudinal ligament
-
Posterior longitudinal ligament
-
Ligamenta flava
The lumbar vertebrae enclose the spinal canal, which contains the thecal sac (enclosed by the dura mater) with the spinal cord, conus medullaris, cauda equina and cerebrospinal fluid. The thecal sac is surrounded by epidural fat and a venous plexus. In cross-section, the spinal canal is circular in the upper lumbar spine segments and triangular in the lower part of the lumbar spine.
Access provided by Autonomous University of Puebla. Download chapter PDF
Keywords
These keywords were added by machine and not by the authors. This process is experimental and the keywords may be updated as the learning algorithm improves.
1 Introduction to Normal Imaging Findings
General Features
-
The normal lumbar spine consists of five vertebral bodies which constitute some kind of lordosis [1] and which are, in normal cases, perfectly aligned by three major ligaments:
-
Anterior longitudinal ligament
-
Posterior longitudinal ligament
-
Ligamentum flavum
-
-
The lumbar vertebrae enclose the spinal canal, which contains the thecal sac (enclosed by the dura mater) with the spinal cord, conus medullaris, cauda equina and cerebrospinal fluid. The thecal sac is surrounded by epidural fat and a venous plexus. In cross-section, the spinal canal is circular in the upper lumbar spine segments and triangular in the lower part of the lumbar spine [2].
-
Intervertebral nerve roots leave the spinal canal through the intervertebral foramina, which are lined by the vertebral body and intervertebral disk (anteriorly), the facet joints (posteriorly) and the superior and inferior pedicles (craniocaudally).
-
The intervertebral disk is a very important component of the lumbar spine and will be further discussed below.
Imaging Features
With the exception of plain X-ray films, cross-sectional CT (computed tomography) or MRI (magnetic resonance imaging) examinations of the lumbar spine, as they are showed in this chapter, are performed with the patient supine, i.e. non-weight-bearing position.
There are different imaging modalities which can be used for evaluating the lumbar spine:
-
Conventional X-ray is a readily available technique occasionally used in the initial evaluation of the lumbar spine. However, only skeletal elements such as the vertebral bodies (with the intervertebral space), facet joints and pedicles (with intervertebral foramina) can be appreciated. X-rays may be helpful:
-
In the evaluation of acute low back pain in cancer patients (or highly suspected).
-
In scoliosis evaluation.
-
On dynamic films when evaluating instability.
-
And finally for the evaluation of the spinal contour and measurement of the sagittal balance. When evaluating the full spine, the EOS (EOS Imaging Inc., Cambridge, MA, USA) system offers better image quality, no distortion of the vertebral bodies and significant less radiation exposure to the patient as compared to classical X-rays.
Different X-ray projections can be used while imaging the lumbar spine:
-
AP (anteroposterior) projection: structures that can be seen are the vertebral bodies, transverse processes, spinous processes, pedicles and intervertebral disk spaces (Fig. 21.1). This is a proper projection for the evaluation of certain pathologies such as scoliosis.
Fig. 21.1 
Normal X-ray of the lumbar spine, AP (a) and lateral (b) projection. Structures that can be seen on the AP projection are the spinous processes (a), intervertebral disk space (b), transverse processes (c) and pedicles (d). The lateral projection clearly illustrates the anterior and posterior vertebral line (dotted white lines) representing the normal alignation of the lumbar spine. The intervertebral disk space (e), intervertebral foramina (f), pedicles (g) and spinous processes (h) are also visualized
-
Lateral projection: structures that can be seen are the vertebral bodies, spinous processes, pedicles, intervertebral foramina and intervertebral disk spaces (Fig. 21.1). The alignment of the lateral lumbar spine is given by two imaginary lines, the anterior and posterior vertebral line. As in the cervical spine, disruption of these lines may indicate fracture, dislocation or severe degenerative changes.
-
Oblique projections: the most characteristic feature in these projections is the so-called “scotty dog” appearance (Fig. 21.2). The neck of this dog is the easiest feature to recognize, representing the pars interarticularis. The nose and the eye of this dog represent the transverse process and the pedicle, respectively. The front leg represents the inferior articular process, and the ear represents the superior articular process. The ear and the leg of the dog illustrate the normal facet joints.
Fig. 21.2 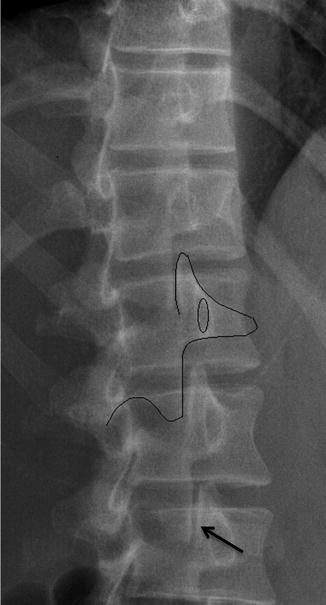
Normal X-ray of the lumbar spine, oblique projection. The so-called scotty dog has been demarcated in black. The neck represents the pars interarticularis. The nose and the eye of the dog represent the transverse process and the pedicle, respectively. The front leg represents the inferior articular process and the ear represents the superior articular process. The advantage of this projection is that the facet joints can be seen more easily (arrow)
-
-
The intervertebral disks, the content of the spinal canal and the exiting nerve roots cannot be visualized on standard radiographs due to the insufficient contrast resolution for these structures. MRI and CT provide a greater soft tissue resolution and allow discrimination of these elements (Figs. 21.3 and 21.4).
Fig. 21.3 
CT scan of the normal lumbar spine. CT scan of a 26-year-old male demonstrating a normal lumbar spine, displayed from L3–S3. Axial images (a–c) display a normal appearance of the spinal canal (circle), facet joints (arrows), intervertebral disks (asterisks) and intervertebral nerve roots (arrowheads). A reformatted sagittal image (d) shows normal alignment of the anterior and the posterior vertebral line
Fig. 21.4 
MRI of the normal lumbar spine. MRI of a young female with sagittal T1 weighted image (a) and T2 weighted image (b). Note the normal alignment of the anterior and posterior vertebral line (white dotted lines in a). Intervertebral disks display a hypo- to isointense signal on T1 weighted image and a more hyperintense signal on T2 weighted image (representing the fluid within the nucleus pulposus)


2 The Intervertebral Disk
2.1 Normal Disk
The intervertebral disk allows and supports complex body movements. These functions require a unique structure:
-
The intervertebral disk consists of an inner nucleus pulposus and an outer annulus fibrosus.
-
The gelatinous nucleus pulposus consists of water, proteoglycans and collagen, whereas the annulus fibrosus is composed of 15–25 concentric, strong collagen layers (see also Chap. 3).
-
Due to the normal ageing process, a part of the matrix of the nucleus pulposus undergoes fibrous transformation forming the so-called intranuclear cleft.
Imaging Features
-
A normal intervertebral disk does not extend beyond the margins of adjacent vertebral plates.
-
The normal intervertebral disk presents a high signal on T2-weighted images (T2-WI) and a low to intermediate signal on T1-weighted images (T1-WI) compared to the adjacent vertebrae.
-
Because of high water content, the nucleus pulposus appears “bright” on T2-WI in contrast to the “dark” outer layers of the annulus fibrosus, which consist of fibrous tissue (Fig. 21.5).
Fig. 21.5 
MRI of a normal lumbar intervertebral disk. On T1 weighted imaging (a) normal disks have a low to intermediate signal intensity compared to the adjacent vertebral bodies. On T2 weighted images in the sagittal (b) and axial (c) plane, the intervertebral disks demonstrate a “bright” nucleus pulposus (arrowheads) surrounded by a “dark” annulus fibrosus (arrows). Note the normal concavity of the disk (curved line) (c). On the sagittal T2 weighted image (b), a hypointense horizontal line is seen in the disk (open arrowheads), representing the so-called intranuclear cleft, a normal imaging finding in the adult spine
-
The intranuclear cleft appears as a “dark” horizontal line on T2-WI, which transverses the bright nucleus pulposus (Fig. 21.5) indicating the normal maturation (and degeneration) of the intervertebral disk.

2.2 Degenerative Disk Disease
As mentioned in the chapter dealing with the imaging of the cervical spine, degenerative disk disease can be subdivided in two different entities:
-
Intervertebral osteochondrosis: involving the nucleus pulposus and the vertebral body end plates
-
Spondylosis deformans: involving the annulus fibrosus and adjacent ring apophysis
Intervertebral osteochondrosis represents a pathologic deterioration of the disk, while spondylosis deformans reflects the normal ageing process of the lumbar spine (Fig. 21.6).

Simplified illustration of the difference between a normal disk (a), spondylosis deformans (b) and intervertebral osteochondrosis (c). Intervertebral osteochondrosis represents a pathologic deterioration of the disk, while spondylosis deformans reflects the normal ageing process of the lumbar spine. ALL and PLL represent the anterior and posterior longitudinal ligament, respectively
2.2.1 Black Disk and Loss of Disk Height
Definition
The term “black disk” is a purely descriptive term and refers to a diminished signal intensity in the nucleus pulposus on T2-weighted images [3].
General Features
-
The loss in T2 signal intensity is believed to be due to a loss of glycosaminoglycans and, in consequence, a loss of water content [4].
-
A “black disk” differs from a normal one not only in morphology but also in biochemistry and biomechanics. That explains why this appearance on MRI (Fig. 21.7) is often interpreted as a sign of “early disk degeneration”.
Fig. 21.7 
Black disk. A 38-year-old woman presenting with low back pain without any functional neurological deficit. An MRI examination of the lumbar spine was performed including sagittal T2 weighted images showing a “black disk” at level of L5–S1 (white arrow). Note normal signal intensity of the other intervertebral disks (arrowheads)
-
Anatomic sections of such disks showed accumulation of fibrous tissue in the nucleus pulposus and loss of border between annulus fibrosus and nucleus pulposus [5].
-
Loss of water content is followed by loss of disk height. A dehydrated nucleus pulposus cannot swell to decreased negative charges, which has an important impact on the biomechanics of the intervertebral “joint”. This eventually leads to further degeneration [6, 7].

2.2.2 High-Intensity Zone
Definition
-
Also known as annular fissure and/or annular defect.
-
It is better to avoid the formerly used term “annular tear”, because this terminology tends to infer a previous trauma.
General Features and Pathophysiology
-
The annular fissure results from a decrease in proteoglycan and water content of the nucleus pulposus which causes the nucleus pulposus to parch. The normal onion-like appearance of the nucleus pulposus starts to unravel which results in clefts and cracks. These clefts extend into the annulus fibrosus.
-
A high-intensity zone, as seen on T2 WI, has been proposed to be a critical factor in disk degeneration [8]. It appears during the early stages of disk degeneration and can often be seen without the presence of other morphologic alterations [9].
-
There are three types of annular fissures (Fig. 21.7):
-
Concentric:
-
Lamellar separation (parallel with lamellar orientation)
-
-
Transverse:
-
Defect in the outer fibres of the annulus (attachment at end plate rim)
-
-
Radial:
-
Total lamellar disruption through outer margin
-
-
Clinical Features
-
Though high-intensity zones in the annulus fibrosus are considered to be associated with disk degeneration, they are more commonly discovered as an incidental finding in asymptomatic patients. However, they are only discovered in a minority of post-mortem studies of patients (over 40 years), and therefore they can be considered as a rather unusual consequence of ageing [10].
Imaging Features
-
MRI is the imaging modality of choice to depict this degenerative process, showing an abnormal signal intensity in the posterior margin of a degenerating disk.
-
T2-WI shows a high-intensity zone at the posterior disk margin, which normally has a low signal (Fig. 21.8).
Fig. 21.8 
High-intensity zone. This 25-year-old man complains of low back pain since at least 2 months. His symptoms worsened with increased mechanical loading. An MRI examination was performed including both sagittal (a) and axial (b) T2 weighted images. The sagittal image (a) shows a degenerative L5–S1 disk, with a linear high-intensity zone (thick arrow). This high-intensity zone can also be seen on the axial image (b) as an area of hyperintense signal (thin arrow) in the posterior annulus fibrous
-
T1-WI with contrast shows a linear contrast enhancing fissure. This enhancement can also be seen on contrast-enhanced CT images reflecting a “healing” process [8].
-

2.2.3 Bulging Disk
Definition
-
Circumferential disk broadening beyond the margins of the adjacent vertebral body end plates
General Features
A bulging disk implies a short radius of expansion (usually less than 3 mm) affecting more than 50 % (180°) of the circumference of the intervertebral disk (Fig. 21.9).

Simplified illustration of a bulging disk. There is a circumferential disk expansion beyond the margins of the end plates, affecting more than 50 % of the circumference of the disk. This bulging can be symmetric (a) or asymmetric (b). Note the difference with a disk herniation (Figs. 21.11, 21.12, and 21.13) where the expansion is localized (i.e. less than 50 % of the diskal circumference)
Clinical Features
-
A bulging disk can be asymptomatic but can also give rise to low back pain, neurogenic claudication and radiculopathy.
Imaging Features
-
Bulging disks can be visualized by cross-sectional imaging techniques, CT and MRI (Fig. 21.10), as a broad-based bulge of the disk with loss of disk height. In some cases, they are accompanied by the presence of the so-called “vacuum disk” phenomenon. The bulging disk is often hypointense on both T1-WI and T2-WI (“black disk”). Furthermore, T2-WI may show a high-intensity zone (annular fissure), which can also be seen on contrast-enhanced T1-WI.
Fig. 21.10 
Disk bulging. MRI of a 50-year-old man with symptoms of long standing low back pain with new-onset sciatic pain in the right leg. Sagittal T2 weighted image (a), T1 weighted image (b) and an axial T1 weighted image are shown. Sagittal T2 weighted images (a) shows degenerating disks with loss of signal intensity at levels L3–L4, L4–L5 and L5–S1. Furthermore, a bulging disk can be seen on the levels L3–L4, L4–L5 and L5–S1 (a, b). The axial T1 weighted image (c) at the L4–L5 level shows a merely ventral circumferential hypointense disk broadening (arrowheads) affecting more than 180° of the circumference of the vertebral body (dashed line)

2.2.4 Disk Herniation
Definition
-
Displacement of disk material (nucleus, annular tissue, cartilage) beyond the margins of the vertebral body end plate; this displacement is not circumferential, i.e. affecting less than 50 % (180°) of the circumference of the disk.
General Features
-
There are different types of disk herniation: protrusion, extrusion and sequestration (Figs. 21.11, 21.12, 21.13, 21.14, and 21.15) [10].
Fig. 21.11 
(a) Simplified illustration of a disk herniation. A narrow-based (a) and a broad-based (b) disk protrusion is displayed on both the axial (left column) and sagittal (right column) plane. In both cases the base of the herniation is larger than the extension of the disk herniation beyond the disk margin. Notice the difference between disk herniation and a bulging disk (Compare with Fig. 21.9)
Fig. 21.12 
Disk protrusion. This 32-year-old man underwent an MRI examination for the evaluation of recurrent low back pain (i.e. long-standing low back pain). This examination included axial T2 weighted imaging (a) as well as sagittal T2 weighted imaging (b) and T1 weighted imaging (c). There is a signal loss of the L5–S1 intervertebral disk (asterisks) (b). A broad-based disk protrusion is present (arrowheads) causing an impression on the thecal sac. Note the presence of hypertrophic facet joints (arrows)
Fig. 21.13 
Simplified illustration of disk extrusion/sequestration. (a) Shows a disk extrusion, a form of disk herniation where the base is narrower than the portion of disk extending posterior into the epidural space, this in at least one plane. (b) Shows a disk sequestration, a subtype of disk extrusion, in which there is a free fragment of disk material, i.e. having no continuity with the parent disk. Notice the difference with a disk protrusion and a bulging disk (displacement over more than 50 % of the circumference of the disk). Compare with Figs. 21.9 and 21.11b
Fig. 21.14 
Disk extrusion with descending fragment. MRI of a 44-year old woman, presenting with left sided sciatic pain. Sagittal T2 weighted image (a) as well as axial T2 weighted images (b, c) are shown. The sagittal T2 weighted image (a) shows a disk herniation at L4–L5 with a descending fragment yet in continuity with the native disk (so-called toothpaste sign) with compression of the thecal sac. The base of the extruded disk is narrower than the diameter of the descending fragment. Axial T2 weighted images (b, c) confirm the extruded disk (b; arrow) with a descending fragment (c; arrowheads), thereby severely narrowing the spinal canal diameter
Fig. 21.15 
Disk extrusion. MRI of a 33-year old woman with increasing pain and a history of disk herniation at level L4-L5. This examination included sagittal T2 weigted images (a), sagittal T2 weigted images (b) and axial T2 weigted images (c). Sagittal images (a, b) show a L4–L5 disk herniation with a small component of disk material extending caudally (thick arrows) suggesting a disk extrusion with an additional sequester: this could however not be seen on this imaging modality. Notice a disk protrusion at L3–L4 (thin arrows). An axial T1 weighted image (c) shows the disk extruding into the epidural space (arrowheads)


Clinical Features
Symptoms may vary from low back pain to radicular pain and even cauda equina syndrome. These symptoms tend to become more severe with increased intra-abdominal pressure and during lumbar flexion and weight lifting.
Imaging Features
-
Imaging modalities of choice are CT and MRI. Axial and sagittal imaging is mandatory in the differentiation between protrusion and extrusion (as explained in Figs. 21.11 and 21.13). Both imaging planes are used to fully localize the extent of the disk herniation [10].
-
In the axial plane, disk herniation can be posterior-central, subarticular, foraminal and extraforaminal. The so-called “anterior zone” herniations are uncommon and usually asymptomatic.
-
In the sagittal plane, disk herniation can be suprapedicular, infrapedicular, pedicular or at disk level.
-
Contrast-enhanced studies often reveal peripheral enhancement on both CT and MRI, representing engorged epidural veins and/or inflammation and thickening of the posterior longitudinal ligament. This can be helpful to discriminate recurrent disk herniation from scar tissue in post-operative patients [11].
2.2.5 End Plate Changes
Degenerative vertebral end plate changes were first classified by Modic et al. [12] in 1988 and, as a result, are referred to as Modic changes. Three types of end plate changes are described, each with their characteristic features and differences on MRI:
-
Type I:
-
Hypointense on T1-WI
-
Hyperintense on T2-WI
-
-
Type II:
-
Hyperintense on T1-WI
-
Iso- to hyperintense on T2-WI
-
-
Type III:
-
Hypointense on both T1-WI and T2-WI
-
Type I changes represent bone marrow oedema and inflammation and are clearly associated with low back pain. These changes can convert to another type such as type 0 (no Modic changes) or type II changes. They are therefore said to be unstable.
Type II changes represent the conversion of normal red bone marrow to yellow bone marrow due to ischaemia and account for approximately 90 % of all Modic changes. In contrast to the type I changes, they are less commonly associated with low back pain and are said to be stable as they do not tend to convert (stress may occasionally cause conversion into type I changes).
Type III changes represent subchondral sclerosis and are usually not associated with low back pain.
3 The Facet Joints and Posterior Elements
Definition
-
Each segment of the vertebral column can be divided into two spaces: the anterior space (vertebral body) and the posterior space (vertebral arch).
-
The posterior elements together with the vertebral body enclose the spinal canal and neural foramina. These posterior elements consist of soft tissues (ligamenta flava, interspinous ligaments, supraspinous ligament, intertransverse ligaments) and bony structures (pedicles, facet joints, superior and inferior articular processes, mammillary processes, laminae and spinous processes) (Figs. 21.16, 21.17, and 21.18).
Fig. 21.16 
Posterior elements. Normal CT anatomy of the neural foramina and facet joints. Sagittal (a) and axial (b) CT reformatted images illustrate the normal anatomy of the posterior elements of the lumbar spine. n intervertebral neural foramen, P pedicle, S superior articular process, I inferior articular process, asterisk facet joint space, arrows lamina, Sp spinous process
Fig. 21.17 
Normal MRI anatomy of the posterior elements. This sagittal (a) and axial (b) MRI T2 weighted images show normal anatomy of the posterior elements of the lumbar spine. n intervertebral neural foramen, P pedicle, S superior articular process, I inferior articular process, asterisk facet joint space, L lamina, Sp spinous process. Please note the ligamentum flavum (arrows) that extends between the adjacent vertebral laminae (a). This ligament forms a characteristic V-shape on axial images (b)
Fig. 21.18 
CT volume rendering (VR) images of the normal posterior elements at the L4-L5 level. Lateral (a) and posterolateral (3/4) (b) images. n intervertebral neural foramen, P pedicle, S superior articular process, I inferior articular process, Ls lamina, Sp spinous process, T transverse process
-
In the lumbar spine, pathology of the posterior elements can be the cause of low back pain, even in patients with normal intervertebral disks.


In this section we will discuss the most common pathologies of the posterior elements in the lumbar spine. This includes osteoarthritis of the facet joints, facet joint cyst formation, cysts of the ligamentum flavum (yellow ligament) and hypertrophy of the ligamentum flavum.
3.1 Osteoarthritis of the Facet Joints
General Features
-
The facet joints are synovial joints located between two adjacent vertebral arches (Figs. 21.16, 21.17, and 21.18). Together with the diskovertebral complex, they allow movements between the vertebrae.
-
The surface of a normal facet joint is smooth, layered with hyaline cartilage, which gradually disappears as degeneration progresses.
-
Degenerative osteoarthritis of the facet joints causes formation of osteophytes and subchondral cysts, joint hypertrophy, osteosclerosis, narrowing of the joint space, vacuum phenomenon, joint effusion and sometimes facet joint cysts.
-
Osteoarthritis of the facet joints is a frequent cause of central, lateral and foraminal stenosis when osteophyte formation is significant.
Imaging Features
-
MRI and CT are the imaging modalities of choice. Plain radiographs are of limited value in the evaluation of the facet joints.
-
Both CT and MRI have enough spatial resolution to correctly assess the facet joints. Imaging should be performed in both axial and sagittal planes.
-
CT has been proven superior to MRI in the assessment of joint space narrowing, osteophytes and subchondral osteosclerosis (Figs. 21.19 and 21.22).
Fig. 21.19 
Facet joint degeneration. CT and MRI imaging of the lumbar spine in a 65-year-old man with severe low back pain. Sagittal (a) and axial (b) CT images and axial T2 weighted image MR image (c) show osteoarthritis of the facet joints at L3–L4. Hypertrophy and narrowing of the joint space can be observed on both modalities. Note subchondral erosions (arrowheads) on axial CT (b) and MRI (c) images. Osteophytes and intra-articular air, the so-called vacuum phenomenon (arrow), are usually better appreciated on CT imaging
-
MRI is superior to CT in the assessment of joint effusion. Sagittal MRI images or reformatted CT images are preferred for measuring the diameters of the spinal canal and neural foramina (Figs. 21.19, 21.21, and 21.22).

3.1.1 Juxtafacet Cysts and Cysts of the Ligamentum Flavum
General Features [13]
-
Juxtafacet cysts arise from the facet joint (synovial cysts) or periarticular space (ganglion cysts) as a result of degeneration of the facet joint. They are observed most commonly in the lumbar spine at L4–L5. When they grow large, they can cause compression of the nerve roots and thecal sac.
-
Cysts of the ligamentum flavum are much less common than juxtafacet cysts and occur almost exclusively in the lumbar spine, mostly at L4–L5, as a result of degeneration.
Imaging Features
-
MRI is the modality of choice due to its high sensitivity.
-
Juxtafacet cysts on MRI imaging are mostly isointense to the cerebrospinal fluid (CSF). On T2-WI, these lesions can present a higher signal intensity than CSF when they have a proteinaceous content. A rim of enhancement is present after administration of gadolinium. On CT, they appear as hypoattenuating lesions. They may contain calcifications and gas (Fig. 21.20).
Fig. 21.20 
Synovial cyst of the facet joint. MRI of the lumbar spine in a 70-year-old man with chronic low back pain and recent onset of left-sided sciatica. Sagittal and axial T2 weighted images upon admission (a, b) and after surgery (c, d) are shown. The preoperative MRI (a, b) shows a large cyst of the left facet joint compressing the thecal sac and obliterating the left lateral recess. The cyst contents are inhomogeneous, with a hypointense peripheral rim (arrowheads). The cyst was surgically removed and the diagnosis of a synovial cyst was confirmed. The post-operative examination (c, d) shows that the synovial cyst has been completely removed. A small fluid collection posteriorly in the soft tissues (asterisk) is observed. Also note the degenerative anterolisthesis of L5 due to bilateral hypertrophic facet joint degeneration. On axial images, no evidence for lysis was encountered
-
Cysts of the ligamentum flavum appear as round masses adjacent to the ligamentum flavum with high signal intensity on T2-weighted images. Peripheral enhancement after gadolinium is observed. Calcifications are uncommon (Fig. 21.21).
Fig. 21.21 
Hypertrophy of the ligamenta flava with a ligamentum flavum cyst in a 55-year-old woman with neurogenic claudication. The preoperative MRI, with sagittal and axial T2 weighted images (a–c) and sagittal T1 weighted image (b), shows a cystic mass arising from the ligamentum flavum (arrow) at the level of L4–L5, which compresses the thecal sac posteriorly. The cyst is moderately hyperintense on T2 weighted images and hypointense on T1 weighted images. There is marked hypertrophy of the ligamenta flava (asterisk), which compress the thecal sac laterally (c). The cyst and the hypertrophic ligamenta flava were surgically removed and the diagnosis of a ligamentum flavum cyst was confirmed. The post-operative MRI examination 1 year after surgery, with sagittal (d) and axial (e) T2 weighted images, shows no sign of compression on the thecal sac. There is a bilateral joint effusion (open arrowheads) in the degenerative facet joints (e)


3.1.2 Hypertrophy of the Ligamentum Flavum
General Features
-
The ligamenta flava are spinal ligaments between the posterior aspects of the laminae of adjacent vertebral bodies (Fig. 21.17).
-
Hypertrophy of the ligamenta flava is commonly associated with degeneration of the facet joints.
-
The degenerative process induces fibrosis in the normal ligaments, which become more rigid and may eventually ossify. As a result, the intraspinal space decreases leading to compression of the thecal sac and eventually of the cauda equina.
Imaging Features
-
CT and MRI are preferred over plain films and myelography.
-
CT and MRI show hypertrophy of the ligamenta flava, which form a characteristic V-shape along the laminae (Fig. 21.22).
Fig. 21.22 
Hypertrophy of the ligamenta flava. CT and MRI of the lumbar spine in a 70-year-old man with neurogenic claudication. Axial CT (a) and axial T2-weighted (b) MR images demonstrate thickened ligamenta flava (asterisk) which compress the thecal sac posterolaterally. There is bilateral facet joint degeneration with accumulation of intra-articular air (“vacuum phenomenon”) in the left facet joint (black arrow), best seen on the CT image (a). The joints effusion (open arrowheads) is best seen on the MR image (b)
-
CT is superior to MRI in the detection of calcifications of these ligaments.
-
MRI shows better the effect of the compression.

3.2 Baastrup’s Disease
General Features and Imaging
Baastrup’s disease, otherwise known as the “kissing spine”, can be sometimes observed in patients with chronic low back pain. It refers to degenerative bone and soft tissue changes between apposing spinous processes. It is caused by hyperlordosis (Roussouly type 4) (see also Chap. 39), loss of disk space height or spinal instability with retrolisthesis of the cranial vertebra [14].
-
The adjacent spinous processes stay in close approximation to each other, which can be observed on medical imaging.
-
CT scan shows sclerosis and subchondral changes in the adjacent spinous processes (Fig. 21.23).
Fig. 21.23 
Baastrup’s disease. CT scan of the lumbar spine in a 65-year-old woman with long-standing low back pain. CT sagittal reformatted image showing a marked narrowing of all lumbar interspinous spaces (arrows). The surfaces of the adjacent spinous processes are sclerotic and markedly hypertrophic. Also note the degeneration of the intervertebral disks and a degenerative anterolisthesis of L4 due to bilateral hypertrophic facet joint degeneration
-
MRI is better in detecting effusion, cysts formation or bone marrow oedema. Fatty replacement of the paraspinal muscles is often described (Fig. 21.24).
Fig. 21.24 
Baastrup’s disease. MRI of the lumbar spine in a 68-year-old man with low back pain. Sagittal T2 weighted image (a) demonstrates narrowing of the interspinous spaces and the presence of subchondral erosions (arrowheads). A small cyst arising from the interspinous space at L4–L5 (arrow) is observed. Note the atrophy and fatty degeneration of the paraspinal musculature (black arrowheads) on the axial T2 weighted image (b), a common feature in patients with Baastrup’s disease. Also note bilateral hypertrophic facet joint degeneration on the axial image (b) and disk degeneration at L5–S1 on the sagittal image (a)


4 Acquired Spinal Canal and Neuroforaminal Stenosis
Definition
-
Narrowing of the spinal canal and/or neural foramen secondary to multifactorial degenerative changes.
General Features [15]
-
Can be congenital (idiopathic or achondroplastic) or acquired (degenerative, iatrogenic, posttraumatic, metabolic and spondylolisthetic)
-
Mostly due to degenerative (acquired) changes
-
Anteriorly (spondylosis deformans with osteophyte formation, disk degeneration with bulging or herniation).
-
Posteriorly (degeneration and hypertrophy of the facet joints, hypertrophy or buckling of the ligamenta flava …).
-
The net result is an abnormal narrowing of the spinal canal, lateral recess and/or neural foramen. The epidural fat is usually disappeared or necrotic.
-
-
Spinal stenosis is most commonly found at high mobility levels (L4–L5).
-
Sagittal diameter of the spinal canal <13 mm: relative stenosis
-
Sagittal diameter of the spinal canal <10 mm: absolute stenosis
-
Imaging Features
-
Myelography as an imaging technique has been supplanted by MRI (or CT).
-
Axial images on MRI show a typical triangular “trefoil” appearance (Fig. 21.25).
Fig. 21.25 
Spinal canal stenosis. MRI of a 69-year-old woman with low back pain, irradiating to both legs and neurogenic claudication. The sagittal T2 weighted MR image (a) shows anterolisthesis of L4 on L5 due to hypertrophic facet joints. This results in a spinal canal stenosis, as seen on axial T2 weighted image (b) and T1 weighted image (c) (arrows). Note in (a) the presence of thickened, tortuous and elongated nerve roots of the cauda equina above the level of the stenosis; this finding is known as “redundant nerve roots” syndrome, resulting from chronic extradural compression
-
Both axial and sagittal images show extrinsic impressions on the thecal sac.
-
On sagittal T2-WI, the nerve roots of the cauda equina present a thickened and elongated appearance above the level of the most severe stenosis. This appearance is known as “redundant nerve roots” and is a sign of functionally severe spinal stenosis.
-
Typical imaging findings in spinal stenosis include hypertrophic facet joints (Fig. 21.26), thickened ligamenta flava, vertebral end plate osteophytes, narrowing of the neural foramina and obliteration of the epidural fat.
Fig. 21.26 
Spinal canal stenosis and synovial cyst. MRI of a 78-year-old patient with low back pain. Sagittal T2 weighted (a) and T1 weighted (b) MR images show spinal stenosis due to anterolisthesis of L4 on L5 and the presence of a synovial cyst (thick arrow). Axial T2 weighted images (c, d) show severe narrowing of the spinal canal (small arrows) with the presence of hypertrophic and degenerative facet joints (arrowheads) and a synovial cyst (arrow)


5 Spondylosis Deformans
Definition
-
Hypertrophic bone changes with osteophyte formation caused by degeneration of the annulus fibrosus (Fig. 21.27).
Fig. 21.27 
Spondylosis deformans. CT of a 74-year-old woman with right-sided sciatica. There is a lumbosacral transitional anomaly with lumbalization of S1. The soft tissue windows (a and c) show narrowing of the intervertebral spaces and degenerative disk bulging at levels L3–L4, L4–L5 and L5–S1 (a). A “vacuum disk” phenomenon (white arrow) is present as a sign of degenerative disease. Changes at the facet joints and the vertebral end plates can be seen in the bone window images (b, d). Osteophytic spur formation is most prominent at L4–L5 and L5–S1 (arrowheads). These degenerative changes result in a narrowing of the right (c) neural foramina (black arrows). An intravertebral disk herniation (so-called Schmorl’s node) is present in the lower end plate of L5 (dashed arrow) (b)

General Features [16]
-
As disk degeneration progresses and the intervertebral space decreases in height, an increased pressure is brought upon both the facet joints and the vertebral end plates.
-
This results in progressive cartilage loss adjacent to the end plates which, in turn, results in hypertrophic changes causing formation of osteophytes at the anterior and lateral part of the vertebral body and/or facet joints.
-
In patients with lumbar hyperlordosis, hypertrophic osseous proliferation can also occur between spinous processes causing the so-called Baastrup’s disease.
-
Bone marrow changes, reactive sclerosis and end plate erosions can be seen at a late stage.
Clinical Features
-
These changes may cause low back pain, morning stiffness, crepitations and a decreased range of motion, the typical characteristics of osteoarthritis.
Imaging Features
-
Hypertrophic bone changes can be depicted on CT examinations at the level of lumbar vertebrae, spinous processes and sacroiliac joints (Fig. 21.27).
-
When small, osteophytes demonstrate a hypointense signal on T1-weigthed and fluid-sensitive images. As they enlarge, they may have a more isointense signal compared to the normal bone marrow.
-
Other features of degenerative disk changes can also be observed using CT and/or MRI (disk disease, spinal stenosis, narrowing of the neuroforamina).
References
Belkoff SM (2007) Biomechanics of the spine. In: Van Goethem J, van den Hauwe L, Parizel P (eds) Spinal imaging, 1st edn. Springer, Berlin, pp 87–93
Jindal G, Pukenas B (2011) Normal spinal anatomy on magnetic resonance imaging. Magn Reson Imaging Clin N Am 19:475–488
Pfirrmann CW, Metzdorf A, Zanetti M, Hodler J, Boos N (2001) Magnetic resonance classification of lumbar intervertebral disc degeneration. Spine (Phila Pa 1976) 26:1873–1878
Marinelli NL, Haughton VM, Munoz A, Anderson PA (2009) T2 relaxation times of intervertebral disc tissue correlated with water content and proteoglycan content. Spine (Phila Pa 1976) 34:520–524
Thompson JP, Pearce RH, Schechter MT, Adams ME, Tsang IK, Bishop PB (1990) Preliminary evaluation of a scheme for grading the gross morphology of the human intervertebral disc. Spine (Phila Pa 1976) 15:411–415
Goldie I (1958) Granulation tissue in the ruptured intervertebral disc. Acta Pathol Microbiol Scand 42:302–304
Nowicki BH, Haughton VM, Schmidt TA, Lim TH, An HS, Riley LH 3rd, Yu L, Hong JW (1996) Occult lumbar lateral spinal stenosis in neural foramina subjected to physiologic loading. AJNR Am J Neuroradiol 17:1605–1614
Modic MT, Ross JS (2007) Lumbar degenerative disk disease. Radiology 245:43–61
Sharma A, Pilgram T, Wippold FJ 2nd (2009) Association between annular tears and disk degeneration: a longitudinal study. AJNR Am J Neuroradiol 30:500–506
Fardon DF, Milette PC, Combined Task Forces of the North American Spine Society ASoSR, American Society of N (2001) Nomenclature and classification of lumbar disc pathology. Recommendations of the combined task forces of the North American Spine Society, American Society of Spine Radiology, and American Society of Neuroradiology. Spine (Phila Pa 1976) 26:E93–E113
Van de Kelft E, van Vyve M, Selosse P (1992) Postsurgical follow-up by MRI of anterior cervical discectomy without fusion. Eur J Radiol 15:196–199
Modic MT, Steinberg PM, Ross JS, Masaryk TJ, Carter JR (1988) Degenerative disk disease: assessment of changes in vertebral body marrow with MR imaging. Radiology 166:193–199
Choudhri HF, Perling LH (2006) Diagnosis and management of juxtafacet cysts. Neurosurg focus 20(3):E1
Filippiadis DK, Mazioti A, Argentos S, Anselmetti G, Papakonstantinou O, Kelekis N, et al (2015) Baastrup’s disease (kissing spines syndrome): a pictorial review. Insights imaging 6(1):123–128
Botwin KP, Gruber RD (2003) Lumbar spinal stenosis: anatomy and pathogenesis. Phys Med Rehabil Clin N Am 14:1–15, v
Resnick D (1985) Degenerative diseases of the vertebral column. Radiology 156:3–14
Author information
Authors and Affiliations
Corresponding author
Editor information
Editors and Affiliations
Rights and permissions
Copyright information
© 2016 Springer International Publishing Switzerland
About this chapter
Cite this chapter
Carpentier, K., Augsburg, L., De Potter, B., Van Goethem, J.W.M., Parizel, P.M. (2016). A Concise Introduction to the Imaging of the Lumbar Spine. In: van de Kelft, E. (eds) Surgery of the Spine and Spinal Cord. Springer, Cham. https://doi.org/10.1007/978-3-319-27613-7_21
Download citation
DOI: https://doi.org/10.1007/978-3-319-27613-7_21
Published:
Publisher Name: Springer, Cham
Print ISBN: 978-3-319-27611-3
Online ISBN: 978-3-319-27613-7
eBook Packages: MedicineMedicine (R0)