
Abstract
The prioritisation of wetland ecosystems is the essential information contributing to scientific and methodological fundamentals for establishing the National strategy and plan on environment protection and biodiversity conservation for each wetland ecosystem in Vietnam. This paper proposes the method of mapping and ordering the priority of wetland ecosystems protection and restoration based on the application of GIS, remote sensing, landscape ecology approach, and multi-criteria analysis. The primary method consists of 3 phases: (i) Defining the protection and restoration criteria; (ii) Mapping wetland ecosystems and building criteria layers based on GIS, remote sensing, and landscape ecology approach; (iii) Determining the priority of wetland ecosystems using multi-criteria analysis. This method is applied to Dong Thap Muoi—a high biodiversity wetland region composing two Ramsar sites and conservation areas. The data of 14 criteria on capacity, degradation services, and pressures on each wetland ecosystem are synthesised using GIS and remote sensing images. AHP-TOPSIS—a hybrid multi-criteria assessment method prioritises wetland ecosystems’ conservation and restoration. The study indicated that the criteria of the number of endangered and rare species, total species, invasive alien species, and the lost number of endangered, rare animals and plants play a crucial role in prioritising protection and restoration. The results are the wetland ecosystems protection and restoration priority order maps, which support making appropriate decisions to formulate policies and build conservation strategies and plans in the Dong Thap Muoi region.
Access provided by Autonomous University of Puebla. Download conference paper PDF
Keywords
- Wetland ecosystem
- GIS
- Remote sensing
- Landscape ecology
- Multi-criteria analysis
- Priority order
- Wetland protection
- Restoration
30.1 Introduction
Wetland is among the most valuable environments globally, essential for the survival, reproduction, and biodiversity of animals and plants, where birds, mammals, reptiles, amphibians, fish, and invertebrates are densely gathered and store the vital plant gene sources. The interaction of physical, biological, and chemical elements of the wetlands as part of the “infrastructure nature” of the Earth forms the functions for life, such as water storage, storm shielding, flood mitigation, coastal stability and erosion control, groundwater supply and storage, water purification, nutrients, sediments, and contaminants retention, local climatic condition regulation. Besides that, wetland ecosystems also provide education, entertainment, travel services, and human livelihoods (Ramsar Convention Secretariat 2013a, b; Vietnam Environmental Protection Department 2005).
Having had 12 million ha of wetland (https:// baotainguyenmoitruong.vn/bao-ton-va-su-dung-ben-vung-cac-vung-dat-ngap-nuoc-298871.html), Vietnam is known as one of the high biodiversity countries in the world with a variety of wetland ecosystem types, species of creatures, and richness of gen source. Economic development and climate change have been making a significant negative impact on wetland ecosystems. Human activities have significantly resulted in the lost and degraded biodiversity lost and degraded, such as mangrove deforestation, forest burning, destructive fishing practices, environmental pollution, overexploitation, and the introduction of invasive species. Besides, such natural disasters as fires, storms, drought, salinisation, cyclones, and epidemics, are also other factors that badly affect the condition and primary natural resources of wetlands (Vietnam Environmental Protection Department 2005; Ministry of Natural Resources and Environment 2021; Nhan 2014). Consideration of great biodiversity potentials, services, and the threats to the wetland ecosystems, it is vital to investigate and evaluate the environmental status, the gen and the species richness, and the degraded natural ecosystem to find possible solutions for restoration, conservation, and wise and resilient usage of Vietnam’s biological resources.
In Vietnam, the contents of planning for environmental protection and biodiversity conservation include: assessing the status and evolution of environmental quality, natural landscape, biodiversity, and climate change effects; defining the objectives, the tasks, and solutions for environmental protection; zoning the environment; conserving nature and biodiversity; and building criteria to determine the critical level and the implement priority order of national projects, (National Assembly of the Socialist Republic of Vietnam 2020; National Assembly of the Socialist Republic of Vietnam 2017). The decrees detail several articles of the Law on Environmental protection and planning (Government of the Socialist Republic of Vietnam 2019; Government of the Socialist Republic of Vietnam 2022) show that wetland ecosystem is one content of biodiversity conservation planning, which has to evaluate and order the priority for investment and implementation.
By 2030, Vietnam’s National strategy on biodiversity (Prime Minister of the Socialist Republic of Vietnam 2022) is conservation with sustainable ecosystem services usage, and biodiversity contributes to developing the social economy, reducing poverty, and improving people’s living standards by applying the ecosystem approach to conservation and biodiversity. The National strategy’s general target on biodiversity is increasing the area of protected and restored natural ecosystems, keeping the integrity and connection. Besides, the strategy also defines some of the content and critical building the processes and technical guidance for restoring the degraded natural ecosystems, especially wetland ecosystems, coral reefs, and seagrass, and developing the guide of ecosystem services quantification.
Previous studies and projects mainly focused on wetland classification based on water and land cover elements without indicating the different conditions of wetland ecosystems such as forming origin, soil, elevation, climate, hydrology, oceanography (Hai et al. 2015; Phuong and Hoe 2015; Linh et al. 2018; Vietnam Institute and of Geodesy and Cartography 2012; Vietnam Institute and of Geodesy and Cartography 2018; Vietnam Institute and of Geodesy and Cartography 2020; Xuan and Hoa 2015). These are also the essential elements that form in a particular wetland ecosystem.
In Vietnam, the ecological landscape approach has been applied to study the adaptation of some plants to develop the economy and conserve mangrove forests (Nguyen et al. 2015); zone and evaluate the ecological landscape potential for territorial organisation, planning for sustainable development of coastal wetland ecosystem (Hang 2012; Duong 2009) or assess landscape according to ecological-economic approach (Huan 2005). Landscape analysis is also used in the world to research wetlands (Tudor 2014; Environmental Law Institute 2013; Lopez et al. 2013; Malekmohammadi and Jahanishakib 2017); there has not been any proposal on the mapping process of wetland ecosystems based on the ecological landscape approach in all the above papers and books.
The requirements to show that the project or wetland ecosystem needs to be prioritised for protection and restoration are appropriate criteria and assessment methods. Globally, there are a significant number of studies to identify wetlands that need conservation based on assessing the criteria about biodiversity value, role of ecosystem functions and services (Ramsar Convention Secretariat 2013a, b; Mekong River Commission 2017), risks and vulnerabilities (Malekmohammadi and Jahanishakib 2017; Jiang et al. 2017; Sarkar et al. 2016; Malekmohammadi and Rahimi Blouchi 2014). In Vietnam, the papers often focus on the vital status, pressor, and benefits indicators for measuring and monitoring wetland ecosystems (Nhan 2010, 2014; Lan and Hai 2009)Footnote 1; sensitive and degradation assessment criteria for coastal wetland ecosystems (Yet et al. 2010; Hung and Hoe 2014), … Using the proposed criteria separately in these studies may not have been sufficient; therefore, the combination usage will comprehensively assess priorities for protecting and restoring wetland ecosystems.
The multi-criteria assessment methods are widely used around the world in many fields. The MCA, AHP, F-AHP, TOPSIS, and F-TOPSIS methods are used to assess and choose the solution for waste management, finding the best position for burying waste. The combinations of MCA, ELECTRE, Delphi, DA, F-MAA, F-AHP, TOPSIS, SWOT, ANP, DPSIR and MUPOM are used to assess environmental quality and climate change, sustainability and ecology. Based upon the association of the DPSIR model with DSS, MCA, MCDA, TOPSIS, and CP, combining Delphi and AHP methods, integrated AHP—GIS to evaluate and manage water resources, river basin, reservoir, flood, and hazards. Using ANP, MCA, MCDA, AHP-TOPSIS for land management; assessing crop selection, agricultural risks, and deciding in agriculture (Chan et al. 2019; Hajkowicz and Higgins 2008; Jozaghi et al. 2018; Opricovic and Tzeng 2004; Velasquez and Hester 2013).
In Vietnam, AHP, PCA, PRA, and SAW methods are used to assess land-use sustainability, select crop models, and determine the weight of the component indexes in the green urban index set. PAM, MFA, AHP, and PCA are used to evaluate green growth. Assessment of landscape ecological adaptation is done by using AHP and F-AHP. The selection of locations for the planning of waste burial using AHP, F-AHP GIS (Cuong 2009; Dat et al. 2017; Dinh 2016; Huong 2030; Linh et al. 2017; Luan and Tram 2013) … However, the multi-criteria analysis method to prioritise wetland ecosystems protection and restoration in Vietnam has not been studied yet.
Remote sensing and GIS have been popularly used to extract, process, and analyse data from multiple sources such as satellite images, geodatabase, topographic maps, elevation data, and LiDAR data… for many applications. The wetland’s information on the cover, water quality, landscape degradation, fire risk, and elevation can be captured using remote sensing data. GIS is used to model spatial distribution, character, and attributes of natural, social-economic features by using the algorithm of assign information, overlay, analyzation, calculation, interpolation; editing and publishing thematic maps (Linh et al. 2018; Vietnam Institute and of Geodesy and Cartography 2012; Vietnam Institute and of Geodesy and Cartography 2018; Vietnam Institute and of Geodesy and Cartography 2020; Xuan and Hoa 2015; Hang 2012; Kien et al. 2013; Vietnam Environment Administration 2011; Ve et al. 2013; Tin et al. 2011; Phu 2009; Son 2008).Footnote 2 Therefore, remote sensing and GIS are useful technologies to extract and build data to prioritise wetland ecosystem protection and restoration.
Dong Thap Muoi stretches over three Long An, Tien Giang, and Dong Thap provinces, with about 700,000 ha of Melaleuca forest and water surface. The region is a closed floodplain surrounded by high mounds along the Vietnam-Cambodia border with the storage of over 100 billion m3 of water storage. Dong Thap Muoi is the last place where the flooded cane and reed forest, one of the typical wetland ecosystems, still exists. Dong Thap Muoi has a relatively sizeable flooded area and high biodiversity in Vietnam with two Ramsar sites, namely Tram Chim National Park in Dong Thap and Lang Sen wetland reserve in Long An. In addition, there are Dong Thap Muoi ecological reserve, biodiversity conservation areas such as Xeo Quyt relic site, and Gao Giong eco-tourism area. These places are the habitat of many species of birds, fish, reptiles, and benthic animals, including many endemic and rare species that need to be protected, and several species, that are in danger of extinction. The wetlands in this area face many problems such as drought, saltwater intrusion, forest fires, sea-level rise, the invasion of alien species due to agricultural production and farming activities, aquaculture, industrial development, tourism, and other human factors demands (Vietnam Institute of Geodesy and Cartography 2012). The ongoing conducted studies in the Dong Thap Muoi region mainly focus on solutions to improve the land and the economic efficiency of the rice-growing wetlands, evaluate the potential for tourism development; conservation of ecosystems, wetlands, and adaptation to climate change with no research related to determining the priority level of protection and restoration of wetland ecosystems. Therefore, the study and application of GIS, remote sensing, landscape ecology approach, and multi-criteria analysis for mapping and ordering priority of wetland ecosystems protection and restoration is essential (Fig. 30.1).

Location of the Dong Thap Muoi (Vietnam Institute and of Geodesy and Cartography 2012)
30.2 Researching Data and Methodology
30.2.1 Researching Data
This paper used the data below to build the thematic data layer for each protection and restoration assessment criteria. The detail is shown in Table 30.1. Dong Thap Muoi’s data is shown in the VN2000 coordinate system.
30.2.2 Researching Methodology
The mapping and ordering of wetland ecosystem protection and restoration priority shown in Fig. 30.2 include three main phases: (i) Defining the protection and restoration definition criteria; (ii) Mapping wetland ecosystems and building criteria layers; (iii) Ordering the protection and restoration priority of wetland ecosystems.

Process of mapping and ordering wetland ecosystem protection, restoration priority
30.2.2.1 Defining the Wetland Ecosystem Protection and Restoration Priority Criteria
The targets of wetland ecosystem protection and restoration are defined based on the referenced documents and data on natural, socio-economic, and environmental conditions and previous research results or use survey consultation results with people, managers, or experts. For each aim, criteria for ordering protection and restoration priority of wetland ecosystems are defined based on ecosystem service values, potential risk pressures, and external factors (natural or man-made hazards).
30.2.2.2 Mapping Wetland Ecosystems and Building Criteria Layers
-
(a)
Mapping wetland ecosystems
The wetland ecosystems mapping process is indicated in Fig. 30.3. In this step, the wetland ecosystems map is built using seven thematic landscape ecology data: geology, topography and geomorphology, oceanology and hydrology, bio-climate, soil, vegetation cover, and land use status. These data are created from existing ones or extracted from satellite data and normalised the attribute, boundaries, and topology by GIS. Classifying and numbering landscape types is carried out by overlaying thematic layers. The next step is establishing the wetland ecosystems map based on numbered landscape types using criteria to identify wetland types. The steps as shown in Thuy (2020).
Fig. 30.3 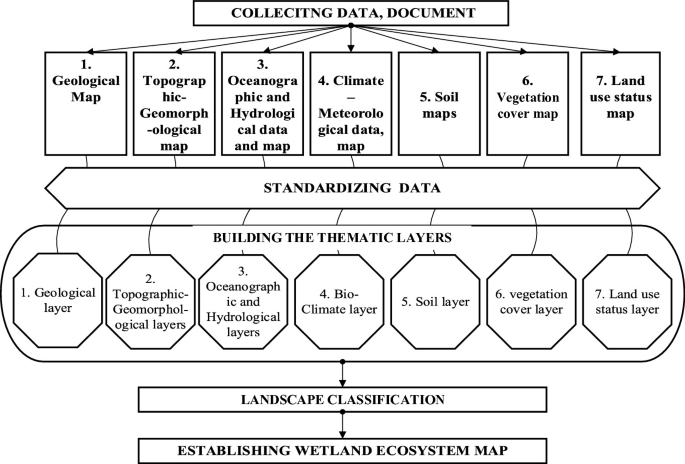
The process of wetland ecosystems mapping

-
(b)
Building criteria layers
Using the methods such as collection, statistic, synthesis document, data; field interview, investigation, and survey; measuring, sampling, and analysing samples; modelling; analysing and processing information; and mapping, remote sensing, and GIS to extract and build criteria layers. Area and density of vegetation, land-use change, surface water quality indicators, land surface temperature, and moisture content are extracted from satellite images combined with field observation data. GIS technology is used to assign and spatialise attributes, overlay, and calculate change; interpolate, re-classify, and construct raster data layers on distance, slope, terrain elevation, temperature, humidity, and precipitation.
The above methods will be chosen depending on the studying regions to collect, extract, model data, and information for the proposed method’s input data.
-
(c)
Creating the integrated map
The integrated criteria data layer is done by joining the attribute information according to each criterion into the wetland ecosystem layer (map). This step is performed using data superposition techniques, spatial queries, raster data analysis, and attribute association of GIS tools. The result will be exported to build a decision matrix—input data for assessing and ranking priority levels for the protection and restoration of wetland ecosystems.
30.2.2.3 Ordering the Protection and Restoration Priority of Wetland Ecosystems
Analysing many multi-criteria assessment methods shows that the AHP method provides a solution to determine the weights of the reliable criteria through assessing consistency. This solution eliminates the disadvantage of the TOPSIS in that there is no technique to control the reliability of the input criteria weight set. TOPSIS provides a solution to determine the distances from alternatives to the positive and negative ideal solutions, determining the order of priority and overcoming the weakness of AHP, which is the ranking permutation (Velasquez and Hester 2013; Dat et al. 2017) … From these characteristics, this paper proposes a combination of AHP and TOPSIS to order the priority of wetland ecosystems.
-
(a)
Defining the input criteria weight set by using AHP
AHP method is used to construct the pair-wise comparison matrix, calculate the weighted set of the evaluation criteria, and determine the consistency in assessing the importance of the criteria. The comparisons are made in pairs and aggregated into a pair-wise comparison matrix of n rows and n columns (n is the number of criteria).
The pair-wise comparison matrix is represented by the following formula (Saaty 1980; Phuong and Mai 2018):
$$ \begin{aligned} A = \left( {a_{ij} } \right)_{n \times n} & = [\begin{array}{*{20}c} 1 & {a_{12} } & { \ldots } & {a_{1n} } & {a_{21} } & \vdots & {a_{n1} } & 1 \\ \end{array} \\ & \quad \;\begin{array}{*{20}c} \vdots & {a_{n2} } & \ldots & \ddots & \cdots & {a_{2n} } & \vdots & 1 \\ \end{array} ] \\ \end{aligned} $$(30.1)In which, \(a_{ij}\) shows the importance of the ith row criterion compared to the j column criterion. The relative importance of criterion i compared to criterion j is calculated according to the ratio k, whereas criterion j compared to criterion i is 1/k thus \(a_{ij} = \frac{1}{{a_{ji} }}\). The level of importance is referenced in Saaty’s pair-wise comparison table (Saaty 1980).
The AHP determines the inconsistency of pair-wise comparisons (expert judgments) through the consistency ratio (CR) according to the following formula (Saaty 1980):
where CR is the consistency ratio, CI is the consistency index, and RI is the random consistency index corresponding to the number of criteria (n) provided in Table 30.2.
If CR < 0.1, the pair-wise comparison matrix is consistent, so the set of weights is accepted to move on to the next step. Use the AHP method’s weights to calculate, process, and rank the wetland ecosystems that must be prioritised for protection and restoration.
-
(b)
Ordering the protection and restoration priority of wetland ecosystems
TOPSIS based on the fundamental premise that the best solution has the shortest distance from each alternative to the positive-ideal solution and the longest distance from each alternative to the negative-ideal one. Alternatives are ranked using an overall index calculated based on the distances from the ideal solutions. The ordering of the protection and restoration priority of wetland ecosystems by TOPSIS contains the below steps (Jozaghi et al. 2018):
-
Step 1
Building the decision matrix
The decision matrix \(X = (x_{ij} )_{m \times n}\) has the number of rows as the wetland ecosystems to be ranked and the number of columns as the criteria used to calculate the order of protection and restoration priority.
-
Step 2
Calculating the normalised decision matrix
The normalised decision matrix is built to transform the dimensional units into scalar units to compare the criteria values in the matrix \(X = (x_{ij} )_{m \times n}\). The normalised value rij is calculated by the following formulas:
$$ \begin{aligned} R = \left( {r_{ij} } \right)_{m \times n} & = \begin{array}{*{20}c} {A_1 } & {A_2 } \\ \end{array} \\ & \quad \begin{array}{*{20}c} \vdots & {A_m } \\ \end{array} (\begin{array}{*{20}l} {r_{11} } \hfill & {r_{12} } \hfill & {r_{21} } \hfill & {r_{22} } \hfill & \ldots \hfill & {r_{1n} } \hfill & \ldots \hfill & {r_{ \ldots n} } \hfill & \ldots \hfill \\ \end{array} \\ & \quad \begin{array}{*{20}l} \vdots \hfill & \ldots \hfill & { \ldots_{m1} } \hfill & {r_{m \ldots } } \hfill & \vdots \hfill & \vdots \hfill & \ldots \hfill & {r_{mn} } \hfill \\ \end{array} ) \\ \end{aligned} $$(30.4)where
$$ r_{ij} = x_{ij} /\sqrt {\sum_{i = 1}^m {\left( {x_{ij} } \right)^2 } } $$(30.5)$$ r_{ij} = 1 - (x_{ij} / \sqrt {\sum_{i = 1}^m {\left( {x_{ij} } \right)^2 } } ) $$(30.6)The formula (30.5) is used to calculate normalised values of the positive (good) criteria, and formula (30.6) is applied for the negative (bad) criteria.
-
Step 3
Calculating the weighted normalised decision matrix
The weighted normalised matrix is calculated by multiplying the value normalised decision matrix rij by the weight of corresponding criteria (which is calculated by AHP). The weighted normalised value \(\upsilon_{ij}\) is presented by the formula (30.7):
$$ \upsilon_{ij} = w_{j} \times r_{ij} $$(30.7)where i = 1,…, m; j = 1,…, n; m is the number of attribute values in each criterion, n is the number of criteria, wj is the weight of jth criteria.
-
Step 4
Calculating the positive and negative ideal solutions
The positive (A+) and negative (A−) ideal solutions are defined by using formula (30.8) and formula (30.9) as:
$$ A^{+} = \left[ {\upsilon_{1}^{+} , \ldots ,\upsilon_{2}^{+} , \ldots ,\upsilon_{n}^{+} } \right] $$(30.8)$$ A^{-} = \left[ {\upsilon_{1}^{-}, \ldots ,\upsilon_{\ldots}^{-} , \ldots , \ldots_{n}^{-} } \right] $$(30.9)where \( \{ \upsilon_{j}^{+} = \left\{ {\upsilon_{\ldots} } \right\};\;\;i = 1,2, \ldots , m \upsilon_{j}^{-} = \left\{ {\upsilon_{ij} } \right\};\;\; i = 1,2, \ldots ,m \) if jth criterion is positive.
\( \{ v_{j}^{+} = \left\{ {\upsilon_{ij} } \right\}; \;\;i = 1,2, \ldots ,m \upsilon_{j}^{-} = \left\{ {\upsilon_{ \ldots j} } \right\};\;\; i = 1,2, \ldots ,m \) if jth criterion is negative.
-
Step 5
Calculating the distance from each alternative (wetland ecosystem) to the positive and negative ideal solution
The distance from each alternative to the positive and negative ideal solutions is obtained by applying the Euclidean distance theory. Formulas (30.10) and (30.11) show positive and negative distance calculation processes.
$$ S_{i}^{ + } = \sqrt {\mathop \sum \limits_{{j = 1}}^{n} \left( {\upsilon _{{ij}} - \upsilon_{j}^{ + } } \right)^{2} } $$(30.10)$$ S_{i}^{ - } = \sqrt {\mathop \sum \limits_{{j = 1}}^{n} \left( {\upsilon _{{ij}} - \upsilon_{j}^{ - } } \right)^{2} } $$(30.11) -
Step 6
Calculating the relative proximity of each alternative (wetland ecosystem) to the positive ideal solution
The below formula determines the relative closeness of the ith alternative:
$$ C_{i}^+ = S_{i}^{-} /\left( {S_{i}^{+} + S_{i}^{-} } \right) $$(30.12)where \( 0 \le C_{i}^{+} \le 1,\;\; i = 1,2, \ldots ,m \)
-
Step 7
Ordering the protection and restoration priority of wetland ecosystem
The order of wetland ecosystem protection and restoration priority is based on the relative proximity calculated in the previous step. The wetland ecosystems with a high priority will have higher Ci+values and are closer to the ideal positive solution. They are suitable and should be chosen. The orders in this step are assigned to the wetland ecosystem data layer to present the wetland ecosystem protection and restoration priority map.
30.3 Results and Discussion
30.3.1 Defining Dong Thap Muoi’s Wetland Ecosystems Protection and Restoration Criteria
The selected objectives and criteria for assessing the wetland ecosystems protection and restoration priority of Dong Thap Muoi region are proposed based on synthesising the collected documents, research, and interviewed local people and managers about the natural, social-economic, ecological conditions, master plan, planning, plan. After considering all interviews and available data of Tram Chim National Park (TC), Lang Sen Wetland Reserve (LS), Dong Thap Muoi Ecological Reserve (DTME), Xeo Quyt relic site (XQ), Gao Giong eco-tourism area (GG), Dong Thap Muoi medicinal plant conservation area (DTMM), Tan Lap floating village tourist site, Dong Sen Go Thap ecological area (DSGT), the authors decided to select objectives and criteria that are protecting and restoring the cultural and supporting services. The criteria are listed in Table 30.3.
30.3.2 Creating Wetland Ecosystems Map
The wetland ecosystems map is inherited from previous research (Thuy 2020), which was established using seven thematic landscape ecology data: geology, topography and geomorphology, hydrology, bio-climate, soil, vegetation cover, and land use. The Landsat satellite images were used to correct the vegetation cover and land use layers. The wetland ecosystems map is shown in Fig. 30.4.

Wetland ecosystems map (Thuy 2020)
30.3.3 Building Criteria Data Layers
The decreased vegetation cover area (PH1) is extracted and calculated using Landsat 7 and 8 imagery on 24/4/2010 and 15/11/2018. All of them are converted from the WGS-84 coordinate system to the VN2000 coordinate system. Landsat 7 images are filled gaps using the SCP tool of QGIS to fix scan line errors.
The criteria values of BV1, BV2, BV3, and PH2 are collected from papers, projects and field investigations. The livestock, industrial, and residential areas are extracted from the land-use map; the road network is derivated from the geodatabase at scales 1:2000 and 1:5000. Using ArcGIS 10.5 Euclidean Distance tool creates distance rasters of BV4, BV5, BV6, and BV7. The water salinity (BV8) layer referenced the data of saltwater intrusion in the state scientific project BĐKH.11/16-20 (Nghi et al. 2019).
The forest fire sensitivity (BV9) data layer is an algorithm of density (D), humidity (H), vegetation types (LC); land surface temperature (LST); distances from wetland ecosystems to water sources (WS), residential areas (RA), and roads (RO). The characteristic vegetation and land surface temperature rasters are achieved from satellite images; the water sources (hydrological network) are derivated from the geodatabase at scales 1:2000 and 1:5000; the distance rasters are done the same as BV4, BV5, BV6 and BV7. The fire sensitivity can be explained as below:
The forest fire sensitivity raster is compared with fire points data and inquired fire information, indicating the suitable fire happening in Dong Thap Muoi region.
The potential provision of tourism and entertainment service is counted through two parameters: the average number of tourists per year (BV10) and the average annual revenue from tourism (BV11). These data are collected, processed, and converted to the current time in 2018.
Surface water quality data (DO, COD, TSS) is defined based on regression Landsat 8 images (Band 1, 2, 3, and 5) and sampled data on 11/2018, in Dong Thap Muoi region.
All criteria layers will be spatialised and assigned to each wetland ecosystem using ArcGIS 10.5 software (Figs. 30.5, 30.6, 30.7, 30.8, 30.9, 30.10, 30.11 and 30.12).

Biodiversity data

Forest fire sensitivity data

Tourism and entertainment data

Surface water quality data

Distance from livestock areas

Distance from industrial areas

Distance from roads

Distance from residential areas
30.3.4 Ordering and Mapping Dong Thap Muoi’s Wetland Ecosystems Protection, Restoration Priority
The assigned data of 14 protection and restoration criteria in the wetland ecosystems map are exported by ArcGIS 10.5 tool to excel format to calculate and rank the priority protection and restoration of wetland ecosystems. The detailed data are shown in Tables 30.4 and 30.5.
This study determined the importance of each pair of all protection and restoration criteria based on surveys and interviews with experts who are managers and researchers in the fields of nature and biodiversity conservation, environment, land management, economy and society.
Protection and restoration criteria weights are calculated by the AHP method because they have CR < 0.1. Tables 30.6 and 30.7 show the results.
The weights of these criteria were also discussed and confirmed by many landscape ecological experts in three workshops.
The protection and restoration priority orders of 8 wetland ecosystems are computed by the TOPSIS method. The results are respectively shown in Tables 30.8 and 30.9.
The calculated orders are reassigned into the wetland ecosystem layer to establish the wetland ecosystem protection and restoration priority maps. The symbols are expressed in fractions \(\frac{8}{{{\text{Stx}} - {\text{M}}}}\), in which the numerator (8) is priority order, and the denominator is the ecosystems wetland sign names (Vietnam (Stx)—Ramsar (M)). These maps are shown in Figs. 30.13 and 30.14.

Wetland ecosystem protection priority map

Wetland ecosystem restoration priority map
30.3.5 Verifying and Discussing Results
In order to verify the accuracy of the results, the study: (i) Conducts a field investigation as interviews and surveys; (ii) Compares the results with information on planning and existing studies on these rated sites. Collected data for assessing wetland ecosystem protection and restoration priority are shown in Table 30.10.
Tram Chim’s biodiversity is the richest: (the total number of plants, birds, and fish is 667 species), 57 species are endangered and rare, but some of the invasive alien species are the largest (12). Therefore, the value of diversity and the pressure is also the largest. Tram Chim is also the area that meets 7 out of 9 Ramsar international convention standards on wetlands, recognised as the 2000th Ramsar site in the world, the 4th in Vietnam on May 22, 2012. In addition, Tram Chim also has an eco-tourism function with increasingly diverse forms, attracting a significant number of domestic tourists. In 2018, there were over 66,000 visitors with total revenue of over 6.7 billion VND. Therefore, it indicates that the research results that rank this area at the top regarding protection priority are entirely consistent with reality.
Tram Chim ranked first in the restoration priority because the number of Red-crowned Cranes has decreased from 1052 (in 1988) to 11 individuals (in 2018). The lack of food due to the shrinking and degradation of hemp grass area when the local government allows year-round water storage to prevent forest fires and convert the wetlands using the purpose of Melaleuca forest into agricultural land. Satellite data shows an increase in vegetation area of 383.75 ha, which can be explained by the growing area of Mimosa pigra trees. Overexploitation and tourism without reinvestment in planting and restoring Eleocharis ochrostachys grass is also a reason for the decline of cranes.
Lang Sen Wetland Reserve has the second protection and restoration priority order, consistent with the fact that data was collected, surveyed, interviewed, and extracted from satellite images. In terms of the total number of species, this is the area with the third highest biodiversity after Xeo Quyt relic site (382 compared to 389) but has 20 endangered and rare species, ranked 2nd after Tram Chim; there are three invasive alien species which is lower than 6 in Xeo Quyt. With the priority level of endangered and rare species protection, Lang Sen is appropriate, and this has also been proven when Lang Sen was recognised as the 2227th Ramsar site in the world and the 7th in Vietnam (27/11/2015). The number of Red-crowned Cranes in decline is 258, so a high restoration priority is appropriate.
In comparison with the total number of species, Xeo Quyt is the 5th; however, the number of endangered and rare species ranks the third, and the number of invasive alien species ranks the second. Therefore, the protection priority ranked 3/6 sites is consistent with the logic and criteria importance level. In terms of priority for restoration, Xeo Quyt is at a low priority because this area has the best surface water quality in the ranked areas and the reduced cover area is −24.30 ha (an increase of 24.3 ha compared to 2010).
Results were verified by the overall planning conservation of biodiversity in Dong Thap 2020, including Tram Chim, Gao Giong, Go Thap, Xeo Quyt are the areas prioritised for conservation (Dong Thap Department of Natural Resources and Environment 2020).
Tables 30.6 and 30.8 show the number of endangered and rare species, total species, the number of invasive alien species, and the distance from livestock areas to wetland regions significantly affect ranking wetland ecosystems protection priority. Tables 30.7 and 30.9 indicate that the loss number of endangered, rare animals and plants is the most considerable and following is decreased vegetation cover area effect on ordering wetland ecosystems restoration priority.
30.3.6 Solution
For such areas as Tram Chim, Lang Sen, Gao Giong, Dong Thap Muoi ecological reserve, Xeo Quyt, Dong Thap Muoi medicinal plants conservation, it is vital to improve and restore the habitat for grass species, especially for Eleocharis ochrostachys grass as this is the primary food source for the Red-Crowned crane. It is recommended to plant and protect the melaleuca forest system as a shelter and breeding ground for water birds. Consider keeping the water to prevent forest fires while maintaining and developing grassland ecosystems to attract birds, especially cranes. Having a suitable management mechanism to avoid converting natural land to agricultural production. Developing a mechanism for sustainable ecological and green economic development, combining conservation with tourism development to bring livelihoods and generate incomes to people, and involve them in protecting wetland ecosystems. In areas invaded by alien species, it is necessary to take measures to destroy and limit their spread and development, especially Mimosa pigra trees in Tram Chim. It is essential to further promote people’s education through local authorities’ propaganda and advocacy of protecting wetland ecosystems with specific policies for protection participants.
For areas with potential for eco-tourism development, such as Tan Lap, Gao Giong, and Xeo Quyt, it is necessary to have solutions to ensure economic development without affecting the ecological habitats of species. There should be a mechanism for reinvesting in improving the living environment, increasing the vegetation cover to attract animals, especially resident birds, to nest, lay, and live.
30.4 Conclusions
Proposing the method of mapping and ordering priority of wetland ecosystems protection and restoration based on the application of GIS, remote sensing, landscape ecology approach, and AHP is the basis for policymaking, environmental protection, and biodiversity conservation planning.
Experimental results show that the application of remote sensing and GIS in establishing, extracting, and modelling input data for assessment, ranking, and mapping protection and restoration of wetland ecosystems is entirely achievable. The results also are valuable in referencing documents and data for Dong Thap Muoi’s environmental protection and biodiversity conservation planning.
Besides, the proposed method also has some limitations. It requires having landscape ecological experts and much data to establish the wetland ecosystems map. The input data are often derivated from multiple sources, scales and times. Defining the criteria weights also demands expert and indigenous knowledge. Therefore, this method requires local managers and experts to define the criteria’ importance and use many techniques to process and normalise data to the same scale and time.
Change history
13 February 2023
In the original version of the book, the following belated correction have been incorporated: The author name “Thi Dinh” has been changed to “Thi Thanh Dinh” in the Chapter 30. The chapter and book have been updated with the change.
Notes
- 1.
Nhan, H.T.T., Hai, H.T.: Building biodiversity indicators for surveying the wetland ecosystems of Xuan Thuy national park, Nam Dinh province. The 5th National Scientific Conference on Ecology and Biological Resources, pp. 1498–1505. (in Vietnamese).
- 2.
Thuy, N.T.: Proposing the process of mapping inland wetlands. In: The 9th National Geography Conference, pp. 1097–1100. (Year) (in Vietnamese).
References
Chan HK, Sun X, Chung S-H (2019) When should fuzzy analytic hierarchy process be used instead of analytic hierarchy process? Decis Support Syst 125:113114
Cuong LD (2009) MCA for selecting solid waste burial sites. J Constr Plann 37:80–81 (in Vietnamese)
Dat LQ, Phuong BH, Thu NTP, Anh TTL (2017) Building an integrated multi-criteria decision-making model to select and analyse a group of green suppliers. VNU J Econ Bus 33:43–54 (in Vietnamese)
Dinh LC (2016) An integrated model of GIS and AHP-VIKOR in land adaptation assessment for sustainable land use management. J Sci Technol Dev 19:97–104 (in Vietnamese)
Dong Thap Department of Natural Resources and Environment (2018) Biodiversity conservation planning of Dong Thap to 2020 (in Vietnamese)
Duong NT (2009) Research on changes in landscape and biodiversity of coastal wetlands in Thai Binh, the orientation of regional use planning for sustainable development, vol Doctor. University of Science, Vietnam National University, Hanoi (in Vietnamese)
Environmental Law Institute (2013) A handbook for prioritizing wetland and stream restoration and protection using landscape analysis tools. Environmental Law Institute, Washington, D.C.
Government of the Socialist Republic of Vietnam (2019) Decree No. 37/2019/ND-CP detailing a number of articles of the law on planning, Hanoi (in Vietnamese)
Government of the Socialist Republic of Vietnam (2022) Decree No. 08/2022/ND-CP detailing a number of articles of the law on environmental protection, Hanoi (in Vietnamese)
Hai HT, Nhan HTT, Tuan TA (2015) Analysis of changes in space and time of wetland ecosystems in Xuan Thuy national park, Nam Dinh province using remote sensing and GIS techniques. J Biol 156–163 (in Vietnamese)
Hajkowicz S, Higgins A (2008) A comparison of multiple criteria analysis techniques for water resource management. Eur J Oper Res 184:255–265
Hang NTT (2012) Studying landscape structure for the spatial organisation, rational use of resources and environmental protection in Ninh Binh province with the help of remote sensing and GIS technologies, vol Doctor. University of Science, Vietnam National University, Hanoi (in Vietnamese)
https://baotainguyenmoitruong.vn/bao-ton-va-su-dung-ben-vung-cac-vung-dat-ngap-nuoc-298871.html
Huan NC (2005) Landscape assessment (according to the eco-economic approach). Vietnam National University Publisher, Hanoi (in Vietnamese)
Hung LV, Hoe ND (2014) Developing a set of criteria to identify key areas of interest in biodiversity conservation planning in Vietnam. J Biol 36:189–202 (in Vietnamese)
Huong BTT (2015) Proposing the grape planning areas to 2030 in Binh Thuan based on the integration of GIS and AHP. J Geodesy Cartography 35–39 (in Vietnamese)
Jiang W, Lv J, Wang C, Chen Z, Liu Y (2017) Marsh wetland degradation risk assessment and change analysis: a case study in the Zoige Plateau, China. Ecol Ind 82:316–326
Jozaghi A, Alizadeh B, Hatami M, Flood I, Khorrami M, Khodaei N, Ghasemi Tousi E (2018) A comparative study of the AHP and TOPSIS techniques for dam site selection using GIS: a case study of Sistan and Baluchestan Province, Iran. Geosciences 8
Kien NV, Thuy NT, Hoa PK, Manh ND, Thinh LC (2013) Proposing the process and symbology of wetland. Vietnam Institute of Geodesy and Cartography (in Vietnamese)
Lan PTN, Hai HT (2009) Some of the research results on indicators development for assessing the state and progress of the water environment and aquatic ecosystems downstream of the Tra Khuc River. J Water Resour Environ Eng 26:14–20 (in Vietnamese)
Linh NX, Khanh TV, Van HT, Duy NL, Hao VTK (2017) Application of GIS and F-AHP in assessing the rationality of planning location industrial park land in Hung Ha district, Thai Binh province. J Mar Sci Technol 166 (in Vietnamese)
Linh NHK, Ngoc NB, Mai NTH, Bao HN (2018) Building wetland database using remote sensing and GIS technologies in Duy Xuyen district, Quang Nam province. J Agric Rural Dev 95–103 (in Vietnamese)
Lopez R, Lyon J, Lyon L, Lopez D (2013) Wetland landscape characterization: practical tools, methods, and approaches for landscape ecology, 2nd edn
Luan PH, Tram LTT (2013) Combination of AHP, VIKOR and TOPSIS for selecting construction contractors. J Constr 12:84–87 (in Vietnamese)
Malekmohammadi B, Jahanishakib F (2017) Vulnerability assessment of wetland landscape ecosystem services using driver-pressure-state-impact-response (DPSIR) model. Ecol Ind 82:293–303
Malekmohammadi B, Rahimi Blouchi L (2014) Ecological risk assessment of wetland ecosystems using multi criteria decision making and geographic information system. Ecol Ind 41:133–144
Mekong River Commission (2017) Criteria and process of Wetland site selection for implementation of testing and improvement of WI and WEFASAM (including WBIA). Environmental Management Division
Ministry of Natural Resources and Environment (2021) Report of state of the national environment for the period 2016–2020. Dan Tri Publisher, Hanoi (in Vietnamese)
National Assembly of the Socialist Republic of Vietnam (2017) Law on planning. No. 21/2017/QH14, Hanoi (in Vietnamese)
National Assembly of the Socialist Republic of Vietnam (2020) Law on environmental protection. No. 72/2020/QH14, Hanoi (in Vietnamese)
Nghi VV, Hai HQ, Nga DTT, Hung BV, Khoi DN, Hien LTT, Lam DT, Dung DD, Huy NV, Hai TX (2019) The national-level project, code CC.11/16–20: research on solutions for planning Dong Thap Muoi region becomes Cuu Long Delta’s freshwater storage to adapt to climate change. Southern Institute of Water Resources Planning (in Vietnamese)
Nguyen PH, Hai TQ, Son LK (2015) Assessment of ecological adaptation for economic development and mangrove conservation in the cape Ca Mau area. Sci J Vietnam Nat Univ Hanoi: Earth Environ Sci 4:29–40 (in Vietnamese)
Nhan HTT (2010) Researching, building a number of parameters, processes for biodiversity observation. Vietnam Environment Administration (in Vietnamese)
Nhan HTT (2014) Scientific and technological research project: researching scientific and practical foundation for the formulation of biodiversity conservation strategy up to 2020 in line with Vietnam’s sustainable development orientation. Biodiversity Conservation Department (in Vietnamese)
Opricovic S, Tzeng G-H (2004) Compromise solution by MCDM methods: a comparative analysis of VIKOR and TOPSIS. Eur J Oper Res 156:445–455
Phu H (2009) Research on ecological zoning for aquaculture in Dong Thap province for exploitation and sustainable use of natural resources. J Water Resour Environ Eng 26:10–16 (in Vietnamese)
Phuong BT, Hoe VT (2015) Application for remote sensing and GIS in mapping wetland. J Nat Resour Environ 24–26 (in Vietnamese)
Phuong NV, Mai DT (2018) Application of GIS and AHP for establishing the map of key forest fire areas in Dong Hoi city, Quang Binh province. J Agric Rural Dev 126–131 (in Vietnamese)
Prime Minister of the Socialist Republic of Vietnam (2022) Decision No. 149/QĐ-TTg dated January 28, 2022, of the Prime Minister approving the national strategy on biodiversity to 2030, vision to 2050, Hanoi (in Vietnamese)
Ramsar Convention Secretariat (2013a) The Ramsar convention manual: a guide to the convention on wetlands (Ramsar, Iran, 1971), Gland, Switzerland
Ramsar Convention Secretariat (2013b) Information sheet on Ramsar wetlands (RIS) 2009–2014 version, Gland, Switzerland
Saaty TL (1980) Tha analytic hierarchy process. McGraw-Hill, Inc.
Sarkar S, Parihar SM, Dutta A (2016) Fuzzy risk assessment modelling of East Kolkata wetland area: a remote sensing and GIS based approach. Environ Model Softw 75:105–118
Son TPH (2008) Report on the scientific and technological research project “Investigation of the current status of distribution of coral reef ecosystems in coastal waters of Khanh Hoa province as a basis for planning protection, restoration and use lasting”. Institute of Oceanography (in Vietnamese)
Thuy NT (2020) Landscape approach—based wetland ecosystem mapping for Dong Thap Muoi region at 1:100,000 scale. J Geodesy Cartography 9–15 (in Vietnamese)
Tin HC, Phap TT, Tuan NQ (2011) Application of remote sensing and GIS technologies in assessing the status of seagrass beds in wetlands Huong Phong commune, Huong Tra district, Thua Thien Hue province. Hue Univ J Sci (in Vietnamese)
Tudor C (2014) An approach to landscape character assessment. Natural England, England
Ve ND, Lan TD, Thao NV (2013) Building the distribution of coastal ecosystems in Thanh Hoa province (Project: Building marine natural resources and environmental database of Thanh Hoa province). Institute of Marine Environment and Resources (in Vietnamese)
Velasquez M, Hester PT (2013) An analysis of multi-criteria decision making methods. Int J Oper Res 10:56–66
Vietnam Environment Administration (2011) Investigating, assessing the situation of planning and coastal wetland use and proposing planning orientations for protecting the environment and preventing disaster. Vietnam Environment Administration (in Vietnamese)
Vietnam Environmental Protection Department (2005) Overview of the status of Vietnam’s wetland after 15 years of implementing the Ramsar convention, Hanoi, pp 72 (in Vietnamese)
Vietnam Institute of Geodesy and Cartography (2012) Surveying, measuring and establishing all kinds of maps for zoning for conservation and sustainable development of Dong Thap Muoi wetlands. Vietnam Institute of Geodesy and Cartography (in Vietnamese)
Vietnam Institute of Geodesy and Cartography (2018) Surveying, measuring and establishing all kinds of maps for zoning for conservation and sustainable development of Ca Mau peninsula. Vietnam Institute of Geodesy and Cartography (in Vietnamese)
Vietnam Institute of Geodesy and Cartography (2020) Surveying, establishing all kinds of maps to serve the building of a database for management, conservation and sustainable development of wetlands in the Long Xuyen Quadrangle. Vietnam Institute of Geodesy and Cartography (in Vietnamese)
Xuan NT, Hoa DTB (2015) Assessment of wetland changes for the development of multi-benefit solutions for sustainable use of wetland resources in Quang Yen town, Quang Ninh province with the support of remote sensing and GIS. J Geodesy Cartography 24–31 (in Vietnamese)
Yet NH, Ken LV, Hanh TD, Thu NT, Thung DC, Huong TTL, Quan NV, Tien DD (2010) Assessment of the degradation of coastal ecosystems in Vietnam Nam and propose sustainable management solutions. State-level project KC.09.26/06-10. Vietnam Institute of Science and Technology (in Vietnamese)
Acknowledgements
This study is within the framework of the project “Application GIS, remote sensing and landscape analysis tools for establishing zoning map of wetland ecosystems protection and restoration prioritisation (Case study in Dong Thap Muoi)”, Vietnam Institute of Geodesy and Cartography, 2017–2020.
Author information
Authors and Affiliations
Corresponding author
Editor information
Editors and Affiliations
Rights and permissions
Copyright information
© 2023 The Author(s), under exclusive license to Springer Nature Switzerland AG
About this paper

Cite this paper
Nguyen, P.S., Nguyen, T.T., Dinh, T.T., Vu, T.H., Nguyen, T.T.H., Le, L. (2023). Mapping Wetland Ecosystems Protection and Restoration Priority Using GIS, Remote Sensing, Landscape Ecology, and Multi-criteria Analysis (Case Study in Dong Thap Muoi). In: Vo, P.L., Tran, D.A., Pham, T.L., Le Thi Thu, H., Nguyen Viet, N. (eds) Advances in Research on Water Resources and Environmental Systems. GTER 2022. Environmental Science and Engineering. Springer, Cham. https://doi.org/10.1007/978-3-031-17808-5_30
Download citation
DOI: https://doi.org/10.1007/978-3-031-17808-5_30
Published:
Publisher Name: Springer, Cham
Print ISBN: 978-3-031-17807-8
Online ISBN: 978-3-031-17808-5
eBook Packages: Earth and Environmental ScienceEarth and Environmental Science (R0)