
Abstract
Spillway is a hydraulic structure that is usually provided in dams to release surplus flood water that cannot be safely stored in the reservoir in order to prevent damage to the dam. In earthen dam if geological site for the spillway is not suitable in river gorge, then a spillway is provided at a suitable site which may be away from the river gorge. In such situation, a separate appurtenant structures are required to connect the spillway and the earthen dam. Guide walls are provided to connect the spillway with earthen dam. Suitable design of the guide wall is a key factor so as to guide the flow smoothly from river gorge for acceptable approach flow conditions in front of spillway. Jigaon Project is one of the major irrigation project under construction on River Purna of Maharashtra comprising of of 8.24 km long and 35.245 m high earthen dam. Hydraulic model studies for the original design of this project were conducted on 1:100 scale 3-D comprehensive model at CWPRS for evolving the optimum design of spillway with guide walls and to assess the performance of spillway. CWPRS conducted various alternatives to optimize the design of guide walls so that the approach flow conditions for the end spans could be improved. This paper is focused on original design as well as various alternatives for alignment of guide walls suggested by CWPRS to optimise the design of guide walls. CFD software, Flow 3D incorporating RNG turbulence model is used for numerical simulation. The results obtained from the physical model studies have been used for numerical validation.
Access provided by Autonomous University of Puebla. Download chapter PDF
Keywords
1 Introduction
In earthen dam if geological site for the spillway is not suitable in river gorge, then a spillway is provided at a suitable site which may be away from the river gorge. In such situation, a separate appurtenant structures are required to connect the spillway and the earthen dam. Guide walls are provided to connect the spillway with earthen dam. Suitable design of the guide wall is a key factor so as to guide the flow smoothly from river gorge for acceptable approach flow conditions in front of spillway. If guide walls are not aligned properly, they lead to adverse approach flow conditions, which in turn cause intermixing of flow, due to abrupt change in the direction of flow near the guide wall and the formation of eddies resulting in reduced discharging capacity of spillway. Therefore, proper alignment of guide wall is very important for proper approach flow condition in front of spillway.
Jigaon Project is one of the major irrigation project under construction on River Purna of Maharashtra comprising of of 8.24 km long and 35.245 m high earthen dam. The spillway consists of 16 spans of size 15 m (W) × 12 m (H) with radial gates to pass the maximum outflow flood of 24,131 m3/s. The equation for the ogee spillway is y = 0.0708 × 1.763. The MWL, FRL and MDDL have been fixed at El. 240.561 m, 239.21 m and 233 m respectively. The energy dissipator is in the form of stilling basin of length 10 m at El. 211.6 m. Hydraulic model studies for the original design of this project were conducted on 1:100 scale 3-D comprehensive model at CWPRS for evolving the optimum design of spillway with guide walls and to assess the performance of spillway in respect of discharging capacity, water & pressure profiles and performance of stilling basin provided as energy dissipator. Main objective of this paper is to simulate approach flow conditions in front of spillway with proper alignment of guide wall. Numerical studies carried out using Flow 3D software and results are compared with physical model studies.
1.1 Physical Model
Hydraulic model studies were conducted at CWPRS by constructing a 3-D comprehensive model of 1:100 geometrically similar scale. Upstream river reach of about 900 m and downstream reach of 3.5 km from dam axis has been reproduced in the model. For hydrostatic pressure measurement, piezometers along the centre of span and side of pier were provided on the spillway surface up to endsill. The model was equipped with suitable inlet and outlet arrangements to measure various discharges with corresponding reservoir water levels, tail water levels and velocities (CWPRS 2017a, b). Figures 1 and 2 show general layout plan and section of the spillway respectively.

General layout plan

Section of the spillway
2 Numerical Model
In the field of numerical simulation, the governing equations of the flow which are usually Navier–Stokes equations together with turbulence models are solved with powerful numerical methods such as finite volume and finite elements (Parsaie et al. 2015). Several turbulence models have been proposed for solving the turbulent flow. In this regard the K-epsilon, RNG K-epsilon and large eddy simulation (LES) are the advanced turbulence models that recently have been widely used in the hydraulic engineering (Versteeg and Malalasekera 2007). Several commercial software and open source codes have been proposed for comfortable use of the numerical modeling in the hydraulic engineering studies. In this regard, the commercial software Flow-3D, developed by Flow Science, is used for the numerical modeling of the flow. Numerical modeling of turbulent flow over hydraulic structures helps to define flow properties including velocity and pressure distribution through the structure. In addition to define hydraulic characteristics, numerical models have high ability to show the flow pattern which is also an important flow property. Physical model dimensions were used to generate the computational domain geometry. After the .stl file is imported into Flow 3D, the geometry of spillway is embedded in the computational grid by the pre-processor using the FAVOR concept (Hirt and Sicilian 1985). In Flow 3D, grid generation is the most important issue for accurate solution. If good quality of mesh is generated, one can obtain realistic results from the numerical model. Flow 3D uses a grid system of orthogonal meshes in the Cartesian or cylindrical coordinates. Cartesian coordinate system is selected for this investigation. The flow region is subdivided into a mesh of fixed rectangular cells. The grid generation does not depend on the geometry. That is, the geometry in the domain is represented in a simple and proper way without requiring a body fitted grid system so that the geometry and grid generation are independent of each other. A uniform mesh is used for the first simulation trial, as it took more computational time non-uniform mesh system was generated for other trials in order to provide more grid refinement close to the block of spillway. For non-uniform mesh system, there are some advices in Flow 3D Users Manuel in order to generate an appropriate grid. The most significant issue is to avoid large differences in sizes between adjacent cells. The size ratio between adjacent cells should be as close to unity as possible, and not exceed 1.25 for efficient results. Hence In the upstream domain 16 lakh no. of cells were provided whereas in the spillway domain fine mesh with 32 lakh no. of cells were provided and in the downstream coarse mesh with 8 lakh of cells were provided to optimize the use of computational resources and time. In this paper, physical modeling data was used for numerical simulation for finding an optimal shape for the guide wall which removes the cross waves in the maximum flood design.
3-D Computational domain geometry was generated in AutoCAD software. Physical model dimensions were used to generate the computational domain geometry. Numerical simulations were carried out to study approach flow condition in front of spillway for the design discharge of 24,131 m3/s at ungated operation of spillway. While conducting simulation, upstream boundary was set as a Volume Flow Rate for the design discharge of 24,131 m3/s for ungated operation of spillway and downstream boundary as a pressure outlet. The extent of the mesh in the upstream X-direction was adjusted until any further increases had negligible effect on the discharge. Numbers of probes were provided at different locations for observing different parameters of the flow such as surface velocity and free surface elevation. Baffles were provided at the inlet and outlet boundary to observe the discharge passed through the spillway. The simulation was conducted upto 50 s which was found to be enough for flow stabilisation. Figure 3 shows numerical model setup in Flow -3D for Jigaon dam spillway for original design.

Numerical model setup in flow-3D for Jigaon dam spillway for original design
2.1 Comparison of Numerical Model Results with Physical Model Results for Original Design of Spillway
Studies were conducted on both physical and numerical modeling on the original design and modified design of the spillway, for the condition of the design discharge of 24,131 m3/s for ungated operation of spillway. The results obtained from the numerical simulation were compared with the physical model studies result for the conditions as given below.
2.2 Flow Conditions Over the Spillway for Fully Open Gate Operation
Studies were conducted for discharging capacity of spillway for entire range of discharges for ungated operation of spillway for all the spans. It was observed that a discharge of 24,131 m3/s could be passed at RWL El. 240.49 m. Flow conditions at the upstream and downstream of spillway were observed for ungated operation of spillway for the design discharge of 24,131 m3/s. The approach flow conditions upstream of spillway were found to be tranquil in front of all the spans except end spans. However, the flow in the reservoir entering the approach channel falls directly in front of 1st and the 16th span, thereby causing intermixing of flow due to sudden change in the direction of flow. This occasional touching of trunnion of 1st and the 16th span is due to unguided flow along the approach channel in the 1st and the 16th span for the entire range of discharges up to design outflow flood of 24,131 m3/s. Therefore, it was suggested to provide curved guide walls to improve the approach flow conditions in front of end spans. Photos 1 and 2 show the upstream view of physical model, upstream flow condition of spillway for design discharge of 24,131 m3/s for ungated operation of spillway respectively. Numerical studies were carried out for the discharge of 24,131 m3/s at ungated condition. It shows close agreement of numerical simulation with the physical model studies. Photo 3 and Fig. 4 shows the upstream flow condition depicting the intermixing of flow due to abrupt change in the direction of flow for the discharge of 24,131 m3/s for ungated operation of spillway at ungated condition in the physical model studies and numerical simulation respectively.

Upstream view of physical model
2.3 Velocity in the Upstream of the Spillway for Fully Open Gate Operation
The flow in the reservoir entering the approach channel falls directly over the upstream left and right training wall in front of 1st and the 16th span, resulting in intermixing of flow due to abrupt change in the direction of flow. Therefore the velocities in the approach channel at which intermixing of flow observed were found to be very high specifically in front of 1st span of spillway at chainage 50 m in the upstream from dam axis. This velocity was observed in the range 11.3–12.3 m/s for ungated operation of spillway for design discharge of 24,131 m3/s. In Numerical simulation velocities were find out with the help of probes. Positions of the Probes were kept at the same locations where intermixing of flow observed in the physical model. As compared the numerical results with the physical model results it shows the close agreement. Table 1 shows the comparison of surface velocities obtained from the physical model study and numerical model study in front of the spillway at which intermixing of flow observed for the design discharge of 24,131 m3/s at ungated operation of spillway.
3 Revised Design of Spillway
Taking the due cognizance of the result of the model studies, 1:100 scale geometrically similar 3-D comprehensive model was modified incorporating revised length of stilling basin, curved guide walls, submersible divide walls, training walls and tail channel. This paper is focused on performance of guide wall for the design discharge of 24,131 m3/s at ungated operation of the spillway with various alternatives for the alignment of guide walls suggested by CWPRS to optimise the design of guide walls as given below:
-
1.
Sloping guide wall with straight length of 40 m from dam axis with top at El. 244.955 m and further providing curvature with a radius of 80.67 m which was sloping linearly with a slope of 1(V): 4 (H) was provided as shown in Photo 4a. it was observed that the flow in the reservoir entering the approach channel cause mild circulation in front of the spans 1–5 for the discharge above 15,642.59 m3/s (Inglis flood) as shown in Photo 4b
-
2.
As the performance sloping guide wall was not satisfactory guide wall was provided as curved guide wall with full curve height upto dam top El. 244.955 m as shown in Photo 5. It was observed that the flow in the reservoir entering the approach channel was tranquil and no circulations were observed as shown in Photo 6. Performance of the curved guide wall was also observed in the numerical simulation. In physical model studies all the modification regarding guide wall were done in left guide wall and similar modifications were consider for right guide wall. In numerical simulation left as well as right curved guide wall were reproduced. From the numerical simulation results the improvement in the approach flow condition were observed. As compared the numerical results with the physical model results it shows the close agreement. Figures 5 and 6 shows the geometry of the curved guide wall and flow conditions of the curved guide wall in numerical model respectively.
Photo 2 
Upstream flow condition of spillway for Q = 24,131 m3/s for ungated operation of spillway
Photo 3 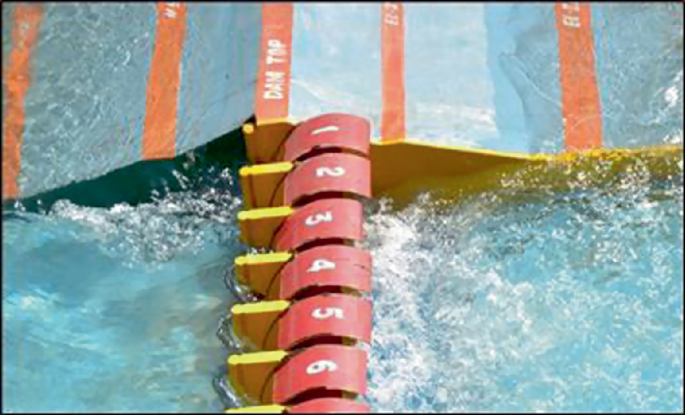
Intermixing of flow due to abrupt change in the direction of flow for Q = 24,131 m3/s for ungated operation of spillway
Fig. 4 
Upstream flow conditions for fully open gate condition of spillway at Q = 24,131 m3/s in numerical simulation
Photo 4 
a View of the model for curved guide wall with slope 1(V): 4(H), b flow condition near the upstream curved guide walls
Photo 5 
Modified upstream curved guide wall with full curve height upto dam Top El. 244.955 m
Photo 6 
Flow conditions after modifying upstream curved guide wall with full curve height upto dam Top El. 244.955 m
Fig. 5 
Geometry of the modified upstream curved guide wall with full curve height upto dam top El. 244.955 m
Fig. 6 
Flow conditions of the curved guide wall in numerical model


4 Conclusions
Model studies of the original design of spillway with guide walls indicated that flow conditions in front of the spillway are not satisfactory as the flow in the reservoir entering the approach channel falls directly over the upstream left and right training wall in front of 1st and the 16th span, resulting in intermixing of flow due to abrupt change in the direction of flow. To optimise the design of guide walls model studies with various alternatives for alignment of guide walls are carried at CWPRS. From the model studies it is observed that upstream curved guide wall for full curve height upto dam top El. 244.955 m is acceptable as the flow in the reservoir entering the approach channel is tranquil and no circulations are observed. It is suggested from the project authorities that the provision of full curve height guide wall would be uneconomical and occurrence of the discharge above 15,642.59 m3/s would be rare. Therefore, the upstream curve guide wall with slope of 1(V): 4 (H) would be acceptable. Thus, the model studies played an important role in enhancing the overall performance of spillway with guide wall and energy dissipator arrangement which will ultimately help the project in achieving a techno-economic design of spillway. With the physical model studies, numerical simulation is also used as a complementary tool for assessing the hydraulic performance of structures. Utmost expertise is necessary for analysis and interpretation of the results of numerical simulation.
References
Computational Fluid Dynamics Software—Flow 3D from Flow Science, CFD. www.flow3d.com
CWPRS Technical Report No. 5491 (2017a) Hydraulic model studies for Jigaon Dam Spillway, Maharashtra. 1:100 Scale 3-D comprehensive model
CWPRS Technical Report No. 5539 (2017b) Hydraulic model studies for the revised design of Jigaon Dam Spillway, Maharashtra. 1:100 Scale 3-D comprehensive model
Hirt CW, Sicilian JM (1985) A porosity technique for the definition of obstacles in rectangular cell meshes. In: Proceedings 4th international conference Ship Hydro, National Academy of Science, Washington, DC, September, pp 1–19 (1985)
Parsaie A, Haghiabi A, Moradinejad A (2015) CFD modeling of flow pattern in spillway’s approach channel. Sustain Water Resour Manag 1(3):245–251
Rodi W (1993) Turbulence models and their application in hydraulics. Taylor & Francis
Versteeg HK, Malalasekera W (2007) An introduction to computational fluid dynamics: the finite volume method. Pearson Education Limited
Acknowledgements
The authors are thankful to the project engineers from Jigaon Project Maharashtra and design engineers from CDO, Nashikfor constant interaction during the course of studies. The help of all the staff in conducting the studies and compiling the data is gratefully acknowledged.
Author information
Authors and Affiliations
Corresponding author
Editor information
Editors and Affiliations
Rights and permissions
Copyright information
© 2022 The Author(s), under exclusive license to Springer Nature Switzerland AG
About this chapter

Cite this chapter
Gadhe, V.P., Patnaik, S.R., Bhajantri, M.R., Bhosekar, V.V. (2022). Physical and Numerical Modeling of Flow Pattern Near Upstream Guide Wall of Jigaon Dam Spillway, Maharashtra. In: Jha, R., Singh, V.P., Singh, V., Roy, L., Thendiyath, R. (eds) River and Coastal Engineering. Water Science and Technology Library, vol 117. Springer, Cham. https://doi.org/10.1007/978-3-031-05057-2_21
Download citation
DOI: https://doi.org/10.1007/978-3-031-05057-2_21
Published:
Publisher Name: Springer, Cham
Print ISBN: 978-3-031-05056-5
Online ISBN: 978-3-031-05057-2
eBook Packages: Earth and Environmental ScienceEarth and Environmental Science (R0)