
What You Will Learn in This Chapter
Live-cell imaging is perhaps one of the most exciting and challenging activities in the field of microscopy. It is exciting as recent developments in microscope technology have enabled scientists to visualize cellular and subcellular processes in real time down to the molecular level. With this comes the prospect of studying the mechanisms of diseases in greater detail and finding possible therapeutic solutions. Nevertheless, live-cell imaging is equally challenging because cells themselves and in fact—all cellular processes—are extremely sensitive to the very impact of using light for their visualization. The aim of this chapter is to provide a practical overview for early PhD students as well as more experienced post-docs, who will spend considerable time mastering the most important challenges and prerequisites in the very rapidly evolving field of live-cell microscopy.
“In honour of Professor Anirban Banerjee, who taught us the wonders of observing living cells…”
Access provided by Autonomous University of Puebla. Download chapter PDF
Keywords
FormalPara What You Will Learn in This ChapterLive-cell imaging is perhaps one of the most exciting and challenging activities in the field of microscopy. It is exciting as recent developments in microscope technology have enabled scientists to visualize cellular and subcellular processes in real time down to the molecular level. With this comes the prospect of studying the mechanisms of diseases in greater detail and finding possible therapeutic solutions. Nevertheless, live-cell imaging is equally challenging because cells themselves and in fact—all cellular processes—are extremely sensitive to the very impact of using light for their visualization. The aim of this chapter is to provide a practical overview for early PhD students as well as more experienced post-docs, who will spend considerable time mastering the most important challenges and prerequisites in the very rapidly evolving field of live-cell microscopy.
6.1 Essentials in Live-Cell Imaging
Modern live-cell microscopy encompasses methods ranging from transmitted light microscopy, wide-field epifluorescence microscopy, confocal scanning laser microscopy, multiphoton- and spinning disk confocal microscopy, to super-resolution microscopy, structured illumination microscopy as well as single-molecule localization microscopy and light-sheet microscopy (Chap. 3, 5, 6–9, and 11–13). These microscopy modalities can be performed on different dedicated microscope systems, but—more often today—can also be performed on the same, high-end microscope platform, and will thus strongly rely on a similar set of basic optical and mechanical components. As mentioned earlier, live-cell imaging provides scientists with the unique ability to study cellular dynamics and function in great detail and in real time. Therefore, it is of paramount importance to ensure cell viability and to confirm that physiological and biological processes—that are under investigation—are not altered in any (significant) way. Consequently, the three main experimental challenges in acquiring live-cell imaging data are: (i) to minimize photodamage, while retaining a useful signal-to-noise ratio; (ii) to provide a stable environment for cells (or multicellular preparations), in order to be able to replicate physiological cell dynamics; and last but not least (iii) to prevent focal drift.
6.1.1 The Problem of Phototoxicity
Most cells and tissues are never exposed to light during their normal life cycle, so live-cell microscopy is always a compromise between collecting enough photons while minimizing phototoxicity. While UV light is known to cause DNA damage [1], focused infrared (IR) light can cause localized heating and thereby excite fluorescent molecules to react with molecular oxygen, to produce reactive oxygen species and free radicals [2,3,4]. The latter in turn may interact with surrounding sub-cellular components resulting in cellular oxidative damage. Consequently, it is imperative to minimize light exposure by reducing light intensity, decreasing exposure time (which can be achieved using more sensitive detectors), and to shorten software overhead time by hardware triggering. In addition, reactive oxygen species scavengers, such as oxyrase or oxyfluor, have also been used to prevent photobleaching during live-cell recordings [5,6,7]. From a physiological perspective, however, it is probably best to minimize the deleterious effects of unnecessary light exposure in the first place. More about the effect of phototoxicity and a practical approach of how to avoid it is revealed in Experimental Boxes 6.1 and 6.2, respectively.
6.1.2 The Problem of Creating a Stable Environment
6.1.2.1 Laboratory Environment Conditions
While choosing a room for performing live-cell imaging experiments, it is advisable to allow enough space around the microscope for proper ventilation and access to cleaning as well as to reduce dust levels that can damage optical and electronic parts of the microscope (e.g., by installing HEPA filters). Additionally, to minimize cellular contamination by microorganisms it is important to wipe the microscope stage area and surrounding space with 70% ethanol periodically. To minimize mechanical vibrations due to environmental factors microscopes should not be exposed to air vents, air conditioners, or housed in the same room as a refrigerator. Furthermore, microscopes should be placed on gas-filled vibration isolation tables or low-cost vibration isolation pads.
6.1.2.2 Stable Live-Cell Incubation Conditions on the Microscope
In order to successfully image cellular dynamics in living cells, it is critical to maintain cells in a physiologically healthy and stable state. Some of the key factors of the cellular environment that definitely must be controlled are temperature, pH, osmolarity (by preventing evaporation of the cellular media).
6.1.2.3 Temperature
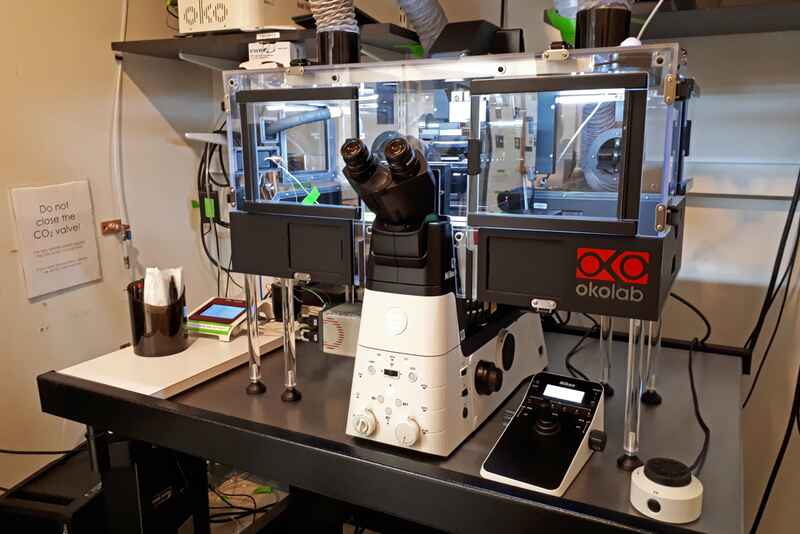
Incubators can be open systems, stage top, or cage type. Open environmental systems are useful for short-term live-cell experiments that require patch clamp or microinjections; however, for longer time-lapses, this system is impossible to keep sterile. For dedicated live-cell imaging, custom-made, fully climate-controlled boxes (made of Plexiglas) should enclose the entire microscope. These can also be linked to a tissue culture incubator on the microscope. Full enclosures provide superior thermal stability, but can also be difficult to work in. Fortunately, recent designs are becoming more compact (see Figs. 6.1 and 6.2).

Oko-lab cage incubator enclosure on a Ti2-E for live-cell inverted widefield system in Nikon Imaging Center at Harvard Medical School. (Source: https://d33b8x22mym97j.cloudfront.net/production/imager/productphotos/NIC-Systems/7182/Harvard-Live-Cell2_d5bf01b6690ca8c589d10eb51a9ecfd9.jpg). (Reproduced with permission)

Oko-lab stage-top incubator on a Nikon Ti microscope stage. Humidified 5% CO2 enters from the insulated tube from the left. (Source: http://nic.ucsf.edu/blog/2014/04/okolab-incubators). (Reproduced with permission)
Stage-top incubators are available in diverse designs from manufacturers such as Tokai Hit and Okolab among others. These chambers combine temperature and gas control as well as options for media perfusion and electrophysiology.
6.1.2.4 Osmolarity
Osmolarity is maintained by preventing evaporation of sample medium. Full enclosures and stage-top incubators often use pre-mixed CO2 that is bubbled through water to humidify the environment over the sample. For cage-type incubators humidification is limited over the specimen area to prevent damage to other mechanical parts of the microscope.
6.1.3 The Problem of Focal Drift
6.1.3.1 Focus Drift
The term focus drift is often used to describe the inability of a microscope to maintain the selected focal plane over an extended period of time. This artifact occurs independently of the natural motion in living specimens and is primarily affected by changes in air and microscope temperature. Therefore, microscopes should be kept away from air conditioning and/or heating vents. In addition, heated objective collars are essential when immersion objectives are used, since the objective acts as a heat sink. In general, focus drift is more a problem when using high magnification and numerical oil immersion objectives (having a very shallow depth of focus) than it is for lower magnification objectives with wider focal depths (10× and 20×).
Experimental Box 6.1 Monitoring Cellular Events Under the Microscope: Timeline and Cell Health
Timeline of Cellular Events (Fig. 6.3 )

(a) Estimated timeline of the main cellular processes monitored in cells, cell cultures, and tissues; (b) 2D spider charts of the labelled cellular processes (indicated by colored dots in panel a). The logarithmic scales demonstrate the values of different technical necessities, increasingly from the center to the edges in the graph. (Reproduced with permission)
Monitoring Cell Health Under the Microscope
Long time-lapses must be carefully observed for declining cell health due to photo toxicity to ensure data is collected from physiologically normal cells. Cell morphology can be easily monitored with transmitted illumination methods to assess cells that are stressed, dying, or dead. Common visual symptoms are blebbing, vacuole formation, detachment from substrate, enlarged mitochondria or broken mitochondrial network, and finally necrosis (Fig. 6.4).

Visual symptoms of unhealthy cells: clustering of fluorescent protein is also a common indicator of stress. (Source: https://www.microscopyu.com/applications/live-cell-imaging/maintaining-live-cells-on-the-microscope-stage). (Reproduced with permission)
6.2 Microscope Components and Key Requirements for Live-Cell Imaging
This paragraph provides a brief overview of the most essential parts and accessories of modern microscope platforms that are needed to successfully implement live-cell microscopy in laboratories.
6.2.1 Upright or Inverted Microscopes
The choice between upright and inverted microscopes depends on the type of specimen being imaged. When whole animals such as mice, drosophila are imaged upright stands are essential for accessing the regions of interest. However, for cellular imaging, inverted microscopes are particularly useful as it is easier to image specimens in culture medium except for patch clamping and other physiological experiments. The availability of hardware-based Z-drift control, such as Nikon’s Perfect Focus System (PFS), is currently limited to inverted microscopes, which is a strong reason why inverted systems are preferred over upright scopes. Both Inverted and upright microscope bodies are manufactured by all four main microscope manufacturers Leica, Nikon, Olympus, and Zeiss.
6.2.2 Microscope Components and Key Requirements for Live-Cell Imaging
6.2.2.1 Motorized Stage
Multipoint acquisition allows parallel data collection from multiple regions, which is especially important for long-term, live-cell imaging time-lapse experiments, monitoring multiple points of interest over time. The travel range of a typical motorized stage is 2 to 4 inches in both the X- and Y-direction. Linear encoder-equipped motorized stages use optical sensors to determine the position of the stage independent of stepper motors and demonstrate high accuracy of repeatability in the order of hundreds of nanometers. With microscopy evolving into nanoscopy, piezo nano-positioning stages are becoming essential for maintaining stability, nanometer precision, and speed. Applied Scientific Instruments, Physiks Instruments, Mad City Labs, Thorlabs and Prior among others manufacture piezo-controlled microscope stages.
6.2.2.2 Z-axis Control
In order to collect 3D image stacks in the Z-axis, motorized stepper focusing devices that drive either the entire nosepiece with objective(s) or the microscope stage itself, are available from all four major microscope manufacturers. Stepper motors have a long travelling distance, which allows for control over the entire size of the Z-image stacks. However, they are slower than piezo-electric Z-controllers. Therefore, it is recommended to use piezo-electric Z-drives for fast and precise 3D (volume) acquisition. On the other hand, the travelling distance for piezo-electric Z-drives is limited to 100–200 μm. For upright microscopes, it is also possible to use a piezo objective scanner for performing fast Z-stack acquisitions with nanometer precision.
6.2.2.3 Hardware-Based Autofocus
As mentioned before, focus drift is a major problem in live-cell imaging. Microscopes are subject to both thermal and mechanical drift. Thermal gradients and mechanical drift are primarily responsible for the progressive loss of focus in the Z-axial plane, which becomes a confounding problem, especially during long-term live-cell imaging. In order to specifically address this problem, a hardware-based autofocus system using a NIR-(LED)-light was first introduced by Nikon (Fig. 6.5). It is important to note that NIR-light does not interfere with most transmitted or fluorescent live-cell applications and does not contribute to photobleaching or phototoxicity.

Nikon imaging and Perfect Focus optical train side by side. Boxed region illustrates PFS optical path diagram. In brief, it uses a near IR laser or LED-based system in conjunction with a CCD image detection sensor and offset adjustment lens system to track the reflection from sample-coverslip interface and uses the drift from this reflection as feedback for the motorized Z-drive. The visible and IR filters prevent contaminating light from their respective imaging systems (imaging and PFS) interfere with each other. (Source: www.microscopyu.com) (Reproduced with permission)
6.2.2.4 Illumination Device
Traditionally, light sources for fluorescent microscopes were based on Mercury or Xenon-based arc lamps. Mercury arc lamps produce high levels of UV light, whereas Xenon lamps have peaks in the near IR region, and it is, therefore, advisable to use them with a near-IR filter. However, because of their limited lifespan (~200 h) and inconsistent brightness, they have been replaced by metal halides, where the light is delivered by using a liquid light guide. These metal halide bulbs are more endurable and produce more consistent illumination over time. Metal halides have similar spectral lines as mercury. To minimize phototoxicity, neutral density filters are used for lamp illumination sources, and shutters are used to restrict light exposure only during image capture. More recently, however, LED-based light engines for live-cell imaging have been introduced. A big advantage over other light sources is that these diode light sources (with multiple wavelengths) can be very rapidly switched on and off, which negates the use of additional mechanical shutters. Additionally, they have a much longer lifespan (10–20,000 h) and their intensity is also more stable over time. Not surprisingly, transmitted light sources are also moving away from tungsten halogen lamps to LED. CoolLED and Lumencor are some of the reputed LED engine manufacturers. For laser-based applications, such as CSLM, TIRF, FRAP, etc., commonly monochromatic solid-state laser sources are used, which are controlled by Acousto-Optical Tunable Filters (AOTF) for rapid switching between lasers, tuning their intensity and turning them on or off (Chap. 5).
6.2.2.5 Filters and Condenser Turret
For live-cell imaging, the bandwidths of excitation and emission filters as well as dichroic mirrors must be carefully chosen in order to limit unnecessary light exposure and to optimize fluorescence detection. Filters can be directly purchased from Chroma, Semrock among others. For some transmitted light microscopy techniques, such as phase contrast or DIC, special components are introduced in the light path, both through the condenser turret and filter turret(s). For fast imaging of multiple fluorophores or combined imaging of fluorescence and DIC, motorized filter turrets and condenser turrets that enable to switch rapidly between optical components and filters, are essential. Often the filter turret rotation speed is a rate-limiting factor in a typical live-cell experiment. To address this issue, Nikon’s Ti2-E uses camera-based triggering, thereby removing software overhead time and accelerating filter turret switching speed significantly. Alternately, multi-pass band filters are also used for collecting fast cellular processes (<10 s), although their light collection efficiency is reduced. Fast switching can also be achieved by using lasers coupled through AOTF or rapid LED-switching and an emission image splitter, so that no filter changes are required. It is also important to realize that phase rings, DIC-prisms, and analyzers in the fluorescence imaging light path will also reduce light efficiency.
6.2.2.6 Shutter
Fast electronic shutters should be used for both transmitted and fluorescence microscopy in order to limit light exposure to cells between imaging acquisition. Shutters may be built in into the microscope body or added between light source and microscope. It is worth noting that software overhead time can significantly delay the shutter speed, so shutters can be triggered via TTL with a detector (e.g., CCD).
6.2.2.7 Objective Lens
Brightness increases with the fourth power of NA and decreases with the square of magnification of an objective. The primary goal in live-cell imaging is to collect the maximum number of photons without inflicting photo damage, which is why it is recommended to use the highest NA objectives with lower magnifications whenever possible. Low magnification objectives capture a wider field of view and improve temporal resolution. High NA objectives are required for capturing weak fluorescent signals. It is worth noting that high NA objectives are also generally corrected for different optical aberrations, such as spherical aberration and chromatic aberration for up to four wavelengths, and which reduces light transmission (Chaps. 1–3). For live-cell imaging, it is usually better to choose objectives with lower magnification and highest fluorescence transmission (NA), which in turn can significantly reduce exposure time and thus reduce phototoxicity. All four major microscope companies manufacture high NA objectives but, unfortunately, they are not interchangeable. For example, Nikon infinity-corrected objectives are not interchangeable with Olympus infinity-corrected objectives; not only because of differences in tube length but also because of the fact that the mounting threads (fittings) are not the same (different pitch or diameter). Therefore, objectives need to be matched to a particular microscope from a single manufacturer. Likewise, objective immersion oils are also not interchangeable between companies, as they lead to optical mismatches and axial chromatic aberrations. Finally, heated objective collars are essential when immersion objectives are used, since the objective acts as a heat sink.
6.2.2.8 Detector
Cooled EM-CCD monochrome cameras have long been used for biological imaging, due to their low read noise and low signal recording ability. Over the last decade, however, the camera field has evolved greatly, and scientific CMOS cameras are becoming very popular due to their high speed and sensitivity as well as their large detector areas. Sensitive detectors are useful for collecting high signal-to-noise images from even weakly illuminated samples. Furthermore, large format cameras with small pixel size are useful for capturing large field of view at high spatial resolution, which allows for higher data throughput and temporal resolution with less phototoxicity. In Experimental Box 6.2, a practical example of the beneficial use of a CMOS camera in combination with long-term, high-resolution re-scanning confocal microscopy (RCM) is revealed. Andor, Photometrics and Hamamatsu—amongst many others—are reputed names in the camera manufacturing field. The most important properties to look for in cameras used for live-cell microscopy include quantum efficiency, frame rate, read noise, camera chip size, pixel size, dynamic range, bit depth, and binning capacity (Chap. 4). Confocal scanning laser microscopes use PMT detectors that are less sensitive and have lower quantum efficiencies (Chap. 5).
6.2.2.9 Image Acquisition Software
Automated control of the microscope and all its components is an essential part of live-cell imaging. Not surprisingly, all four major microscope manufacturers have developed their own software packages that provide a turnkey solution for image acquisition and analysis: Nikon (NIS Elements), Leica (LAS X), Olympus (CellSense), and Zeiss (Zen-Blue) software. Other commercial software packages include Metamorph (Molecular Devices), SlideBook (3i), Image-Pro (Media Cybernetics), Velocity (Perkin Elmer). Two open-source software packages, μManager [http://www.micro-manager.org] and ScanImage [http://www.scanimage.org] offer more flexibility to scientific researchers than the commercially available turnkey solutions. μManager is mainly used for camera image acquisition, although it can control scanning systems as well. It has full control over hardware components of most microscopes, including the platforms of all four major microscope manufacturers. ScanImage provides a software framework for controlling confocal scanning laser microscopes [8]. Laboratories that develop novel imaging technologies—or those with frequent changing needs that cannot be satisfied by the existing commercial packages—often take advantage of LabView (National Instruments), MATLAB (Mathworks) and Python, in order to write their own code.
Experimental Box 6.2 Re-scanning Confocal Microscopy (RCM) long-Term, High-Resolution Live-Cell Imaging: Laser Excitation Energy Load and Phototoxicity Compared to Other Commonly Used Microscopy Techniques
Introduction
The excitation light used in fluorescence microscopy can have a devastating impact on the health and viability of living cells and organisms (see also Experimental Box 6.1). The damaging effect of light on cellular macromolecules can impair physiology and even lead to cell death. While phototoxicity is known to occur in many live-cell experiments its effects are often underestimated [9]. One key strategy to reduce phototoxicity is lowering the intensity of the light the cells are exposed to. The required light intensity is dependent on several factors. Two key factors to consider are the sensitivity of the detector and the light efficiency of the microscope in general. Here we performed an experiment on several commonly used imaging modalities (EPI—widefield epifluorescence microscopy, CON—confocal scanning laser microscopy, STED—stimulated emission depletion microscopy, RCM—re-scanning confocal microscopy and SIM—structured illumination microscopy) and measured the light dose the cells were exposed to. The results clearly show that there are major differences between the different imaging modalities, underlining that one has to choose carefully the most suitable method for a live-cell imaging experiment.
Materials & Methods
HUVEC were cultured in round glass bottom dishes (Willco Dish, 35 mm) suitable for high-resolution microscopy. Cells were stained with PK Mitored diluted 1:100.000 in medium [10]. After 2 h the cells were imaged on an Olympus IX83 microscope, equipped with a 100X 1.5NA objective and a Hamamatsu Flash 4 V3 camera (EPI), a Leica TCS SP8 STED 3X microscope platform, equipped with a 100X 1.4NA objective and a HyD detector (CON & STED), a Nikon N-SIM microscope system, equipped with a 100X 1.49NA objective and a Hamamatsu Flash 4 V3 camera (SIM) or on an Olympus IX83 microscope, equipped with a 100X 1.5NA objective, RCM2-module (Confocal.nl) and a Hamamatsu Flash 4 V3 camera (RCM). Images were taken at a laser power to obtain sufficient SNR. Subsequently, z-stacks were imaged over time (11 planes per z-stack). A 561 nm laser was used to excite the mitochondrial dye. Post-acquisition processing was performed in Fiji for visualization optimization. All datasets were shown with a similar background and signal value, so they have approximately the same SNR. The exact laser power was measured with a Thorlabs S170C sensor at the sample plane after the objective (Table 6.1 and Fig 6.6).
Results

Time-lapse of HUVEC cells stained with PK Mito Red. Panel (a) Single xy-slice using the confocal microscope (CON); Panel (b) single xy-slice using the STED modality; Panel (c) RCM z-stack; and Panel (d) SIM z-stack. Note the numbers displaying the respective number of frames acquired. Scale bar = 10 μm
Data interpretation
From Fig. 6.6 we can observe that the sample bleaches very quickly (within a few tenths of frames) using Confocal and STED imaging (panels a and b), while bleaching is reduced to a minimum in the RCM (panel c) and SIM image (panel d). This supports the notion that there is a certain phototoxicity threshold below which there are no observed phototoxicity effects [9]. In addition, the STED laser seems to have less effect on bleaching compared to excitation laser (bleaching in Fig. 6.6 panels (a) and (b) are comparable). These results demonstrate that RCM utilizes the least amount of excitation energy. Confocal, SIM and STED require roughly the same amount of energy, but since SIM has a much shorter acquisition time, the received light dose is much less than confocal and STED. Epifluorescence illumination (EPI) is also relatively mild on the sample, as long as exposure time is kept at a minimum (see Table 1).
Live-cell imaging video
In the final part of this experimental box, we illustrate that RCM can be used to acquire long-term live-cell imaging videos with high spatial resolution (please follow this link to see our supplemental movie: https://vimeo.com/447800606). The key factor in making such movies is to use an extremely low amount of excitation energy in combination with photostable and bright fluorescent molecules. Furthermore, a sensitive photodetector (in this case a sCMOS camera) has to be used, which maximizes the detected signal—thereby offering a high SNR—while using only a very low amount of laser power.
Experimental parameters which were used to acquire the 61-h time-lapse of living HO1N1 cells
HO1N1 cells were acquired from Dandan Ma (AUMC, location VUMC, Amsterdam) and placed in glass-bottom 8-well μ-Slides (Ibidi, Cat. no. 80827). The cells were seeded at 50% confluency and allowed to adhere for 24 h before being transiently transfected overnight with CellLight Bacmam 2.0 Mitochondria-RFP (Invitrogen, Cat. no. C10505). The next day the cells were imaged using a Nikon Ti2 microscope equipped with a 40X PLAN APO 1.3 NA objective. The right port of the microscope was coupled to a re-scanning confocal microscope module (RCM, Confocal.nl) equipped with a Hamamatsu Flash 4 V3 sCMOS camera. For excitation, a Toptica CLE 561 nm laser was used and the laser power was measured to be 1 μW at the sample plane (measured using a Thorlabs PM100D with S170C sensor). The chosen ROI was 100 μm2 and pixel size was 107 nm. One image was taken every 10 s, for a period of 61 h, creating over 22,000 frames. The images were further processed using SVI Huygens deconvolution. The results in the video show an improvement in both the resolution and SNR of the raw RCM data.
Acknowledgments
The authors would like to thank Marko Popovic (Nikon Center of Excellence, Amsterdam UMC) for providing access to the confocal, STED, RCM, and SIM microscope set-ups. We are also grateful to Philippa Phelp (Boon Lab, Amsterdam UMC) for providing us with the HUVEC cells.
6.3 Fluorescent Proteins, Probes, and Labelling Techniques for Live-Cell Imaging
Fluorescence microscopy can be used to observe dynamic processes in living cells and organisms. At the dawn of fluorescence microscopy, brave experiments were limited to observing autofluorescent specimens. In 1914, Stanislaus von Prowazek introduced the first fluorescent stain to label non-fluorescent organisms (protozoa). Later—in 1941—Albert Coons in collaboration with Louis Fieser developed the immunofluorescence method by coupling fluorescent dyes to antibodies and using them to detect antigens in tissues. The enormous leap forward in fluorescence microscopy has been made by Osamu Shimomura who discovered the Green Fluorescent Protein (GFP) in the jellyfish Aequorea victoria in 1962 [11]. It took another 30 years until the GFP gene was sequenced and cloned by Douglas C. Prasher [12]. Two years after that, the first transgenic organism expressing GFP fusion protein (Fig. 6.7, panel a) was created by Martin Chalfie [13]. In addition, Roger Tsien laid the fundament for multicolour fluorescence microscopy by generating the blue-shifted variant of GFP [14].
The discovery of super-resolution microscopy techniques (Chap. 13) has imposed new requirements on the labelling methods and fluorophore properties. The resolution limit has leaped beyond the Abbe diffraction limit and is approaching 1 nm. Thus special attention has to be paid to the size of the fluorescent probe and labelling density, which are starting to be the limiting factors determining attainable resolution. For example, multiple studies report measured tubulin diameter larger than 30 nm, which contrasts with the ground truth data obtained using cryo-electron microscopy ~25 nm. High-resolution imaging requires high labelling density to be able to resolve all features of the structure of interest and this can be achieved only using small fluorescent molecules. If selected carefully, small tags and ligands perturb the target biomolecules to less extent compared the large tags. The vast majority of the labelling methods can be classified into four categories:
-
1.
Inserting or attaching specific tags which can be used for visualization of the target biomolecule.
-
2.
Using fluorescently tagged proteins which have affinity toward specific parts of the target biomolecule.
-
3.
Exploiting fluorescent dyes and probes which specifically bind to the target biomolecule.
-
4.
Introducing reactive moieties or fluorescent components during synthesis of biomolecule.
6.3.1 Protein Labelling Methods
Although fluorescently labelled proteins are well-known tools for highlighting the protein of interest, their application is limited by their photophysical properties (Fig. 6.7, panel a). Self-labelling proteins are more attractive because the fluorescent spectrum can be easily tuned by the exchange of the organic dye used for labelling (Fig. 6.7, panel b). The most frequently used protein labelling tags are SNAP-tag and Halo-tag [15]. They offer high labelling specificity and reaction rate reaching 108 M−1 s−1 [16]. SNAP-tag relies on O6-benzyl guanine fluorescent derivatives and Halo-tag accepts halo-alkane substrates (Fig. 6.7, panel b and f). Both compounds are relatively easy to derivatize with fluorescent dyes. An alternative to self-labelling proteins is peptides such as Flash-tag, His-tag, or Flag-tag [17]. Their small size offers little interference with the target protein function and contributes to the resolution increase in super-resolution imaging. The most recent example is His-tag labelling which demonstrated excellent quality images in living cells [18]. However, the wide use of this method is hampered by the membrane impermeability of the fluorescent tris-NTA-group, which calls for cell squeezing to deliver these dyes inside the cell.
Protein tagging with self-labelling proteins or short peptides usually is performed at the N- or C-terminus. This reduces flexibility and becomes an issue when distance measurements within the same protein must be performed. Insertions in the loop regions of large self-labelling proteins, or even short peptides, might strongly interfere with the protein of interest’s function. An alternative elegant approach to accomplish this challenging task is the introduction of artificial amino acids (Fig. 6.7, panel c). Genetic code engineering allows the introduction of an amino acid carrying a “click” compatible functional group into any site of the protein. Subsequently, this protein can be labelled via “click” chemistry with a cell-permeable fluorophore (Fig. 6.7, panel c and f). The downside of this approach is that living cells must be engineered by the introduction of special aminoacyl-tRNA synthetase - tRNA pairs in order to support the artificial amino acid incorporation.
Protein labelling based on ligand binding is the most promising approach in the field (Fig. 6.7, panel d). It eliminates protein overexpression phenotype and does not require loop engineering, nor the use of aminoacyl-tRNA synthetase - tRNA pairs. The main pitfall of this method, however, is finding the ligands which are selective and could be modified by attaching a fluorophore. Based on this principle several research groups introduced a series of highly biocompatible probes targeting actin, tubulin, DNA, poly(adenosine diphosphate-ribose) polymerase and lysosomes (Fig. 6.7, panel f). Although this advanced chemical synthesis has been employed to generate multiple cell-permeable fluorescent dyes, only a few have been shown to not interfere with the processes in living cells. Nevertheless, short-term exposure of cells to this class of fluorophores does not seem to produce significant changes in living cells.

The most common methods used for labelling proteins inside living cells. The protein labelling methods: (a) relying on fusions with autofluorescent proteins; (b) using specific peptides which can be labelled afterward or “self-labelling” tags; (c) based on the introduction of unnatural amino acids, carrying a reactive group, followed by a labelling reaction; (d) exploiting small molecule ligands; or (e) ligand directed covalent labelling; and (f) chemical structures of small molecule ligands used for protein targeting
Ideally, the ligand should not interfere with the function of the protein. However, often the targeting ligand can be identified among the well-characterized drugs, which show high potency in living cells and organisms. The possible solution for this problem, proposed by Itaru Hamachi [19], is the introduction of a cleavable linker, which can separate the ligand from the fluorophore after the binding event. The cleaved part containing fluorophore then stays attached to the protein of interest, while the ligand can be washed-off. Initially, this approach suffered from a slow linker cleavage rate, but this problem has been successfully addressed and now reaches 104 M−1 s−1 (Fig. 6.7, panel e).
6.3.2 DNA Labelling Methods
DNA staining with fluorescent dyes has a long history. The first reports of fluorescent DNA labelling and microscopy imaging can be attributed to Caspersson T., who used quinacrine mustard, an intercalating covalent DNA binder, for the fluorescent chromosome banding in 1968 [20]. Lammler and Schutze used Hoechst 33258, a minor grove binder, to stain nuclei in animal tissues, which was patented by German company Hoechst AG in 1967 (Fig. 6.8, panel a). Later, trypanosomiasis treatment drug search led to the synthesis of DAPI stain by the Otto Dann’s laboratory in 1971. Interestingly, DAPI molecule can intercalate or bind to the minor groove of DNA depending on the sequence context. The need for a far-red DNA stain was satisfied by the introduction of intercalating DRAQ5 fluorophore (Fig. 6.8, panel a). Even though these dyes were discovered a long time ago, they remain popular until today.

The most common methods used for labelling DNA inside living cells. DNA labelling can be achieved via these methods: (a) exploiting fluorescent dyes which bind to the DNA structure; (b) relying on the fluorescently tagged proteins, which are interacting with specific DNA sequences; and (c) catalytically inactivated Cas9 protein fusion with autofluorescent proteins, programmable via sgRNA
The first sequence-specific live-cell imaging approach involved the insertion of the large arrays of the lac operator (lacO) sequences, which can be detected after binding with the fluorescently tagged Lac repressor (LacR) protein (Fig. 6.8, panel b). The interaction is highly specific and shows low Kd, which results in a good contrast and allows long-term observations of the dynamics of the tagged loci. An alternative system is based on tet operator/Tet repressor (tetO/TetR). Development of genome editing tools has opened new horizons in imaging specific sequences in living cells. The first experiments have utilized polydactyl zinc finger DNA-binding domains fused to GFP, which were targeted to a 9-bp sequence in the major satellite repeats, localized in heterochromatin domains containing the centromere [21]. Later, this approach was greatly expanded by the introduction of the transcription activator-like effectors (TALEs) systems and the clustered regularly interspaced short palindromic repeat–CRISPR-associated CRISPR-Cas9 (Fig. 6.8, panel b and c) [22]. However, imaging of the non-repetitive sequences on the genomic DNA remained a great challenge, until the combination of dCas9 with the bacteriophage-derived RNA stem-loop motifs MS2 and PP7 made it possible (Fig. 6.8, panel c). Multiple genomic loci in living cells can be imaged using multicolor versions of CRISPR, specifically dCas9 from three bacterial orthologues or the CRISPRainbow system, which utilizes engineered sgRNAs binding to combinations of different fluorescent proteins. The final optimizations, which decreased the background and enhanced the signal, were introduction of multiple fluorescent reporter binding sites on the sgRNA and introduction of molecular beacon approach. It must be noted that all of these modifications resulted in the great expansion of the molecular size of the probe, which is beneficial for single-site imaging but detrimental to its localization precision.
6.3.3 RNA Labelling Methods
Specific RNA labelling is a challenging task because of the numerous structures which can be formed by this biomolecule. However, this very property was exploited for the first tagging and imaging experiment of a specific RNA species. A tandem array of bacteriophage MS2 derived stem-loops, that was specifically recognized by MS2 coat protein fusion with autofluorescent protein, was introduced into the target mRNA (Fig. 6.9, panel a) [23]. Multiple binding sites allow observation down to the single-molecule resolution. Later this principle was employed by creating multiple mRNA tagging systems PP7, U1, and λN-boxB. The next logical step in simplifying the RNA labelling methods was the introduction of an RNA aptamer that could fluoresce on its own or after binding the fluorogenic dye. The latter strategy was successfully employed in creation of Spinach and Broccoli aptamers, which can bind the isolated GFP chromophore and its versions [24, 25]. Further improvement resulted in a selection of more photostable chromophores: Mango III aptamer binds thiazole orange one and Riboglow aptamer recognizes cobalamin-fluorescein/rhodamine/cyanine conjugates (Fig. 6.9, panel b).
The high selectivity of RNA labelling could be achieved by employing programmable proteins recognizing specific sequences. This eliminates the need of inserting artificial tag into the native RNA molecule. Indeed, two approaches were demonstrated. The first exploits Pumilio homology domain (PUM-HD), which can be programmed to target any eight-base RNA sequence (Fig. 6.9, panel c). The specificity and SNR of this method is increased by employing two domains that are fused to split GFP and become fluorescent only after binding in close proximity. The alternative system exploits the catalytically inactive Cas13a, a class 2 type VI-A CRISPR-Cas RNA-guided RNA ribonuclease, which can be programmed using crRNA (Fig. 6.9, panel d). The dCas13a is expressed as a fusion with autofluorescent protein and introduction of crRNA leads to the assembly of the complex on the specific site of the target RNA molecule [26].

The most common methods used for labelling RNA inside living cells. Labelling of RNA can be accomplished using the following methods: (a) using bacteriophage MS2 RNA binding coat protein fusion with the autofluorescent protein; (b) relying on the introduced specific RNA sequence, which folds into aptamer and is able to bind fluorescent dye; (c) exploiting RNA interacting programmable Pumilio homology domains, fused to split autofluorescent proteins; (d) using catalytically inactive dCas13a protein fusion with autofluorescent proteins, programmable via sgRNA; and (e) using RNA interacting fluorescent dyes
The difficulty in designing RNA selective dyes is reflected by the fact that SYTO RNAselect is the only commercial probe available for RNA imaging in live cells and its structure remains unpublished [27]. However, attempts have been made to improve this situation by chemically synthesizing several types of RNA stains. For example, Wang and co-workers designed a series of crescent-shaped probes for the imaging of nucleolar RNA in live cells (Fig. 6.9, panel e) [28]. In addition, Li and Chang screened a library of styryl derivatives and identified a potential probe F22 fluorescing in the red region, which showed the characteristic nucleolar and cytosol staining in living Hela cells [29]. An interesting design was also reported by Turro and co-workers, who covalently linked the intercalating dye ethidium bromide and the fluorescein dye [30]. The resulting phenanthridine derivative covalently linked to a fluorescein moiety (FLEth) probe showed selectivity toward RNA and characteristic staining of nucleolus and cytoplasm in mammalian breast cancer cell lines.
6.3.4 Fluorescence Resonance Energy Transfer (FRET)
Although visualizing structures in living cells often relies on using fluorescence—which provides high selectivity and contrast—the optical resolution of the light microscope limits determinations of protein proximities to approximately 200–300 nm (Chap. 1). However, in addition to braking the diffraction limit by using super-resolution microscopy (Chap. 13), this degree of diffraction-unlimited spatial resolution can also be achieved in light microscopy, by using appropriate sets of fluorescently labelled proteins, a technique called fluorescence resonance energy transfer (FRET) [31]. FRET is a physical process by which radiation-less transfer of energy occurs from a fluorophore in the excited state to an acceptor molecule (i.e., matching fluorophore) in close proximity. The range over which resonance energy transfer can occur is limited to approximately 0.01 μm and the efficiency of energy transfer is extraordinarily sensitive to the distance between fluorophores. FRET between fluorescent dyes in aqueous media is decreased to 50% at a 5–6 nm distance [32]. Nevertheless, measurement of intra- and intermolecular FRET under the microscope provides a particularly powerful, non-invasive approach to visualize the spatiotemporal dynamics within and between proteins in a living cell. One of the many elegant examples of FRET microscopy in live-cell imaging has been reported by Banerjee and co-workers, who used multiple FRET pairs to visualize dynamic co-localization of signalling molecules in the inhibitor kappa B kinase signalosome [33]. For further reading on the various applications of FRET imaging in biomedical research, the reader is referred to the vast amount of existing literature.
Experimental Box 6.3 Label-Free Holographic Imaging
In order to be visualized by using a standard or fluorescent light microscope, cells must be stained—or genetically modified—to absorb, emit or scatter light. Unfortunately, the invasive preparations necessary to make cells visible are most likely to affect cellular behavior, compromising the in vivo relevance of in vitro live-cell observations (see also Experimental Boxes 6.1 and 6.2).
Gentle cell imaging
Unstained cells do, however, slow down and distort the light passing through them, just like beach waves are distorted by shallower water. By using a phase-contrast microscope these phase-shift distortions—created by living cells—can be observed, making unstained cells clearly visible. Just like water waves, light waves of a specific wavelength have two basic characteristics: i.e., amplitude and phase. Amplitude corresponds to light intensity and is the height of the wave, measured from crest to trough. Phase describes whether a wave is currently at its crest, in its trough, or somewhere in between. When light passes through a cell submerged in cell media, the light amplitude is relatively unaffected. However, the more optically dense cell slows down and delays the light, slightly relative to the surrounding ambient light, creating a phase-shift that makes cells visible in a phase-contrast microscope. Importantly, conventional phase-contrast microscopy cannot quantify phase shifts, only visualize them.
Quantitative phase imaging
Using a digital image sensor, low power diode illumination and sophisticated computer algorithms, the HoloMonitor® live-cell imager from Phase Holographic Imaging PHI AB, Lund, Sweden has the ability to both quantify and visualize phase-shifts [https:/phiab.com/]. HoloMonitor® employs a technique called quantitative phase imaging (QPI) or quantitative phase contrast microscopy, to distinguish it from its soon 100-year-old non-quantitative predecessor—the phase-contrast microscope [34,35,36] (Fig. 6.10).

An example of a quantitative phase image of living cells in 3D created by HoloMonitor®. The height of the cell and its color tone correspond to the optical thickness of the cell. (Source: https://phiab.com) (Reproduced with permission)
Gentle time-lapse imaging
As the cell does not absorb any light energy, the cells are completely unaffected when observed using HoloMonitor®—no energy exchange, no change. This allows HoloMonitor® to gently acquire time-lapse image sequences over extended periods of time without compromising cellular behavior. HoloMonitor® provides both quantitative and beautiful time-lapse images of living cells, transforming phase microscopy and label-free live-cell imaging into a quantitative tool for detailed analysis of living cells on a population and single-cell level (Fig. 6.11).

Time-lapse image sequence created by using HoloMonitor® in a wound-healing assay. (Source: https://phiab.com/) (Reproduced with permission)
6.4 Live-Cell Imaging in 3D Cell Cultures: Spheroids and Organoids
Cell-based assays have traditionally relied on 2D cell cultures, which represent a simple and easy-to-image model to study the cellular response to chemical stimulation or stress. However, due to their inability to capture the complex nature of organs, new assays based on 3D cell cultures have evolved rapidly over the past years. Based on the type of cells and their cellular organization there are currently two types of 3D self-organized cell culture models, i.e., spheroids and organoids (Fig. 6.12). Spheroids and organoids are more realistic models of both healthy and pathological tissues [37]. In addition, they are suitable for high-content screening (HCS). Therefore, the effects of potential therapeutical molecules can be investigated in an environment similar to the target tissue and in high-throughput settings, thereby improving the physiological significance of these assays. Microscopy-based HCS is further highlighted in Experimental Box 6.4. These 3D cell-based assays will ultimately reduce the effort and costs of drug development as well as the failure rate of clinical studies.
As research models, spheroids and organoids offer a compromise between 2D cell lines and living animals. Live-cell imaging has been essential to probe their complex morphology and demonstrate that they faithfully reflect their in vivo counterparts. Essentially, spheroids are clumps of poorly organized cells that have become a popular model in oncology research (Fig. 6.12). Due to their solid spherical morphology, both oxygen and nutrients decrease toward the center, decreasing cell viability from the outer cell layers to their hypoxic and necrotic cores [38]. Spheroids do not need a supportive matrix to grow and are more irregularly arranged cell aggregates with a rather poor organization of relevant tissue. Organoids, on the other hand, originate from stem cells, which give rise to different organ-specific cell types and ensure the cell culture’s high self-renewal capabilities. Organoids do require a matrix to grow and possess a much more ordered assembly that typically recapitulates the 3D complex tissue structures (Fig. 6.12). When embedded in a suitable matrix and cultured with specific biochemical factors that mimic the in vivo stem cell niche, stem cells possess an intrinsic ability to differentiate and self-organize into 3D structures that resemble the in vivo organ [39]. Not surprisingly, 3D organoid models have recently gained a lot of popularity as new in vitro tools for drug testing, disease modeling and tissue engineering [40].
Thin section preparation, combined with classic immunohistochemistry, has been extensively used to roughly screen tissue architecture in 2D and to observe the distribution of single and multiple markers. 2D imaging though informative, however, does not allow a full appreciation of the complexity of 3D structures. Providentially, the past decade has emerged as a new era of volume or 3D imaging with novel microscopic approaches that can cross scales from cell to tissue. Noninvasive optical sectioning methods such as confocal imaging or multiphoton microscopy, and more recently light-sheet technology, now make it possible to visualize fine cellular details as well as overall tissue architecture within a single biological sample.

Schematic comparison of 3D spheroid (left) and organoid (right) models
6.4.1 Challenges
Live-cell imaging is, of course, not trivial to do well, in particular when studying primary cells. Spatiotemporal resolution, signal-to-noise ratio, and acquisition time must be balanced to obtain the best images over time while avoiding light toxicity. A major challenge, however, is obtaining high-resolution images. Due to the size of the 3D cultures, live-cell microscopy to subcellular or even cellular resolution is extremely challenging when using conventional imaging techniques such as widefield fluorescence microscopy, laser-scanning confocal microscopy, or spinning-disk confocal microscopy (Chaps. 3, 5 and 11).
There are three major limitations that make high-quality images hard to acquire. The first limitation is phototoxicity following the repeated exposure of fluorescently labelled cells to illumination (from lasers) as mentioned earlier in this chapter and also illustrated in Experimental Boxes 6.1 and 6.2. When exposed to high amounts of laser light, fluorescent molecules react with molecular oxygen to produce free radicals. These can cause severe damage throughout the cell, in particular to the cellular DNA and the mitochondria. Recording intervals at least 20–30 min apart should be set when using the automated microscope to avoid high phototoxicity. To evaluate artifacts due to phototoxicity effects of a negative control, which is not imaged, should therefore be kept during live-cell imaging. The second limitation is the resolution required to separate subcellular biological structures, which is often near the resolving power of the microscopy setup being used. The lateral and axial resolution of a setup is determined by its PSF, which in turn depends on the NA of the objective. In 2D imaging, good lateral resolution is the key parameter, which can be achieved at relatively low NA. In 3D, however, refractive index mismatch can cause spherical aberrations, which lead to widening of the axial PSF and thus considerably impacting the quality of the imaging data obtained. High-resolution live-cell imaging, therefore, requires a high NA objective lens. Thirdly, when using ultra-low-attachment plates, the spheroids can drift out of the field of view, thereby causing distorted projection images upon acquiring z-stacks. Leary and co-workers recently showed that this limitation can be overcome by using 3D-printed molds containing 4 micro-posts per well (microwells) in agarose at defined spatial locations [41]. In addition, they addressed the issue of non-uniform fluorescence loss by performing ratio imaging.
6.4.1.1 Multiphoton Imaging of Spheroids
Multiphoton microscopy is regarded as the method of choice for imaging of living, intact biological tissues from the molecular level through to the whole organism (Chap. 9). The technique is uniquely suited to perform experimental measurements with minimal invasion over prolonged periods of time. It offers the researcher the ability to observe dynamic biological processes in substantial detail on time scales ranging from microseconds to weeks. In comparison to similar optical imaging techniques, multiphoton microscopy holds inherent advantages for imaging living 3D tissues such as improved penetration depth and reduced photodamage. In contrast to single-photon microscopy, two-photon microscopy is associated with a smaller volume of excitation as the two-photon effect only occurs in the focal spot of the objective, where the photon flux is high. In single-photon microscopy, the excitation also occurs above and below the focal point, resulting in significant phototoxicity and out-of-focus light. In a very elegant study by Grist and co-workers, long-term live-cell imaging of tumor spheroids in a microfluidic system was carried out using a two-photon confocal scanning laser microscope [42]. The spheroids were observed for 72 h at 20 min intervals under different oxygen concentration conditions to determine the effect of oxygen concentration on tumors and their susceptibility to treatment (Fig. 6.13).

MicroBrain spheroid (BF, left panel a) and 3D volume-rendered image of a spheroid generated by NIS Elements.AI (FL, right panel b). Liver epithelial organoid (FL, panel c)
6.4.1.2 Confocal and Spinning-Disk Live-Cell Imaging of Organoids
A considerable advantage of organoids is their accessibility for live observation to study dynamic processes even at high resolution. Confocal live-cell microscopy, for instance, enables the study of complex cellular processes in space and time in organoids, where specific cell types or subcellular organelles and activities have been marked with fluorescent reporters. In an interesting work recently published, Artegiani and co-workers coupled a novel genome editing method—dubbed “CRISPR-HOT”—that allows efficient generation of knock-in human organoids representing different tissues without extensive cloning [43]. This method allowed for fluorescently tagging of non-constitutively expressed differentiation markers and visualizing the differentiation process via a confocal scanning laser or a spinning-disk microscope over a period of up to 72 h.
In another example from Clevers and co-workers, CRISPR–Cas9-mediated genome editing was used to introduce sequential mutations into human colon organoids to model the adenoma-carcinoma sequence [44]. Chromosome instability (CIN) and aneuploidy, both hallmarks of colorectal cancer (CRC), were then analyzed using a fluorescently tagged histone 2B (H2B)-encoding lentivirus. The use of 4D live-cell imaging over several days allowed a precise determination of chromosome segregation defects, including aberrant chromosome number and erroneous mitotic events, and pinpointed the mutations sufficient to acquire CIN. This powerful combination of engineered organoids and dynamic imaging will no doubt continue to aid our understanding of disease progression as well as cellular mechanisms orchestrating development and homeostasis.
6.4.1.3 Light-Sheet Imaging of Spheroids and Organoids
In recent years, light-sheet microscopy has emerged as a particularly fast and gentle technology for live-cell imaging (Chap. 12). Because the excitation is restricted to a thin sheet of light that can rapidly scan sizable biological specimens, light exposure and phototoxicity are minimized. With only a section of the sample being illuminated at any time and rapid frame-wise data capture, light-sheet fluorescence microscopy creates a photonic load several orders of magnitude lower than standard confocal fluorescence imaging. This sophisticated imaging technique has therefore been used to investigate dynamic processes on varying scales, including tracking microtubules plus tips of the mitotic apparatus as well as lineage tracing of cells in spheroids. In addition, Held and co-workers employed light-sheet microscopy to image organoids embedded in a freely rotatable hydrogel cylinder to facilitate imaging from various angles [45]. The authors succeeded in imaging labelled cells within re-aggregated kidney organoids over 15 h and tracking their fate while simultaneously monitoring the development of organotypic morphological structures.
Experimental Box 6.4 Microscopy-Based High-Content Screening (HCS)
With the advent of microscope automation, fluorescent probes, and image analyses methodologies, it is now possible to perform high-content analysis of visual phenotypes, to extract quantitative, multi-parametric information from images with minimal user bias [46]. High-throughput imaging can be classified into screening and profiling [47]. Screening—per definition—uses a priori knowledge to interrogate a phenomenon, measure multiple, visually discernible phenotypes and choose a subset of hits to pursue a biological question. Image-based screening has been applied to study alterations in protein localization in various cancer cells and complex organismal phenotypes. Profiling is a much more exploratory systems-level technique that uses an unguided approach to capture a broad spectrum of measurements from samples and maps. The latter is based on similarity and offers a greater chance to discover unknown mechanisms. Both screening and profiling applications are used in drug discovery, functional genomics, and disease phenotyping. Microscopy-based analyses also facilitate longitudinal single-cell analysis among populations, to identify cell-to-cell variability, otherwise obfuscated in population averaging experiments, leading to insights into complex biological processes at single-cell resolution [48,49,50].
There are many commercial solutions available for high-content screening. High-content imagers are typically box-type systems available from, e.g., Molecular Devices (ImageXpress), Thermo-Fischer (CellInsight, ArrayScan), Perkin-Elmer (Opera Phenix), and Zeiss (Celldiscoverer 7). High-content analysis platforms based on microscopes are offered by, e.g., Nikon (HCA system) and Olympus (ScanR). In contrast to the box systems mentioned above, Nikon’s HCA system builds on the completely motorized Ti2-E body and provides a very flexible platform for researchers to customize hardware components for their evolving needs. Users can add components including—but not limited to—light sources, optics, detection systems, filters, photo stimulation devices, confocal, and super-resolution modules. An automated plate loader controlled by NIS-Elements software can be added to this platform. Furthermore, in addition to Nikon’s silicon objective lenses, an automated water immersion dispenser for Nikon’s water immersion objectives for long-term experiments is also available (Fig. 6.14).

High-content microscope platform based on Nikon Ti-E inverted microscope integrated with a robotic plate loader. Ti2-E can double the throughput of this design (a) for moving samples from incubator (b) to microscope stage (c). The system displayed in this figure belongs to the Finkbeiner laboratory. (Source: https://www.nature.com/articles/nmeth.f.400/figures/1) (Reproduced with permission)
High-content screening is limited by the number of images that can be acquired in a short span of time. Nikon’s Ti2-E microscope has the largest field of view camera port in the market. The Ti2’s large FOV coupled with hardware triggering of native devices significantly reduces the number of images and acquisition time by minimizing software latencies. NIS-Element’s JOBS and General analyses modules allow conditional and customizable workflow determined by real-time data analyses. In addition, Nikon’s Perfect Focus system allows for fast accurate focusing across multiple points. Large format sensor cameras—like Nikon’s DSQi2—with small pixel sizes provide improved spatial and temporal resolution.
Summary and Take-Home Messages
The three main experimental challenges in live-cell imaging are to minimize photodamage, to provide a stable environment for long-term experiments in cells and multicellular preparations and—last but not least—to prevent focal drift. Generally, it is best to use as little as possible excitation light in combination with fast and sensitive detectors. LED light sources as well as CMOS cameras have therefore become crucial components of live-cell imaging microscopes. As modern high-end microscopy platforms for live-cell imaging are evolving to allow for automated imaging of multiple fluorescent reporters, under low excitation conditions at multiple positions, in 3D, and over longer time-periods, the possibilities of these sophisticated platforms will only expand. We envision that high-throughput platforms will enable simultaneous studies of cellular morphology and live-cell activity alterations within 2D and 3D cell cultures, with both high speed and resolution, while at the same time also performing sensitive molecular drug screens in vitro. Undoubtedly, the next great challenge will therefore be the extraction and analysis of the immense amount of imaging data generated. Image-based cell profiling techniques are now being developed to find, segment, and count densely packed cells in large tissues, or to quantify phenotypic differences in 2D as well as 3D cell populations assayed in high-throughput settings. It is obvious that—while pushing cellular and subcellular resolution—an unbiased quantitative understanding of dynamic intra- and intercellular relationships within cell cultures, spheroids, and organoids, will be equally essential to fully comprehend the complexity that can be monitored using live-cell microscopy.
Take-Home Messages
-
Choose a stable and expandable microscope platform, with solid and well-integrated live-cell imaging components (e.g., stage-incubator, temperature controller, humidifier), that best matches your experimental model(s) as well as your specific scientific questions.
-
In general, in order to minimize photodamage during live-cell imaging experiments, use as little as possible excitation light (e.g., low laser light, spinning disk, or LED light-engines) in combination with a fast and sensitive detector, that also supports a large FOV (e.g., CMOS camera).
-
Choose your fluorescent dyes and/or probes wisely: there are numerous dedicated probes available for live-cell imaging applications (some have been designed specifically for certain live-cell applications).
-
Use software-controlled microscopy automation and—if possible—hardware-triggering to support fast and reproducible acquisition with minimal phototoxicity.
Change history
29 January 2023
The original version of this chapter was inadvertently published with errors. The following corrections have been made after publication.
Abbreviations
- AOTF:
-
Acousto-optical tunable filter
- BF:
-
Brightfield
- CCD:
-
Charge-coupled device
- CIN:
-
Chromosome instability
- CMOS:
-
Complementary metal-oxide-semiconductor
- CON:
-
Confocal microscopy
- CRC:
-
Colorectal cancer
- CRISPR:
-
Clustered regularly interspaced short palindromic repeats
- CRISPR-HOT:
-
CRISPR-Cas9-mediated homology-independent organoid transgenesis
- CSLM:
-
Confocal scanning laser microscopy
- DAPI:
-
4′,6-diamidino-2-fenylindool
- DIC:
-
Differential interference contrast
- EM-CCD:
-
Electron multiplying charged-coupled device
- EPI:
-
Epifluorescence microscopy
- FL:
-
Fluorescence
- FOV:
-
Field of view
- FRAP:
-
Fluorescence recovery after photobleaching
- FRET:
-
Fluorescence resonance energy transfer
- GFP:
-
Green fluorescent protein
- HCA:
-
High-content analysis
- HCS:
-
High-content screening
- HEPA:
-
High-efficiency particulate air
- HUVEC:
-
Human umbilical vein endothelial cells
- IR:
-
Infrared
- LED:
-
Light-emitting diode
- NA:
-
Numerical aperture
- NIR:
-
Near-infrared
- PFS:
-
Perfect focus system
- PMT:
-
Photomultiplier tube
- PSF:
-
Point spread function
- PUM-HD:
-
Pumilio-homology domain
- PZF:
-
Polydactyl zinc finger
- RCM:
-
Re-scanning confocal microscopy
- RFP:
-
Red fluorescent protein
- ROI:
-
Region of interest
- SIM:
-
Structured illumination microscopy
- SNR:
-
Signal-to-noise ratio
- STED:
-
Stimulated emission depletion microscopy
- STORM:
-
Stochastic optical reconstruction microscopy
- TALE:
-
Transcription activator-like effector
- TIRF:
-
Total internal reflection fluorescence
- TTL:
-
Transistor-transistor logic
- UV:
-
Ultraviolet
References
Pattison DI, Davies MJ. Actions of ultraviolet light on cellular structures. EXS. 2006;96:131–57.
Dixit R, Cyr R. Cell damage and reactive oxygen species production induced by fluorescence microscopy: effect on mitosis and guidelines for non-invasive fluorescence microscopy. Plant J. 2003;36(2):280–90.
Grzelak A, Rychlik B, Bartosz G. Light-dependent generation of reactive oxygen species in cell culture media. Free Radic Biol Med. 2001;30(12):1418–25.
Godley BF, Shamsi FA, Liang F-Q, Jarrett SG, Davies S, Boulton M. Blue light induces mitochondrial DNA damage and free radical production in epithelial cells. J Biol Chem. 2005;280(22):21061–6.
Wittmann T, Bokoch GM, Waterman-Storer CM. Regulation of leading edge microtubule and actin dynamics downstream of Rac1. J Cell Biol. 2003;161(5):845–51.
Zhai Y, Kronebusch PJ, Borisy GG. Kinetochore microtubule dynamics and the metaphase-anaphase transition. J Cell Biol. 1995;131(3):721–34.
Rodionov VI, Borisy GG. Microtubule treadmilling in vivo. Science (New York, NY). 1997;275(5297):215–8.
Pologruto TA, et al. ScanImage: flexible software for operating laser scanning microscopes. Biomed Eng Online. 2003;2:13.
Icha J, Weber M, Waters JC, Norden C. Phototoxicity in live fluorescence microscopy, and how to avoid it. BioEssays. 2017;39(8):170003.
Shen F-F, Chen Y, Dai X, Zhang H-Y, Zhang B, Liu Y, Liu Y. Purely organic light-harvesting phosphorescence energy transfer by beta-cyclodextrin pseudorotaxane for mitochondria targeted imaging. Chem Sci. 2020;12(5):1851–7.
Shimomura O, Johnson FH, Saiga Y. Extraction, purification and properties of aequorin, a bioluminescent proten from theluminous hydromedusan, Aequorea. J Cell Comp Physiol. 1962;59:223–39.
Prasher DC, Eckenrode VK, Ward WW, Prendergast FG, Cormier MJ. Primary structure of the Aequorea victoria green-fluorescent protein. Gene. 1992;111:229–33.
Chalfie M, Tu Y, Euskirchen G, Ward WW, Prasher DC. Green fluorescent protein as a marker for gene expression. Science. 1994;263:802–5.
Heim R, Prasher DC, Tsien RY. Wavelength mutations and posttranslational autoxidation of green fluorescent protein. Proc Natl Acad Sci U S A. 1994;91:12501–4.
Keppler A, Gendreizig S, Gronemeyer T, Pick H, Vogel H, Johnsson K. A general method for the covalent labelling of fusion proteins with small molecules in vivo. Nat Biotechnol. 2003;21:86–9.
Wilhelm J, Kühn S, Tarnawski M, Gotthard G, Tünnermann J, Tänzer T, Karpenko J, Mertes N, Xue L, Uhrig U, Reinstein J, Hiblot J, Johnsson K. Kinetic and structural characterization of the self-labeling protein tags HaloTag7, SNAP-tag, and CLIP-tag. Biochemistry. 2021;60(33):2560–75.
Griffin BA, Adams SR, Tsien RY. Specific covalent labelling of recombinant protein molecules inside live cells. Science. 1998;281:269–72.
Uchinomiya SH, Nonaka H, Fujishima SH, Tsukiji S, Ojida A, Hamachi I. Site-specific covalent labeling of His-tag fused proteins with a reactive Ni(II)-NTA probe. Chem Commun (Camb). 2009;39:5880–2.
Tamura T, Hamachi I. Chemistry for covalent modification of endogenous/native proteins: from test tubes to complex biological systems. J Am Chem Soc. 2019;141(7):2782–99.
Caspersson T, Farber S, Foley GE, Kudynowski J, Modest EJ, Simonsson E, Wagh U, Zech L. Chemical differentiation along metaphase chromosomes. Exp Cell Res. 1968;49:219–22.
Lindhout BI, Fransz P, Tessadori F, Meckel T, Hooykaas PJ, van der Zaal BJ. Live cell imaging of repetitive DNA sequences via GFP-tagged polydactyl zinc finger proteins. Nucleic Acids Res. 2007;35(16):e107.
Chen B, Gilbert LA, Cimini BA, Schnitzbauer J, Zhang W, Li G-W, Park J, Blackburn EH, Weissman JS, Qi L-S, Huang B. Dynamic imaging of genomic loci in living human cells by an optimized CRISPR/Cas system. Cell. 2013;155(7):1479–91.
Bertrand E, Chartrand P, Schaefer M, Shenoy SM, Singer RH, Long RM. Localization of ASH1 mRNA particles in living yeast. Mol Cell. 1998;2(4):437–45.
Paige JS, Nguyen-Duc T, Song W, Jaffrey SR. Fluorescence imaging of cellular metabolites with RNA. Science. 2012;335(6073):1194.
Filonov GS, Moon JD, Svensen N, Jaffrey SR. Broccoli: rapid selection of an RNA mimic of green fluorescent protein by fluorescence-based selection and directed evolution. J Am Chem Soc. 2014;136(46):16299–308.
Abudayyeh OO, Gootenberg JS, Essletzbichler P, Joung HS, Belanto JJ, Verdine V, Cox DBT, Kellner MJ, Regev A, Lander ES, Voytas DF, Ting AY, Zhang F. RNA targeting with CRISPR-Cas13. Nature. 2017;550(7675):280–4.
Suseela YV, Narayanaswamy N, Pratihar S, Govindaraju T. Far-red fluorescent probes for canonical and non-canonical nucleic acid structures: current progress and future implications. Chem Soc Rev. 2018;47(3):1098–131.
Liu W, Zhou B, Niu G, Ge J, Wu J, Zhang H, Xu H, Wang P. Deep-red emissive crescent-shaped fluorescent dyes: substituent effect on live cell imaging. ACS Appl Mater Interfaces. 2015;7(13):7421–7.
Li Q, Chang YT. A protocol for preparing, characterizing and using three RNA-specific, live cell imaging probes: E36, E144 and F22. Nat Protoc. 2006;1(6):2922–32.
Stevens N, O’Connor N, Vishwasrau H, Samaroo D, Kandel ER, Akins DL, Drain CM, Turro NJ. Two color RNA intercalating probe for cell imaging applications. J Am Chem Soc. 2008;130(23):7182–3.
Day RN, Davidson MW. Fluorescent proteins for FRET microscopy: monitoring protein interactions in living cells. BioEssays. 2012;34(5):341–50.
Berney C, Danuser G. FRET or no FRET: a quantitative comparison. Biophys J. 2003;84:3992–4010.
Gamboni F, Escobar GA, Moore EE, Dzieciatkowska M, Hansen KC, Mitra S, Mydam TA, Silliman CC, Banerjee A. Clathrin complexes with the inhibitor kappa B kinase signalosome: imaging the interactome. Phys Rep. 2014;2(7):12035.
Zhang Y, Judson RL. Evaluation of holographic imaging cytometer HoloMonitor M4® motility applications. Cytometry A. 2018;93(11):1125–31.
Janicke B, Kårsnäs A, Egelberg P, Alm K. Label-free high temporal resolution assessment of cell proliferation using digital holographic microscopy. Cytometry A. 2017;91(5):460–9.
Sebesta M, Egelberg PJ, Langberg A, Lindskov J-H, Alm K, Janicke B. HoloMonitor M4: holographic imaging cytometer for real-time kinetic label-free live-cell analysis of adherent cells. Boston: Phase Holographic Imaging PHI Inc; 2016.
Torras N, Garcia-Diaz M, Fernandez-Majada F, Martinez E. Mimicking epithelial tissues in three-dimensional cell culture models. Front Bioeng Biotechnol. 2018;6:197.
Lin RZ, Chang HY. Recent advances in three-dimensional multicellular spheroid culture for biomedical research. Biotechnol J. 2008;3(9–10):1172–84.
Rossi G, Manfrin A, Lutolf MP. Progress and potential in organoid research. Nat Rev Genet. 2018;19(11):671–87.
Fang Y, Eglen RM. Three-dimensional cell cultures in drug discovery and development. SLAS Discov. 2017;22(5):456–72.
Leary E, Rhee C, Wilks BT, Morgan JR. Quantitative live-cell confocal imaging of 3D spheroids in a high-throughput format. SLAS Technol. 2018;23(3):231–42.
Grist SM, Nasseri SS, Laplatine L, Schmok JC, Yao D, Hua J, Chrostowski L, Cheung KC. Long-term monitoring in a microfluidic system to study tumour spheroid response to chronic and cycling hypoxia. Sci Rep. 2019;9(1):17782.
Artegiani B, Hendriks D, Beumer J, Kok R, Zheng X, Joore J, de Sousa C, Lopes S, van Zon J, Tans S, Clevers H. Fast and efficient generation of knock-in human organoids using homology-independent CRISPR-Cas9 precision genome editing. Nat Cell Biol. 2020;22(3):321–31.
Bolhaqueiro ACF, Ponsioen B, Bakker B, Klaasen SJ, Kucukkose E, van Jaarsveld RH, Vivié J, Verlaan-Klink I, Hami N, Spierings DCJ, Sasaki N, Dutta D, Boj SF, Vries RGJ, Lansdorp PM, van de Wetering M, van Oudenaarden A, Clevers H, Kranenburg O, Foijer F, Snippert HJG, Kops GJPL. Ongoing chromosomal instability and karyotype evolution in human colorectal cancer organoids. Nat Genet. 2019;51(5):824–35.
Held M, Santeramo I, Wilm B, Murray P, Lévy R. Ex vivo live cell tracking in kidney organoids using light sheet fluorescence microscopy. PLoS One. 2018;13(7):e0199918.
Boutros M, Heigwer F, Laufer C. Microscopy-based high-content screening. Cell. 2015;163(6):1314–25.
Caicedo JC, Singh S, Carpenter AE. Applications in image-based profiling of perturbations. Curr Opin Biotechnol. 2016;39:134–42.
Arrasate M, Finkbeiner S. Automated microscope system for determining factors that predict neuronal fate. Proc Natl Acad Sci U S A. 2005;102(10):3840–5.
Snijder B, Sacher R, Rämö P, Liberali P, Mench K, Wolfrum N, Burleigh L, Scott CC, Verheije MH, Mercer J, Moese S, Heger T, Theusner K, Jurgeit A, Lamparter D, Balistreri G, Schelhaas M, De Haan CAM, Marjomäki V, Hyypiä T, Rottier PJM, Sodeik B, Marsh M, Gruenberg J, Amara A, Greber U, Helenius A, Pelkmans L. Single-cell analysis of population context advances RNAi screening at multiple levels. Mol Syst Biol. 2012;8:579.
Snijder B, Pelkmans L. Origins of regulated cell-to-cell variability. Nat Rev Mol Cell Biol. 2011;12(2):119–25.
Author information
Authors and Affiliations
Editor information
Editors and Affiliations
Appendix: Microscope Company and Resources List with Internet-Links
Appendix: Microscope Company and Resources List with Internet-Links
-
Andor—www.andor.oxinst.com
-
Applied Scientific Instrumentation (ASI)—www.asiimaging.com
-
Chroma—www.chroma.com
-
Confocal.nl—www.confocal.nl
-
CoolLED—www.coolled.com
-
Hamamatsu—www.hamamatsu.com
-
Intelligent Imaging Innovations (3i)—www.intelligent-imaging.com
-
Leica Microsystems—www.leica-microsystems.com (and www.leica-microsystems.com/science-lab/science-lab-home)
-
Lumencor—www.lumencor.com
-
Mad City Labs (MCL) GmbH—www.madcitylabs.eu
-
μManager—www.micro-manager.org
-
Mathworks—www.mathworks.com
-
Media Cybernetics—www.mediacy.com
-
Molecular Devices—www.moleculardevices.com
-
National Instruments—www.ni.com
-
Nikon Instruments—www.microsope.healthcare.nikon.com (and www.microscopyu.com)
-
Okolab—www.oko-lab.com
-
Olympus Microscopy—www.olympus-lifescience.com (and www.olympus-lifescience.com/en/learn)
-
Perkin-Elmer—www.perkinelmer.com
-
Phase Holographic Imaging (PHI)—https:/phiab.com/
-
Photometrics—www.photometrics.com
-
Physics Instruments (PI)—www.physikinstrumente.com
-
Prior Scientific—www.prior.com
-
ScanImage—www.scanimage.org
-
Semrock—www.semrock.com
-
Thermo-Fischer—www.thermofisher.com
-
Thorlabs—www.thorlabs.com
-
Tokai Hit—www.tokaihit.com
-
Zeiss—www.zeiss.com/microscopy
Rights and permissions
Copyright information
© 2022 The Author(s), under exclusive license to Springer Nature Switzerland AG
About this chapter

Cite this chapter
Kole, J., Ahmed, H., Chatterjee, N., Lukinavičius, G., Musters, R. (2022). Live-Cell Imaging: A Balancing Act Between Speed, Sensitivity, and Resolution. In: Nechyporuk-Zloy, V. (eds) Principles of Light Microscopy: From Basic to Advanced . Springer, Cham. https://doi.org/10.1007/978-3-031-04477-9_6
Download citation
DOI: https://doi.org/10.1007/978-3-031-04477-9_6
Published:
Publisher Name: Springer, Cham
Print ISBN: 978-3-031-04476-2
Online ISBN: 978-3-031-04477-9
eBook Packages: Biomedical and Life SciencesBiomedical and Life Sciences (R0)