
Abstract
Innovations in pedagogy and technology have lead to a new paradigm in teaching particularly in higher education. At the nexus of this new paradigm is blended learning and e-learning. Blended learning refers to combination of synchronous and asynchronous learning activities. While e-learning refers to learning system that utilize electronic means or information communication technology (ICT) to deliver information for education or training purposes. Though in infancy e-learning in India has garnered pace in last decade, introduction of SWAYAM portal for offering massive open online courses (MOOCs) has been an important initiative by Government of India in this direction. The present study conceptualizes various factors of e-Learner Satisfaction into one model. The data for study was collected from students of north Indian universities. A total of 266 responses were recorded out of which 25 responses were eliminated due to incomplete information. Final data analysis was conducted using 241 responses using structural equation modeling (SEM) (Amos 20). From the data, it was observed the constructs (predictors) namely Instructors Attitude, Learners Attitude, Course Quality, Technology Quality, Assessment Quality and Perceived ease of use explained 66.2% variance (adjusted R2 = 66.2% and p < 0.05) in Perceived e-Learner Satisfaction.
Access provided by Autonomous University of Puebla. Download conference paper PDF
Keywords
1 Introduction
Innovations in pedagogy and technology have lead to a new paradigm in teaching particularly in higher education. At the nexus of this new paradigm is blended learning and e-learning. Blended learning refers to the combination of synchronous and asynchronous learning activities. Blending learning is an approach to learning in which traditional face-to-face learning is complemented with online learning. The two most common definitions of blended learning prevalent in literature are (i) combination of online and face-to-face instructions [11 and 23] (ii) combining instructional methods [9, 25].
While e-learning refers to learning system that utilizes electronic means or Internet communication technology (ICT) to deliver information for education or training purposes. e-learning is defined as learning assisted by utilization of digital tools and content that involves interactivity that includes online interaction between teacher and learners or peers [17].
The institutions of eminence (Harvard, MIT) of higher education in world have started to offer most of the courses in online mode with India being no exception [14, 22]. Though in infancy e-learning in India has garnered pace in last decade, introduction of SWAYAM portal for offering massive open online courses (MOOCs) has been an important initiative by Government of India in this direction. e-learning has not remained confined to the higher education industry only; however of late many global organizations have started to incorporate online training modules to employees as part of their overall training programmes [21].
2 Theoretical Framework
e-learning is delivery of education through various electronic media (activities pertinent to instructing, learning, and teaching) [13]. “e-learning is an approach to teaching and learning, representing all or part of the educational model applied, that is based on the use of electronic media and devices as tools for improving access to training, communication and interaction” [24].
e-learning being ubiquitous offers array of benefits to make learning possible any time anywhere at learners convenience as it cuts across the barriers of space and time. Being cost-efficient, it has received a wide acceptance across the world in higher education dissemination [1]. On account of high utility and other benefits, the adoption of e-learning has been on increase with 7% CAGR in last decade. e-learning industry was $107 Billion in 2015, and it has been forecasted to grow to $ 325 Billion in 2025 (Forbes, Jul 2018). Despite this high growth, adoption, and success of e-learning, the failures in e-learning do exist [5, 19]. The reasons for such failures can be varied sometimes learner centric other time instructor or environment centric. From the literature, numerous models have been proposed to access the success and adoption of information systems [8, 28]. Among various proposed models, user satisfaction emerges as one of the most important factors for adoption and success of information systems [8]. In e-learning context, various factors have been found associated with user satisfaction. With regard to present research per se, e-learning and blended learning have been used interchangeably. And the factors associated with user satisfaction have been clubbed into six dimensions: Learner, Instructor, Course, Technology, Course Design, and Environment as identified by Sun et al. [26].
3 Research Model and Hypotheses
From simple application software acceptance like spreadsheet applications [16] to complex e-learning [22], various factors in literature have been identified that determine user satisfaction. However, not much attention has been paid to integrate these factors into one framework/model. An attempt in this regard was made by Sun et al. [26]. Drawing inferences from previous studies and using model proposed by Sun et al. [26], the present study uses six dimensions, namely learner, instructor, course, technology, course design, and environment dimensions to access user satisfaction of e-learning. However, a little modification has been done to the model as each dimension is reduced to a factor. The learner dimension takes into account Learners Attitude/impression toward the e-learning activities by usage of computers. A positive attitude toward ICT will result in effective and efficient learning thus more satisfied users/learners [20]. Thus, we hypothesize
-
H1: Learners Attitude will positively influence Perceived e-Learner Satisfaction.
The Instructor dimension takes into account Instructors Attitude/impression toward the e-learning, and we hypothesize
-
H2: Instructors Attitude toward e-learning positively influences Perceived e-Learner Satisfaction (Fig. 1).
Fig. 1 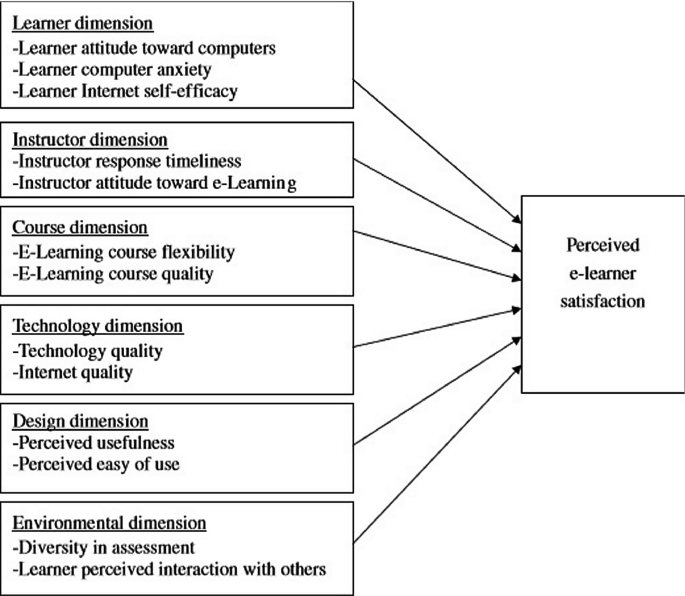
(adapted [26]
Dimensions and antecedents of e-learner satisfaction

The course dimension takes into account the e-learning course quality, technology dimension takes into account the technology quality, design dimension takes into account perceived ease of use of e-learning platform, and environment dimension takes into account diversity in assessment (quality of assessment) of e-learning. Thus, we hypothesize
-
H3: Course quality positively influences Perceived e-Learner Satisfaction.
-
H4: Technology quality positively influences Perceived e-Learner Satisfaction.
-
H5: Perceived ease of use of e-learning positively influences Perceived e-Learner Satisfaction.
-
H6: Diversity in assessment of e-learning positively influences Perceived e-Learner Satisfaction.
The actual simplified model used in the present study is reproduced in Fig. 2.

Simplified proposed research model
4 Research Methods
4.1 Instrument Development
Based on the research in the field of information systems and technology adoption, a questionnaire was adopted and modified to measure the various factors of the hypothesized model. The instrument with 30 items under 7 factors was adopted from Sun et al. [26] with modification by putting reverse order questions straightforward and by adding two additional items. The questionnaire consisting of 32 items measured under 7 factors is presented in Table 1 along with the references. Each measurement item on the scale was measured using seven-point Likert scale with (1) representing “very strongly disagree”, (2) representing “strongly disagree”, (3) representing “disagree”, (4) representing “neutral”, (5) representing “agree”, (6) representing “strongly agree” and (7) representing “very strongly agree”. The questionnaire was presented to two experts in information technology and marketing for expert comments and feedback. A pilot study was conducted with 30 postgraduate students with prior experience with e-learning systems.
4.2 Data Collection
For collecting data, an online survey was developed using online survey tools. The link to survey was emailed to postgraduate students of north Indian universities. The link to survey was also shared in three WhatsApp groups. A total of 275 links to survey were e-mailed. After initial and follow-up round of email, a total of 223 responses were generated. And 43 responses were also obtained from WhatsApp group. Out of the total responses, 25 responses were omitted due to incomplete information. A total of 241 responses (response rate = 87.63%) were put to analysis.
The demographic profile of the respondents is presented in Table 2. Out of total 241 respondents, 100 were females and 141 males with 23 years as an average age, while all the students were attending postgraduate course with most postgraduating students from management background followed by engineering and science background.
Statistical Package for the Social Sciences version 23 (SPSS v.23.0) and Amos (V 20) was used for the statistical analysis in this research. Stepwise regression analysis was used wherein 6 constructs, namely Instructors Attitude, Learners Attitude, Course Quality, Technology Quality, Assessment Quality and Perceived ease of use were used as repressors, and Perceived e-Learner Satisfaction were used as regress.
Kaiser-Meyer-Olkin (KMO) and Bartletts Tests were used to verify the factorability of the data. KMO and Bartlett’s sphericity test results were both significant (p < 0.001), and KMO value was found more than threshold (0.92).
5 Data Analysis and Results
5.1 Factor Analysis (Exploratory and Confirmatory Factor Analysis)
For scale development and validation, data was analyzed using two step process. In first step, an exploratory factor analysis was done on data. In exploratory factor analysis, data was subjected to principal component analysis with varimax rotation. All factor loadings above ±0.50 and with eigenvalues greater than 1 were considered. Item LA5, LA6, PS7, and PS8 had factor loadings less than 0.5 thus were dropped from further analysis. Seven (7) stable factors emerged with least or no cross loadings. Together, these 7 factors explained 65.6% variance (Table 3) in the dependent variable, namely Perceived e-Learner Satisfaction.
5.2 Reliability and Validity
The instrument developed was shared with experts to improve the face and content validity of instrument. Also, reliability/internal consistency of data was measured using Cronbach’s Alpha values for each construct. The Cronbach alpha coefficient of 0.7 or higher suggests high data reliability but a coefficient lower than 0.35 indicates poor reliability [6, 18]. All the values of Cronbach’s alpha were found to be more than 0.8 which is higher than the minimum threshold thus indicating high reliability.
The construct validity refers to the extent to which two constructs are separate. Since seven stable constructs emerged in factor analysis using PCA with varimax rotation with all factor loads on the respective construct more than 0.6, the constructs thus exhibit convergent validity [12]. The discriminatory validity has been verified by checking the correlation between different constructs. In none of the cases, correlation greater than 0.85 between constructs was reported, indicating discriminating validity among the constructs.
5.3 Structural Model and Hypotheses Testing
To test the hypothesized research model among various constructs, regression analysis was performed to determine casual relations. Among the demographic variables namely gender, age, and course, no significant differences or correlations with dependent variable namely Perceived e-Learner Satisfaction were found; thus, demographic variables were not considered for further analysis. For regression analysis, six variables namely Instructors Attitude, Learners Attitude, Course Quality, Technology Quality, Assessment Quality and Perceived ease of use were used as independent variables (repressors), and Perceived e-Learner Satisfaction was used as dependent variables (regress).
For testing proposed hypothesized model, structural equation modeling (SEM) has been used as our sample size was greater than 200 respondents [15]. SEM Amos 20 with maximum likelihood method was used for model estimation. The various structural model indices results are shown in Fig. 3. The various model fit indices found are NFI = 0.954, GFI = 0.966, CFI = 0.921, AGFI = 0.942, RMSEA = 0.052, RMR = 0.031. With all good fitness indices above 0.9 in model [4], thus these path coefficients (standardized) can be used to test hypotheses.

Structural model testing results (p < 0.001 in all relationships)
Among the proposed hypotheses after testing, following hypotheses were found significant among various constructs. Learners Attitude was found significantly effecting Perceived e-Learner Satisfaction (H1). Instructors Attitude was found significantly effecting Perceived e-Learner Satisfaction (H2). Course quality was found significantly effecting Perceived e-Learner Satisfaction (H3). Technology quality was found significantly effecting Perceived e-Learner Satisfaction (H4). Perceived ease of use of e-learning was found significantly effecting Perceived e-Learner Satisfaction (H5). Diversity in assessment of e-learning was found significantly effecting Perceived e-Learner Satisfaction (H6). The constructs (predictors) namely Instructors Attitude, Learners Attitude, Course Quality, Technology Quality, Assessment Quality, and Perceived ease of use explained 66.2% variance (Adjusted R2 = 66.2% and p < 0.05) in Perceived e-Learner Satisfaction. The hypotheses results are enumerated in Table 4.
6 Discussion and Implications
In present-day times, it has become important for educationists to impart or complement traditional learning with electronic media (e-learning) as it cuts across the time and space barriers. This present study tries to examine various factors that lead to students satisfaction by use of e-learning systems for knowledge dissemination or acquisition. All the hypotheses proposed in study were verified to be true. From the model, it can be observed that all the six proposed predictors namely Instructors Attitude, Learners Attitude, Course Quality, Technology Quality, Assessment Quality and Perceived ease of use have a significant positive influence on Perceived e-Learner Satisfaction. The results indicate good model fit indices with predictors explaining 66.2% variance in Perceived e-Learner Satisfaction. The prediction formula for the proposed model is presented under
In the above formula, PS stands for Perceived e-Learner Satisfaction, IA stands for Instructors Attitude, LA stands for Learners Attitude, CQ stands for Course Quality, TQ stands Technology Quality, AQ stands for Assessment Quality, and PE stands Perceived ease of use where as w1, w2, w3, w4, w5, and w6 are empirical weights.
6.1 Limitations and Implications for Future Research
This research makes a careful attempt to integrate various factors that influence Perceived e-Learner Satisfaction reported in literature into one model. Still, the proposed model may not be the comprehensive model to explain perceived satisfaction due to time, budget, and other resource constraint. The study identifies only single factor as dependent variable and measures it subjectively only, some objective measures like student score may be used in future research. The present study uses SEM for analysis in future study other tools like (stepwise regression, LISERL, PLS) and variance in results if any can be examined. Further, the other limitation of the study includes data which was collected from north Indian universities only which makes generalization of study little difficult. A cross-cultural study across continents may also be conducted that can highlight impact of culture in e-Learner satisfaction.
References
Adomi, E.E., Kpangban, E.: Application of ICTs in Nigerian secondary schools (2010)
Amoroso, D.L., Cheney, P.H.: Testing a causal model of end-user application effectiveness. J. Manag. Inf. Syst. 8(1), 63–89 (1991)
Arbaugh, J.B.: Virtual classroom characteristics and student satisfaction with internet-based MBA courses. J. Manag. Educ. 24(1), 32–54 (2000)
Bentler, P.M., Bonett, D.G.: Significance tests and goodness of fit in the analysis of covariance structures. Psychol. Bull. 88(3), 588 (1980)
Cook, D.A.: The failure of e-learning research to inform educational practice, and what we can do about it. Med. Teach. 31(2), 158–162 (2009)
Cuieford, J.P.: Fundamental Statistics in Psychology and Education, 4th edn. McGraw Hill Publication, New York, N.Y. (1965)
Davis, F.D.: User acceptance of information technology: system characteristics, user perceptions and behavioral impacts. Int. J. Man Mach. Stud. 38(3), 475–487 (1993)
DeLone, W.H., McLean, E.R.: Information systems success: the quest for the dependent variable. Inf. Syst. Res. 3(1), 60–95 (1992)
Garrison, D.R., Kanuka, H.: Blended learning: uncovering its transformative potential in higher education. Internet High. Educ. 7(2), 95–105 (2004)
Gattiker, U.E., Hlavka, A.: Computer attitudes and learning performance: issues for management education and training. J. Organ. Behav. 13(1), 89–101 (1992)
Graham, C.R.: Blended learning systems. The Handbook of Blended Learning, 3–21(2006)
Hair, J.F., Black, W.C., Babin, B.J., Anderson, R.E., Tatham, R.L.: Multivariate Data Analysis, vol. 5, no. 3, pp. 207–219. Prentice Hall, Upper Saddle River, NJ (1998)
Koohang, A., Harman, K.: Open source: a metaphor for e-learning. Infor. Sci. 8 (2005)
Lee, M.C.: Explaining and predicting users’ continuance intention toward e-learning: an extension of the expectation–confirmation model. Comput. Educ. 54(2), 506–516 (2010)
Loehlin, J.C.: Latent Variable Models: An Introduction to Factor, Path, and Structural Analysis. Lawrence Erlbaum Associates Publishers (1998)
Mathieson, K.: Predicting user intentions: comparing the technology acceptance model with the theory of planned behavior. Inf. Syst. Res. 2(3), 173–191 (1991)
Ministry of Communication and Technology of New Zealand: Digital strategy of the ministry of communication and technology (2008)
Nunnally, J.C., Bernstein, I.H.: Psychometric theory, vol. 226. McGraw-Hill, New York (1967)
Penna, M., Stara, V.: The failure of e-learning: why should we use a learner centred design. J. E-learning Knowl. Soc. 3(2), 127–135 (2007)
Piccoli, G., Ahmad, R., Ives, B.: Web-based virtual learning environments: a research framework and a preliminary assessment of effectiveness in basic IT skills training. MIS Q., 401–426 (2001)
Roca, J.C., Gagné, M.: Understanding e-learning continuance intention in the workplace: a self-determination theory perspective. Comput. Hum. Behav. 24(4), 1585–1604 (2008)
Roca, J.C., Chiu, C.M., Martínez, F.J.: Understanding e-learning continuance intention: an extension of the technology acceptance model. Int. J. Hum. Comput. Stud. 64(8), 683–696 (2006)
Rooney, J.E.: Knowledge infusion. Assoc. Manag. 55(5), 26 (2003)
Sangrà, A., Vlachopoulos, D., Cabrera, N.: Building an inclusive definition of e-learning: an approach to the conceptual framework. Int. Rev. Res. Open Distrib. Learn. 13(2), 145–159 (2012)
Singh, H., Reed, C.: A white paper: achieving success with blended learning. Centra Software 1, 1–11 (2001)
Sun, P.C., Tsai, R.J., Finger, G., Chen, Y.Y., Yeh, D.: What drives a successful e-Learning? An empirical investigation of the critical factors influencing learner satisfaction. Comput. Educ. 50(4), 1183–1202 (2008)
Thurmond, V.A., Wambach, K., Connors, H.R., Frey, B.B.: Evaluation of student satisfaction: determining the impact of a web-based environment by controlling for student characteristics. Am. J. Distance Educ. 16(3), 169–190 (2002)
Venkatesh, V., Morris, M.G., Davis, G.B., Davis, F.D.: User acceptance of information technology: toward a unified view. MIS Q., 425–478 (2003)
Webster, J., Hackley, P.: Teaching effectiveness in technology-mediated distance learning. Acad. Manag. J. 40(6), 1282–1309 (1997)
Author information
Authors and Affiliations
Corresponding author
Editor information
Editors and Affiliations
Rights and permissions
Copyright information
© 2020 Springer Nature Switzerland AG
About this paper

Cite this paper
Ali, A., Bhasin, J. (2020). A Model of Information System Interventions for e-Learning: An Empirical Analysis of Information System Interventions in e-Learner Perceived Satisfaction. In: Singh, P., Kar, A., Singh, Y., Kolekar, M., Tanwar, S. (eds) Proceedings of ICRIC 2019 . Lecture Notes in Electrical Engineering, vol 597. Springer, Cham. https://doi.org/10.1007/978-3-030-29407-6_66
Download citation
DOI: https://doi.org/10.1007/978-3-030-29407-6_66
Published:
Publisher Name: Springer, Cham
Print ISBN: 978-3-030-29406-9
Online ISBN: 978-3-030-29407-6
eBook Packages: EngineeringEngineering (R0)