
Abstract
Rheumatoid arthritis (RA) is a chronic autoimmune disease characterized by persistent synovial inflammation leading to tissue destruction and progressive loss of joint function. Here we describe two methods that can be used to assess the contribution of toll-like receptors (TLRs), and their potential ligands, to RA pathogenesis. We focus on the antigen-induced model of murine arthritis and human synovial tissue explant models. Both enable detection of TLR, and TLR ligand, expression, as well as investigation of the effect of inhibition of these molecules. Each offers a unique insight into disease; with murine models allowing kinetic analysis in live animals and explant models allowing examination of inflamed human tissue, which together can help us to dissect the role of TLRs in the onset and progression of RA.
Access provided by CONRICYT – Journals CONACYT. Download protocol PDF
Key words
- Toll-like receptor
- Endogenous ligands
- DAMPs
- Sterile inflammation
- Antigen-induced arthritis
- Human synovial tissue
- Rheumatoid arthritis
1 Introduction
The hallmarks of rheumatoid arthritis (RA) include synovial inflammation and destruction of joint cartilage and bone; mediated by persistent production of pro-inflammatory cytokines and matrix metalloproteinases (MMPs). Compelling evidence supports a role for TLRs in contributing to the aberrant inflammatory response observed in RA. On one hand, ex vivo and in vitro studies using human tissue and cells have shown expression and functionality of specific TLRs in RA joints. On the other hand, many in vivo experimental models of arthritis have demonstrated TLR ligand requirement for disease induction as well as disease amelioration in animals lacking specific TLRs. In particular, immunohistochemical and immunofluorescence analysis of synovial tissue obtained from RA patients at the time of joint replacement, and FACS and real-time PCR analysis of cells isolated from this tissue, revealed expression of TLRs 2–4 and 7–9 compared to normal or osteoarthritic synovium [1–5]. Moreover, ELISA-based measurement of levels of cytokines and metalloproteinases produced by these cells in culture showed TLRs 2–4 and 7–9 to be responsive to ligand stimulation [1, 5–7]. Both intact tissue explants from RA synovia, and mixed cell population cocultures isolated from RA tissue synthesize high levels of inflammatory mediators. These models have been used to show that antibody blockade of TLR2 [8] and TLR4 [9], chemical inhibition of endosomal TLRs, specifically TLR8 [5], and adenoviral transfection with dominant-negative forms of TLR adapter proteins MyD88 and Mal/TIRAP [7] can reduce the spontaneous production of cytokines. A range of murine models of arthritis, including collagen-induced arthritis (CIA), antigen-induced arthritis (AIA), IL1-receptor antagonist knockout model, serum transfer model, and microbial TLR ligand (e.g., LPS, bacterial DNA, streptococcal cell wall, and zymosan)-induced arthritis, have been used to examine TLR contribution to disease in vivo; typically using mice with targeted deletions in specific TLRs, for example TLR2, TLR4, TLR3, TLR7, and TLR9 [10–15]. Moreover, inhibitors of TLRs have shown therapeutic benefit in some of these models, for example, TLR4 [15, 16] and TLR7, 8, and 9 [17–19]. Together these data indicate that the activation of a number of TLRs drives persistent inflammation in RA (reviewed in Refs. [20, 21]).
These models have also been used to try to answer the question of which ligands drive TLR activation in disease. In particular, activation of TLRs by endogenous molecules generated upon tissue damage, damage-associated molecular patterns (DAMPs), is of interest in this autoimmune disease. The destructive environment of the RA joint harbors high levels of DAMPs, including intracellular molecules released during necrosis (e.g., HMGB1, nucleic acids) and extracellular matrix (ECM) molecules that are specifically upregulated upon injury (e.g., tenascin-C and biglycan) or degraded following tissue damage (e.g., low molecular weight hyaluronan) [22, 23]. Some of these ligands have been shown to enhance spontaneous cytokine synthesis upon addition to human RA cell populations, as well as being essential for the progression of disease in murine models of RA, as in the case of tenascin-C [24]. For other ligands, their inhibition in vivo during experimental arthritis, as shown for HMGB1, HSP90, or neutrophil elastase [25–27], ameliorates disease. Moreover, a number of these activators were shown to be arthritogenic upon injection into mice, and for many this process was dependent on expression of TLR4 [24, 28–30]. Together these data show that a wide variety of TLR ligands likely contribute to inflammation in the RA joint (reviewed in Ref. [22]).
In this chapter we discuss two different techniques to examine TLR and TLR ligand involvement in RA. One murine model that has emerged as being useful for analysis of TLR driven inflammation in vivo is antigen induced arthritis (AIA). Originally developed in rabbits by Dumonde et al. [31], the AIA model was established later in the mouse by Brackertz et al. [32], and characterized and optimized by van den Berg et al. [33, 34]. We describe here a modified protocol for AIA induction, and detail evaluation of arthritis by histological analysis, relative quantification of pro-inflammatory cytokine gene expression by real-time PCR and assessment of DAMP expression by western blot analysis. We also describe how to administer TLR ligands to mice joints to assess their arthritogenic potential.
Both AIA and the more widely used collagen-induced arthritis (CIA) mimic disease symptoms seen in human RA, for example infiltration of inflammatory cells in the synovium, synovial hyperplasia, immune complex deposition in the cartilage, and progressive cartilage and bone destruction [32, 33]. However, where CIA manifests as a systemic polyarthritic disease, AIA is a more localized, monoarthritic disease. The induction of arthritis exclusively in the injected joint, does allow comparison of arthritic changes with a normal contralateral joint from the same mouse. Moreover AIA has other advantages including (1) it can be induced in any mouse strain [32], (2) disease induction is not affected by the mouse sex [32]; (3) 100 % disease incidence; (4) onset of disease occurs at a defined time, facilitating kinetic studies; (5) disease severity can be controlled by the dose of intra-articularly injected antigen; (6) episodes of exacerbation and remission occurring in RA patients can be mimicked by controlled rechallenge with antigen. However, both animal models of RA progress significantly more rapidly than the human disease and are characterized mostly by acute inflammatory responses, necessitating complementary approaches to examine some aspects of disease.
Ex vivo models of the human disease that consists of the culture of cells from RA synovial membranes from patients undergoing joint replacement surgery can be helpful in obtaining a picture of late stage human disease. Originally described by Brennan et al. [35], this system led to the discovery that arthritic joints have elevated levels of pro-inflammatory cytokines [36], and provided the rationale for testing TNF-α blockade in RA [37]. Here, we provide a detailed description of the protocol to isolate, phenotype and culture RA membrane cells, which represent a mixed population of all synovial cell types that spontaneously produce high amounts of pro-inflammatory mediators. Furthermore, we describe the protocol for TLR activation, inhibition and expression as well as cytokine level quantification. A major advantage of this model is that the cells continue to release cytokines in short term culture (~up to 3 days), presenting an opportunity to study pathological processes that drive inflammation and allowing the study of disease intervention and efficacy of novel therapeutics. Two prominent disadvantages are that the nature of this model requires disruption of intact tissue and therefore certain important cell contact dependant processes. Secondly, not all cell populations from the intact synovium are fully represented following dissociation (e.g., neutrophils and endothelial cells). The current protocol may be modified to favor retention of additional subsets.
2 Materials
2.1 Induction of Arthritis
2.1.1 Antigen-Induced Arthritis (AIA)
-
1.
Inbred mice strains of relevant phenotypes, including single TLR and DAMP knockout mice, 10–12 weeks of age, housed under conditions approved by the European Directive 2010/63/EU and the institutional health committee, including regular night-day cycling, 21 °C, individual cage ventilation and free access to autoclaved bedding, food, and water.
-
2.
Methylated bovine serum albumin (mBSA). Store at 4 °C.
-
3.
Freund’s complete adjuvant (FCA). Store at 4 °C.
-
4.
Concentrated 10× phosphate buffered saline (PBS; VWR). Store at room temperature.
-
5.
0.20 μm syringe filters.
-
6.
Hypnorm (VetaPharma Ltd, Leeds, UK). Store at room temperature.
-
7.
Sterile water for injections. Store at room temperature.
-
8.
Syringes (10 and 1 ml).
-
9.
Sterile Microlance needles (27 G × ½ in. and 23 G × 1 in.) for intraperitoneal and subcutaneous injections, respectively.
-
10.
0.3 ml MicroFine demi insulin syringes.
-
11.
30 G × 8 mm needles for intra-articular injections.
-
12.
Electric clippers.
2.1.2 TLR-Induced Arthritis
-
1.
Inbred mice strains of relevant phenotypes, 10–12 weeks of age (see Subheading 2.1.1., item 1).
-
2.
Recombinant DAMP (see Table 1) with levels of LPS < 10 pg/ml. Store at −80 °C.
Table 1 DAMPs administered intra-articularly -
3.
Limulus Amebocyte Lysate (LAL) assay QCL-1000™ (Lonza), including lyophilized lysate prepared from the circulating amebocytes of the horseshoe crab Limulus Polyphemus, E. coli 0111:B4 endotoxin, chromogenic substrate and LAL reagent water. Store at 4 °C.
-
4.
Concentrated 10× phosphate buffered saline (PBS; VWR). Store at room temperature.
-
5.
Hypnorm (VetaPharma Ltd, Leeds, UK). Store at room temperature.
-
6.
Sterile water for injections. Store at room temperature.
-
7.
1 ml syringes.
-
8.
27 G × ½ in. sterile Microlance needles for intraperitoneal injections.
-
9.
0.3 ml MicroFine demi insulin syringes.
-
10.
30 G × 8 mm needles for intra-articular injections.
2.2 Immunohistochemistry
-
1.
Sharp scissors.
-
2.
Fixation solution for freshly isolated knee joints: 10 % (vol/vol) neutral buffered formalin.
-
3.
Decalcification of knee joints: 10 % EDTA (Sigma-Aldrich) in PBS.
-
4.
Paraffin wax processing: graded series of ethanol 70, 95 and 100 %, xylene (certified ACS; Fisher Scientific) and wax (Paraplast X-tra, Sigma-Aldrich). Ethanol and xylene are stored with flammables at room temperature.
-
5.
SuperfrostTM Plus Slides (Menzel-Gläser, Braunschweig, Germany).
-
6.
Dewaxing of paraffin sections: xylene and ethanol 100 % (see item 4).
-
7.
Hematoxylin and eosin (H and E) staining: hematoxylin (Sigma-Aldrich); 0.3 % acid alcohol (combine 997 ml ethanol 70 % with 3 ml of 1 M HCl solution); ammonia water (add 1.6 ml of 1 M NH4OH to 600 ml of tap water) and eosin (Sigma-Aldrich).
-
8.
Safranin-O staining: hematoxylin; 0.3 % acid alcohol (see item 7); ammonia water (see item 7); 0.1 % fast green FCF (Sigma-Aldrich); 1 % acetic acid; 0.1 % safranin-O (Sigma-Aldrich), and 0.1 % fast green (Fisher Scientific).
-
9.
Dehydration of tissue sections: ethanol 100 % and xylene (see item 4).
-
10.
DPX mountant (Sigma-Aldrich). Store at room temperature.
-
11.
Coverslips 20 × 40 mm.
2.3 Real-Time PCR
-
1.
Sharp scissors.
-
2.
Liquid nitrogen (use an appropriate, non-sealed, liquid nitrogen container, wear proper safety gear and use liquid nitrogen in a well-ventilated area).
-
3.
BioPulverizer (BioSpec Products, USA; see Fig. 1).
Fig. 1 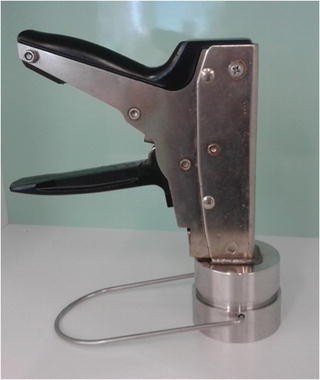
Appearance of BioPulverizer (BioSpec Products, USA) used for pulverizing knee joints for Real-Time PCR and western blot analysis
-
4.
RLT buffer (Qiagen).
-
5.
QIAshredder (Qiagen).
-
6.
RNeasy Mini kit (Qiagen).
-
7.
AffinityScript™ Multiple Temperature cDNA synthesis kit (Stratagene), includes AffinityScript™ multiple temperature reverse transcriptase, 10× AffinityScript™ RT buffer, RNase block ribonuclease inhibitor (40 U/μl), oligo(dT) primer (0.5 μg/μl), dNTPs (100 mM; 25 mM each dNTP), and RNase-free water.
-
8.
Real-Time PCR system (Applied Biosystems Viia 7™ or Rotor-Gene 6000, Corbett Life Science, now Qiagen).
-
9.
TaqMan primers and probes: mouse TNF-α (dye: FAM/TAMRA; Mm99999068_m1; Applied Biosystems); mouse CXCL1 (dye: FAM/TAMRA; Mm00433859_m1; Applied Biosystems); and mouse HPRT1 (dye: FAM/TAMRA; Mm00446968_m1; Applied Biosystems). Store at −20 °C.
-
10.
TaqMan PCR master mix: 2× reaction buffer containing AmpliTaq Gold® DNA polymerase, uracil-DNA glycosylase, dTNPs with dUTP, ROX™ passive reference, and AmpErase® UNG (Applied Biosystems). Store at −20 °C.
-
11.
RNase-free water.
-
12.
384-well MicroAmp® Optical microplates (Applied Biosystems) or 0.1 ml strip tubes and caps (Qiagen).

2.4 Western Blot Analysis
2.4.1 SDS-PAGE
-
1.
T-PER tissue protein extraction reagent (Thermo Scientific). Store at room temperature.
-
2.
Protease inhibitor cocktail (Sigma-Aldrich). Store at −20 °C.
-
3.
Ultrasonic processor (Vibra-Cell VCX130, Sonics & Materials, USA).
-
4.
Resolving gel buffer: 1.5 M Tris–HCl, pH 8.8.
-
5.
Stacking gel buffer: 1 M Tris–HCl, pH 6.8.
-
6.
Thirty per cent (v/v) acrylamide–bis solution (37.5:1). Acrylamide is a potent neurotoxin and gloves should be worn at all times.
-
7.
N,N,N,N′-tetramethyl-ethylenediamine (TEMED, Sigma-Aldrich).
-
8.
Ammonium persulfate: make a 10 % solution in water and store in aliquots at −20 °C.
-
9.
Water-saturated butanol: mix equal volumes of water and isobutanol in a glass container and shake vigorously. Allow to separate into upper (isobutanol) and lower (water) phases overnight. Use the upper top layer. Store at room temperature.
-
10.
Running buffer (10×): 250 mM Tris, 1.92 M glycine, and 10 % SDS. Confirm pH is 8.3 but do not alter due to the presence of SDS. Store at room temperature.
-
11.
Modified Laemmli buffer (5×): 250 mM Tris–HCl, pH 8, 10 % SDS, 50 % glycerol, 0.005 % bromophenol blue, and 25 % β-mercaptoethanol.
-
12.
Pre-stained molecular weight marker (broad range molecular weight markers, New England Biolabs). Store in aliquots at −20 °C.
2.4.2 Immunoblotting
-
1.
Transfer buffer (10×): 250 mM Tris–HCl, 1.92 M glycine. Before transfer, dilute to 1× with deionized water and add methanol (stored with flammables at room temperature) to 20 %. The buffer may be stored at 4 °C.
-
2.
Nitrocellulose membrane (GE Healthcare).
-
3.
Concentrated 10× phosphate buffered saline (PBS; VWR). Store at room temperature.
-
4.
PBS containing Tween 20 (PBS-T). Dilute a 10× solution of PBS to 1× with deionized water and add Tween 20 to a final concentration of 0.1 % (v/v).
-
5.
Blocking buffer: 5 % (w/v) bovine serum albumin (BSA) in PBS-T.
-
6.
Antibody diluent: 2 % BSA in PBS-T.
-
7.
Primary antibody raised against the protein of interest. For instance, here we use anti-tenascin-C rat monoclonal (MTn-12) antibody (Sigma-Aldrich).
-
8.
Anti-actin goat polyclonal antibody (Santa Cruz Biotechnology).
-
9.
Horseradish peroxidase conjugated anti-rat IgG secondary antibody (Sigma-Aldrich).
-
10.
Horseradish peroxidase conjugated anti-goat IgG secondary antibody (R&D Systems).
-
11.
Enhanced chemiluminescent (ECL) substrate (immediately before use, combine solution 1 and solution 2 [1:1], GE Healthcare). Store at 4 °C.
-
12.
Stripping buffer: Re-Blot Plus Strong 10× solution (Chemicon). Dilute to 1× with deionized water.
-
13.
Fuji Medical X-ray film (FUJIFILM).
2.5 Synovial Tissue Preparation
RA synovial membrane tissue was obtained from patients who fulfilled the American College of Rheumatology criteria for RA [38] and were used with the informed consent of the patients. Ethics approval was obtained from the London Riverside Research Ethics Committee (REC reference nos. 1752 and 07/H0706/81). RA synovial membrane tissue was collected at the time of joint replacement surgery/synovectomy preparation from Elective Orthopaedic Centre, Epsom and St Helier University Hospitals, UK, Royal United Hospital Bath and Royal Free Hospital NHS Trust, London, UK (see Note 1 ).
-
1.
Collagenase NB1 Premium Grade and neutral protease (SERVA, AMS Biotechnology Europe Ltd., Abingdon, UK). Store at 4 °C.
-
2.
Liberase TL Research Grade (Roche Diagnostics, Mannheim, Germany). Store at −20 °C.
-
3.
DNase I (Roche Diagnostics, Mannheim, Germany). Store at 4 °C.
-
4.
RPMI 1640 (Gibco, Life Technologies, Paisley, UK) supplemented with 10 % heat-inactivated fetal calf serum (HIFCS) (Labtech, Uckfield, UK) and 1 % penicillin–streptomycin (Lonza, Verviers, Belgium).
-
5.
Double layer Cell Microsieves 200 μm pore (Fisher Scientific, Loughborough, UK), placed over a small beaker, fixed in place with autoclave tape, then autoclaved to sterilize.
-
6.
CaN2O6 (Sigma-Aldrich).
-
7.
Red Blood Cell Lysis buffer (Sigma-Aldrich).
2.6 Phenotype Analysis
-
1.
Cell fixation buffer: cytofix (Becton Dickinson, Oxford, UK).
-
2.
Precooled washing buffer: PBS (Gibco, Life Technologies, Paisley, UK) supplemented with 2 % FBS (Labtech, Uckfield, UK) and 0.01 % NaN3 (Sigma-Aldrich).
-
3.
Antibodies: all Becton Dickinson unless specified; CD14 APC and CD56 PE(ebioscience), NK p46 PE, HLA-DR PE, CD90 FITC, CD15 Cy7, CD20 FITC, CD3 APC, CD4 APC-H7, CD8 PE Cy5, CD25 v450, CD11c V450, CD45 PER-CP, and CD163 APC (BioLegend, London, UK).
-
4.
Viability assay: LIVE/DEAD fixable Aqua dead cell kit (Life Technologies, Paisley, UK).
2.7 Synovial Cell Culture
-
1.
Ligands: TLR2/6 agonist, FSL-1 (10 ng/ml); TLR 3 agonist, Polyinosinic-polycytidylic acid (poly(I:C)) high molecular weight (HMW) (20 ng/ml); TLR5 agonist, flagellin (10 ng/ml); TLR7 agonist, R847/ Imiquimod (1 μg/ml); TLR7/8 agonist, R848 (1 μg/ml) and TLR9 agonist, ssDNA / LyoVec (50 ng/ml) (Invivogen, San Diego, CA, USA). Store at −20 °C.
-
2.
TLR4 agonist: ultrapure LPS derived from E. coli (10 ng/ml) (Alexis, Enzo Life Sciences, Exeter, UK). Store at 4 °C.
-
3.
RPMI 1640 (Gibco, Life Technologies, Paisley, UK) supplemented with 10 % heat-inactivated FCS (Labtech, Uckfield, UK) and 1 % penicillin–streptomycin (Lonza, Verviers, Belgium).
-
4.
Costar 96-well tissue culture plate (Corning, NY, USA).
-
5.
AdEasy Adenoviral Vector Systems (Agilent Technologies, Santa Clara, CA, USA).
2.8 Cytokine Analysis
2.8.1 ELISA
-
1.
Costar 96-well EIA/RIA plate and plate sealer (Corning, NY, USA).
-
2.
Antibodies: purified mouse anti-human TNF-α; biotinylated mouse anti-human TNF-α; purified mouse anti-human IL-8 and biotinylated mouse anti-human IL-8 (BD Biosciences, Becton Dickinson, Oxford, UK). Store at 4 °C.
-
3.
Recombinant TNF-α and IL-8 (Peprotech, London, UK). Store at −20 °C.
-
4.
Bovine serum albumin.
-
5.
Tween 20.
-
6.
Stop solution: 0.128 M sulfuric acid.
-
7.
10× PBS (Sigma-Aldrich).
-
8.
Streptavidin–HRP (R&D Systems, Oxon UK).
-
9.
TMB substrate (KPL Gaithersburg, MD, USA).
-
10.
Multiscan Ascent microplate reader (Thermo Scientific).
2.8.2 Mesoscale Discovery (MSD) Platform
-
1.
MMP 3 plex plate (MMP1, MMP3, MMP9) custom plates as per customer design. All reagents supplied with kit.
3 Methods
3.1 Induction of Arthritis
3.1.1 Antigen-Induced Arthritis (AIA)
-
1.
Preparation of antigen. Transfer 10 ml of FCA in a small, sterile plastic vial. In a separate vial, make a mBSA stock solution by dissolving 20 mg mBSA in 9 ml of sterile water and then add 1 ml of 10× PBS to obtain a 10 ml of a 2 mg/ml mBSA solution. Aspirate this solution with a 10 ml syringe, attach a 23 G × 1 in. needle on the syringe, press the syringe plunger to inject with force the solution in the 10 ml of CFA previously prepared. Emulsify this white oil–water emulsion by repeatedly aspirating and flashing with a 1 ml syringe to homogeneity or until the emulsion is thick enough to remain in the vessel when inverted (see Note 2 ).
-
2.
Sedation of mice. Dilute Hypnorm 1:10 (vol:vol) in sterile water for injections. Sedate 10- to 12-week old mice with an intraperitoneal (i.p.) injection of 150–200 μl diluted Hypnorm using a 27 G × ½ in. needle (see Notes 3 and 4 ).
-
3.
Immunization of mice (see Note 5 ). Gently shave the rumps of the mice with electric clippers to completely remove the fur at the base of the tail. Inject 100 μl in total of the emulsion intradermally at two sites at the base of the tail using a 1 ml syringe with a 23 G × 1 in. needle (see Notes 6 and 7 ).
-
4.
Induction of arthritis. Seven days later, mice are sedated (see step 2) and unilateral arthritis is induced by intra-articular injection of mBSA in PBS into the right knee joint. Prepare a 40 mg/ml mBSA stock solution using sterile water and dilute it 1:2 (vol:vol) in PBS. Before injection, sterilize the solution using a 0.20 μm syringe filter. Gently shave the right leg of the mice with electric clippers to completely remove the fur around the knee joint.
Inject 200 μg of mBSA in PBS (10 μl total volume) into the intra-articular space of the knee joint (see Fig. 2 and Note 8 ). Control mice are injected intra-articularly with 10 μl of PBS, while the contralateral, left joint functions as untreated control.
Fig. 2 
Intra-articular injection into the cavity of the knee joint. Syringe positioning to locate correct injection site (A) and insert the needle into the cavity of the knee joint (B)
-
5.
Monitor mice every day after the intra-articular injection. Knee swelling should be evident 24 h after the injection (see Note 9 ).

3.1.2 TLR-Induced Arthritis
-
1.
Preparation of DAMP. In order to avoid TLR activation by endotoxin contamination of endogenous TLR ligands, a LAL test should be carried out to quantify endotoxin levels in recombinant DAMPs according to the manufacturer’s instructions (LAL assay QCL-1000™). Only preparations with endotoxin levels <1 EU/ml should be injected in the mouse. Dilute DAMP of choice (see Table 1) in sterile PBS to the desired concentration (e.g., 0.1 mg/ml FBG).
-
2.
Induction of arthritis. Mice are sedated (see Subheading 3.1.1, step 2) and unilateral arthritis is induced by intra-articular injection of the DAMP of choice into the right knee joint. Gently shave the right leg of the mice with electric clippers to completely remove the fur around the knee joint. Inject 1–10 μg of DAMP in PBS (10 μl total volume) into the intra-articular space of the knee joint (see Fig. 2 and Note 8 ). Control mice are injected intra-articularly with 10 μl of PBS, while the contralateral, left joint functions as untreated control. Induction of joint inflammation by the C-terminal fibrinogen-like (FBG) domain of the extracellular matrix glycoprotein tenascin-C (see Table 1) is shown in Fig. 3 as an example.
Fig. 3 
Sections of the knee joints of wild type (A-B) and TLR4−/− (C) mice 3 days after intra-articular injection of PBS (A) or 1 μg FBG (B-C) stained with H and E. Sections show inflammatory cell infiltration, mild synovitis, and pannus formation exclusively in wild type mice injected with FBG [24]
-
3.
Monitor mice every day after the intra-articular injection. Knee swelling should be evident 24 h after the injection (see Note 9 ).

3.2 Immunohistochemistry
-
1.
Mouse knee joints are excised 1, 3 or 7 days after intra-articular injection by removing the skin and subcutaneous tissue, cutting longitudinally the muscles that cover the front and side of the femur and the side of the tibia and cutting the femur 1–2 mm above the knee joint and the tibia 1–2 mm below the patella. Carefully remove muscle tissue in excess without damaging the knee joint.
-
2.
Fix the freshly isolated knee joints in 10 % (vol/vol) neutral buffered formalin for 48 h at room temperature.
-
3.
Decalcify the knee joints in 10 % EDTA/PBS for 4 weeks, changing the solution three times per week (see Note 10 ).
-
4.
Embed the tissue in paraffin wax using a cycle on an automatic tissue processing machine (e.g., a representative cycle is ethanol 70 % for 90 s at 40 °C, 5× ethanol 100 % for 90 s at 40 °C, 3× xylene 90 s at 40 °C and paraffin for 90 s at 63 °C).
-
5.
Cut coronal tissue sections at a thickness of 4 μm at seven depths throughout the joint, 80 μm apart. Mount sections onto glass microscope slides made to ensure firm electrostatic attraction of paraffin sections (e.g., Superfrost™ Plus Slides). Let the tissue sections air-dry for 1 h or until dry and place them in an oven at 60 °C overnight. This will help with adherence of the sections to the slides.
-
6.
Dewax sections in xylene (2 × 5 min) and rehydrate through ethanol 100 % (2 × 1 min) followed by 1 min in tap water.
-
7.
H and E staining: place slides in hematoxylin for 6 min and 30 s and rinse under tap water for 2 min; dip slides 2–3 times in 0.3 % acid alcohol for 40 s and rinse under tap water for 2 min; dip slides 8–10 times in ammonia water for 1 min and rinse under tap water for 1 min; finally, place slides in eosin for 1 min and 45 s and rinse under tap water for 3 min. See Fig. 4a as an example of the results that can be produced.
Fig. 4 
Sections of the knee joints of 129/sv mice 7 days after intra-articular injection of mBSA stained with H and E (A) and safranin-O (B). Sections show inflammatory cell infiltration in the joint space, synovial hyperplasia, pannus formation, destruction of articular cartilage, and bone erosion [24]
-
8.
Safranin-O staining: place slides in hematoxylin for 30 s and rinse under tap water for 2 min; dip slides 2–3 times in 0.3 % acid alcohol for 20 s and rinse under tap water for 2 min; dip slides 8–10 times in ammonia water for 1 min and rinse under tap water for 1 min; place slides in 0.1 % fast green for 6 min followed by 1 % acetic acid for 15 s and rinse under tap water for 2 min; finally, place slides in 0.1 % safranin-O for 5 min and rinse under tap water for 1 min. See Fig. 4b as an example of the results that can be obtained.
-
9.
Dehydrate samples by transferring slides to 100 % ethanol (3 × 1 min) and then to xylene (2 × 1 min).
-
10.
Remove slides from xylene and apply DPX mountant and coverslips using an automated coverslipping machine (see Note 11 ).
-
11.
Histological analysis of H and E and safranin-O stained sections is performed using a light microscope, a camera and image acquisition software (e.g., BX51 microscope, Olympus; 18.2 Color Mosaic camera, Diagnostic Instruments; Spot Advanced or DP Manager acquisition software) (see Note 12 ). Score histopathological changes using the following parameters as previously described [39]. Grade the influx of inflammatory cells into synovium (infiltrate) and the joint cavity (exudate) with an arbitrary scale from 0 (no inflammation) to 3 (severe inflammation). Determine chondrocyte death as the percentage of cartilage area containing empty lacunae in relation to the total area and cartilage surface erosion as the amount of cartilage lost in relation to the total cartilage area. Assess bone destruction in ten different areas of the total knee joint section and grade it on an arbitrary scale of 0 (no damage) to 3 (complete loss of bone structure). Calculate the mean score for each mouse in an experimental group by averaging the histopathological scores in at least five section depths per joint.

3.3 Real-Time PCR
3.3.1 RNA Preparation
-
1.
Excise mouse knee joints at day 1, 3, or 7 after intra-articular injection (see Note 13 ), carefully removing muscle tissue, and immediately freeze them in liquid nitrogen. Maintain tissues at −80 °C until pulverization is carried out using a BioPulverizer (see Fig. 1) following manufacturer’s instructions.
-
2.
Lyse pulverized tissue by adding 700 μl of RLT buffer (included in the RNeasy mini kit) per sample.
-
3.
Extract and purify total RNA according to manufacturer’s instructions (RNeasy Mini kit) including homogenization of tissue lysate with a shredder (QIAshredder Homogenizer) (see Note 14 ).
-
4.
Assess total RNA concentration and purity by measuring the sample absorbance at 260 nm and the ratio of absorbance at 260 and 280 nm respectively, using a spectrophotometer.
-
5.
Using the AffinityScript™ Multiple Temperature cDNA synthesis kit, reverse transcribe 500 ng total RNA into cDNA with oligo(dT) primers (see Note 15 ) according to manufacturer’s instructions.
-
6.
Dilute cDNA 1:3 (vol:vol) in RNase-free water.
3.3.2 Real-Time PCR
-
1.
Prepare TNF-α, CXCL1 and HPRT1 TaqMan reaction mix for each cDNA sample (10 μl per sample per well/tube, in triplicates). For each sample, pipette 1.5 μl of RNase-free water, 5 μl of 2× TaqMan PCR master mix, 0.5 μl of 20× TaqMan primers and probe set and 3 μl of diluted cDNA. Seal microplates and centrifuge the reaction briefly to force the solution to the bottom and to remove any air bubble (see Note 16 ). Transfer the microplate to the Applied Biosystems Viia 7™ Real-Time PCR system or to the Rotor-Gene 6000 instrument.
-
2.
Analyze relative expression of gene of interest by using the endogenous control HPRT1 to normalize the results, according to the comparative threshold cycle (C t) method for relative quantification, as indicated by the manufacturer. Calculate the differences in C t values (ΔC t) between the sample and the endogenous control. Finally, calculate relative expression levels according to the change-in-threshold (ΔΔC t = ΔC t [injected knee sample] − ΔC t [untreated knee sample]. An example of results generated is reported in Fig. 5.
Fig. 5 
TNF-α and CXCL1 mRNA induction in the right and contralateral control knee of Tnc+/+ and Tnc−/− mice 1, 3, 5, and 7 days after intra-articular injection of mBSA

3.4 Western Blot Analysis
3.4.1 SDS-PAGE
-
1.
Follow step 1 in Subheading 3.3.1.
-
2.
Prepare lysis buffer by adding 1 μl of protease inhibitor cocktail to 1 ml of T-PER tissue protein extraction reagent and keep it on ice.
-
3.
Lyse pulverized tissue by resuspending it in ice-cold T-PER tissue protein extraction reagent containing protease inhibitor in a 1.5 ml Eppendorf tube at a final concentration of 100 mg/ml.
-
4.
Sonicate samples on ice using the following program: 80 s total time; pulse ON for 10 s; pulse OFF for 30 s; amplitude 40 %.
-
5.
Centrifuge samples at 10,000 rpm for 5 min at 4 °C using a microcentrifuge and transfer supernatant to a fresh 1.5 ml Eppendorf tube. Keep samples on ice at all times. If not proceeding immediately to immunoblotting, store samples at −80 °C.
-
6.
Determine the protein concentration of each sample using either the Coomassie (Bradford) or bicinchoninic acid (BCA) protein assay and adjust total protein concentration by adding ice-cold T-PER reagent as appropriate to ensure equal protein loading. Add 12.5 μl 5× Laemmli buffer to 50 μl lysate and boil the samples for 10 min at 95 °C and centrifuge them at maximum speed for 5 min.
-
7.
SDS-PAGE is carried out using the Laemmli method [40] and the following instructions assume the use of the Atto Electrophoresis system.
-
8.
Glass plates are assembled according to manufacturer’s instructions.
-
9.
Prepare a 1 mm thick, 5 % gel (see Note 17 ) by mixing 1.875 ml of 4× separating buffer, with 1.25 ml acrylamide–bis solution, 4.375 ml water, 25 μl APS, and 5 μl TEMED. Pour the gel between clean glass plates, leaving space for a stacking gel (~1.5 cm). Overlay with water-saturated isobutanol to obtain a smooth surface. Let gel polymerize at room temperature for 30 min.
-
10.
Remove the isobutanol, rinse the top of the gel with deionized water and carefully remove any residual water with Whatman paper.
-
11.
Prepare the stacking gel by mixing 0.625 ml 4× stacking buffer with 0.325 ml acrylamide–bis solution, 1.5 ml water, 12.5 μl APS, and 2.5 μl TEMED. Pour the stacking gel on top of the separating gel, insert a comb and let polymerize at room temperature for 30 min.
-
12.
Remove the comb, rinse the wells with deionized water and fill them with 1× running buffer.
-
13.
Place the gels in the tank filled with 1× running buffer and load samples for analysis of tenascin-C (or other endogenous TLR ligands). Include one well with pre-stained molecular weight marker and one with mouse embryonic fibroblast cell lysates as positive control.
-
14.
Finalize the assembly of the gel unit and connect to the power supply. Run the gel at 100–200 V for 1–1.5 h.
3.4.2 Immunoblotting
-
1.
Transfer the protein samples that have been separated by SDS-PAGE to nitrocellulose membranes using a semi-dry blotting system (Bio-Rad).
-
2.
Soak two sponges, two sheets of Whatman paper and one nitrocellulose membrane per gel in ice-cold 1× transfer buffer.
-
3.
Disconnect the gel unit from the power supply and disassemble it. Remove and discard the stacking gel. Lay sponges, paper, membrane and gel on the surface of the blotting device in the following order to form a sandwich: one sponge, one sheet of Whatman paper, one membrane, one gel, one sheet of Whatman paper, and one sponge.
-
4.
Once the assembly of the blotting device is complete, transfer at 150 mA for 1.5 h.
-
5.
When transfer is complete, incubate the membrane in 5 ml blocking buffer for 1 h at room temperature on a shaker set at 70 rpm
-
6.
Discard blocking buffer and replace it with 1:1000 dilution of the anti-tenascin-C antibody in antibody diluent. Incubate overnight at 4 °C on a shaker set at 70 rpm.
-
7.
Discard the primary antibody and wash the membrane three times for 10 min each with 10 ml PBS-T at room temperature on a shaker set at 70 rpm.
-
8.
Incubate the membrane with a 1:50,000 dilution of the secondary antibody in antibody diluent for 1 h at room temperature on a shaker set at 70 rpm.
-
9.
Discard the secondary antibody and wash the membrane three times for 10 min each with 10 ml PBS-T at room temperature on a shaker set at 70 rpm.
-
10.
Mix 1 ml of each solution of the ECL substrate and add it immediately to the membrane and incubate for 2 min at room temperature on a shaker set at 70 rpm.
-
11.
Drain excess ECL substrate and place the membrane between two transparent plastic leaves in an X-ray film cassette and expose to an X-ray film for 1 min at a start. Increase or decrease exposure time if signal is too weak or too strong, respectively.
-
12.
Strip the membrane by incubating it with stripping buffer for 15 min at room temperature on a shaker set at 70 rpm.
-
13.
Remove the stripping buffer and store it at 4 °C for subsequent use. Block the membrane twice for 5 min with blocking buffer at room temperature on a shaker set at 70 rpm.
-
14.
Discard the blocking buffer and replace it with 1:200 dilution of the anti-actin antibody in antibody diluent. Incubate overnight at 4 °C on a shaker set at 70 rpm.
-
15.
Discard the primary antibody and wash the membrane three times for 10 min each with 10 ml PBS-T at room temperature on a shaker set at 70 rpm.
-
16.
Incubate the membrane with a 1:5000 dilution of the secondary antibody in antibody diluent for 1 h at room temperature on a shaker set at 70 rpm.
-
17.
To detect actin, follow steps 9–11 as in Subheading 3.4.2. An example of the results obtained is showed in Fig. 6.
Fig. 6 
Tenascin-C protein levels in the joint were assessed 1, 3 and 7 day after intra-articular injection by western blot analysis of equal amounts of total joint lysate with a rat monoclonal antibody to mouse tenascin-C (TN-C). Mouse embryonic fibroblast cell lysate was used as a positive control (+) and non-injected mice as a negative control (c). Blots were re-probed with an antibody to actin to demonstrate equal protein loading in each lane (actin)

3.5 Synovial Tissue Preparation
3.5.1 Enzyme Preparation
-
1.
Adjust Collagenase NB1 to a concentration of 4 mg/ml and neutral protease (NP) to 0.4 μl/ml per gram of tissue weighed (see Notes 18 and 19 and Fig. 7).
Fig. 7 
To test the potential for cleavage of cell surface markers by enzymes commonly used for synovial tissue digestion, PBMCs were treated with a range of collagenases for 90 min and staining intensity for CD4 (top row CD4-APC-H7) and CD56 (lower row CD56-PE) was compared to that obtained following no enzyme treatment. The mean fluorescence intensity (MFI) for the relevant parameter is shown in brackets next to the name of enzyme used. Col A = collagenase A, Col D = collagenase D, Col NB1 = collagenase NB-1 and Liberase = Liberase TL. Comparative staining shows that Col NB1 spares cleavage of both CD4 and CD56, unlike the other collagenases used
-
2.
Combine solution of either Collagenase NB1 and neutral protease, or Liberase TL (4 mg/ml final) and 2 ml of DNase1 (1 mg/ml) to make a final concentration of 0.2 mg/ml respectively. Add CaN2O6 to the collagenase NB1/NP (to give a final concentration of 2 mM) to the enzyme mixture in a total of 10 ml of RPMI and sterile filter (0.20 μm) the mixture into a sterile 50 ml conical flask. Set aside.
-
3.
Place 50 ml of RPMI media supplemented with 10 % FCS and 1 % Pen/Strep on ice to be used to terminate the reaction after digestion.

3.5.2 Synovial Processing
-
1.
Discard any unnecessary tissue (i.e., fat) using sterile scissors and forceps, then cut the tissue into small pieces (<2 mm) or use McIlwain tissue chopper to get finely chopped synovium; there should be no large clumps. To further increase the surface area for optimal digestion, the tissue pieces are forcibly pressed using the flat end of a 5 ml syringe plunger for 2 min.
-
2.
Using the forceps, scrape the finely chopped synovial tissue from the petri dish into a small conical flask. Wash the petri dish with 2 ml RPMI/enzyme mix using a Gilson pipette, there should be no visible tissue remaining on the plate. Mix tissue/enzyme thoroughly. Add the remaining RPMI/enzyme mix to the flask and transfer the flask to a shaking water bath at 175 strokes per minute or 40rpm for 1–2 h at 37 °C. At the end of first hour, check the tissue. It should appear “gloopy” or “stringy.” The pinkish color of RPMI in media should discolor. If the tissue is still visibly clumpy, continue incubating for up to 60 min. It is critical not to go over 2 h, as this will begin to affect viability. Swirl every 20–30 min by hand.
-
3.
Transfer 20 ml of ice-cold medium (RPMI with 10 % FBS) to the flask containing the digested tissue to terminate the digestion.
-
4.
Sieve cells through sterilized beaker covered with Microsieves 200 μm material allowing the digested synovium to pass through. It is important to aggressively force through the tissue clumps using a Corning Cell lifter, again pressing with the rubber end of a plunger from a 2 ml syringe.
-
5.
Wash the flask with a further 10 ml of ice-cold medium and rinse membrane covered beaker. Remove any remaining tissue from the Microsieve membrane and place in 10 ml of medium (RPMI containing 10 % FBS) in a 10 cm2 tissue culture dish and leave overnight in an incubator; cells still remaining within the tissue will egress overnight from the tissue and adhere to plastic and can be further passaged to yield synovial fibroblasts.
-
6.
Transfer filtered cells from beaker into a 50 ml falcon tube, add medium (RPMI containing 10 % FBS) to make up to 50 ml and spin at 360 × g for 10 min. Resuspend the pellet with 10 ml Red Blood Cell Lysis buffer, incubate for 5 min at room temperature, terminate the reaction by the addition of 40 ml RPMI, and spin for 5 min at 360 × g. Resuspend cells in 50 ml RPMI and spin for 5 min again. If the pellet is not clean (has fibers) sieve cells through a 70 μm cell strainer to get single cell suspension and spin at 360 × g for 5 min. Cells are now ready for phenotype analysis or cell culture.
3.6 Phenotype Analysis
3.6.1 Antibody Labeling
-
1.
For basic phenotyping place a minimum of 200,000 cells in each of three wells (for Panel A, Panel B, and unstained, see Table 2) in a 96-well (U or V bottom) culture plate for antibody labeling (see Note 20 ).
Table 2 Antibody cocktails for synovial cell FACS analysis -
2.
Add 150 μl per well of cold FACS wash buffer (2 % FCS in PBS containing 0.01 % NaN3) and spin at 530 × g for 2 min to pellet cells.
-
3.
Remove supernatant by a gentle flick to minimize residual buffer.
-
4.
Add Fc Receptor blocking reagent (see Note 21 ) diluted 1:5 in a total volume of 10 μl per sample. Incubate at 4 °C for 10 min.
-
5.
Add antibody cocktails (see Table 2) in a total volume of 20 μl directly on top of FcR block without washing. Incubate at 4 °C for a further 20 min.
-
6.
Wash 3 times by addition of 150 μl of FACS wash buffer, spin at 530 × g and flick off supernatant as in 3.
-
7.
Resuspend after final wash in 150 μl of FACS wash buffer and proceed directly to flow cytometer (e.g., BD Facs Canto II equipped with three lasers: blue (488 nm), red (633 nm), and violet (405 nm) for excitation of all fluorophores specified.
3.6.2 FACS Analysis
Using antibody panels A and B (see Table 2), it is possible to identify the main immune cell types within the typical RA synovial tissue. After exclusion of dead cells and debris, first gate on CD45+ and CD45- populations to facilitate identification of further subsets (see Fig. 8 and Notes 22 – 25 ). CD45+ cells usually make up the bulk (approx. 60 %) but there is a significant degree of heterogeneity in the cellular composition of RA synovial membrane tissue from each RA donor, as demonstrated in Fig. 9, with CD45+ cells ranging between 20 and 80 % of all viable cells recovered. The remaining CD45- population is largely CD90+, suggestive of a fibroblast-like phenotype (see Fig. 9a), and comprises approximately 20 % of all viable cells. Other major cell subsets within the CD45+ gate (hematopoietic in origin) are depicted in Fig. 9b. These are mostly macrophages (CD14+, HLADR+) with a lesser proportion of CD3+ T cells (1–20 %). CD11c+, HLADR+, CD14− cells, likely conventional dendritic cells, are few in number (<5 %) and neutrophils (CD14−, CD15+) even less (<2 %). This may reflect the “dampened” biological activity of the tissue collected at joint replacement surgery (i.e., end stage RA), where the tissue may be more quiescent after long-term chronic inflammation. To confirm this, it will be of interest to compare cellular composition of synovial biopsy tissue collected in early onset RA to late stage surgery.

Synovial tissue from RA patients was collected during joint replacement surgery and cells were enzymatically dissociated, then labeled with a panel of antibodies for immune phenotyping. (A) Total cells were gated to exclude cell debris. (B) CD45 staining was used to identify hematopoietic cells and stromal cells. CD45+ cells comprised CD14+, HLADR+ macrophages (C) and CD3+ T cells among others not shown (D). CD45− cells largely expressed CD90 FLS marker (E)

Proportions of immune cells in synovial tissue from 16 RA patients were quantitated using flow cytometer. (A) CD45+ hematopoietic cells and CD45−, CD90+ FLS cells were enumerated. (B) CD45+ cells were further stratified into macrophages (CD14+, HLADR+), cDCs (CD14−, HLADR+, CD11c+), neutrophils (CD14−, CD15+), and T cells (CD3+)
3.7 Synovial Cell Culture
3.7.1 Cell Culture and Stimulation
-
1.
Once isolated from membranes, cells can be cultured for a limited period of time as follows. Resuspend cells in RPMI with 5 % HIFCS supplemented with 1 % Pen/Strep, dispense into a 96-well flat bottom tissue culture plate (200 μl at 1–2 × 10⁵/well) and incubate at 37 °C.
-
2.
To assess TLR ligand activity in this system, incubate cells with 50 μl of TLR ligand agonists or antagonist (as previously described [5]). For example stimulation with FSL-1 10 ng/ml, poly(I:C) HMW 20 ng/ml, LPS 10 ng/ml, flagellin 10 ng/ml, R847 1 μg/ml, R848 1 μg/ml, or ssDNA/LyoVec 500 ng/ml can be used in order to modify spontaneous cytokine production.
-
3.
Harvest cell supernatants 24–72 h later. We routinely measure cytokines after 48 h and store supernatants at −20 °C until cytokine assays are performed.
3.7.2 Adenoviral Infection
Using AdEasy adenoviral constructs of the TLR adapter molecules MyD88 and Mal, we have previously shown that these molecules control spontaneous cytokine and MMP production in synovial membrane cultures [7]. A detailed protocol for the generation of adenoviral vectors can be found elsewhere [41]. Here we describe how to transfect RA synovial membrane cells.
-
1.
Cells are resuspended in serum-free RPMI supplemented with 1 % Pen/Strep and dispensed into a 96-well flat bottom tissue culture plate (100 μl at 1–2 × 10⁵/well) and incubated at 37 °C for 1 h.
-
2.
Incubate cells with 100 μl of AdEasy adenoviral vectors at a multiplicity of infection of 100, wash after 2 h, and culture in 200 μl of 5 % HIFCS RPMI media for 48 h, at which time collect supernatants and store at −20 °C until cytokine assays are performed.
3.8 Cytokine Analysis
3.8.1 ELISA
-
1.
Coat ELISA plates with anti-human TNF-α antibody or anti-IL-8 antibody diluted 1:400 and 1:1000 respectively in 1× PBS in a volume of 50 μl/well, cover them with acetate plate sealers to prevent evaporation and shake (50 rpm) overnight at 4 °C.
-
2.
Wash plates three times with PBS, 0.01 % Tween 20, pat dry, and block with 2 % BSA in PBS for 1 h.
-
3.
Prepare standard curves of recombinant TNF-α and IL-8 in 5 % HIFCS to include six points of threefold serial dilutions (5000–20 pg/ml). Wash plates as described in step 2. Dispense in duplicate, 50 μl of each of the six points of the serial dilution of the standard curve to the plate. Add cell supernatant to the plate (in the case of TNF-α neat and in the case of IL-8 diluted 1:1000).
-
4.
Shake (50 rpm) samples for 2 h at room temperature or overnight at 4 °C.
-
5.
Wash plates as described in step 2. Dilute biotinylated antibodies at 1:1000 in 0.5 % BSA/PBS and dispense 50 μl/well into the ELISA plate. Shake samples for 1 h at room temperature.
-
6.
Wash plates as described in step 2. Prepare streptavidin-HRP at a dilution of 1:400 in 0.5 % BSA/PBS and dispense 50 μl/well into the ELISA plate. Shake samples for 1 h at room temperature.
-
7.
Wash plates as described in step 2. Prepare TMB substrate by mixing the TMB peroxidase substrate with the substrate solution B in a 1:1 ratio and dispense 50 μl/well into the plate.
-
8.
When the fourth dilution of the standard curve begins to develop, add 50 μl/well of stop solution to the plate. Read absorbance on a spectrophotometric ELISA plate reader (e.g., Labsystems Multiscan Biochromic) and analyze data using the Ascent software program (Thermo Labsystems, Altrincham, UK)(see Figs. 10 and 11).
Fig. 10 
Spontaneous cytokine production from RA synovial cultures. Synovial cells isolated using Liberase TL were seeded at 2 × 10⁵/well and cultured for 48 h. Cell culture supernatant was harvested and kept at −20 °C prior to cytokine analysis using MSD technology. Data shown are from 5–9 distinct RA synovial explant cultures
Fig. 11 
TLR ligand induced cytokine production from RA synovial cultures. Synovial cells isolated using Liberase TL were seed at 2 × 10⁵/well and cultured for 48 h. Cell culture supernatant was harvested and kept at −20 °C prior to cytokine analysis using MSD technology. Data shown are from an individual RA membrane, mean ± SD from triplicate cultures


3.8.2 Mesoscale Discovery (MSD) Platform
MSD assays demonstrate a superior dynamic range (3–4 logs) to standard ELISAs and allow researchers to measure multiple cytokines and metalloproteinases, expressed over a large concentration range in extremely small volumes of culture supernatants. Assay protocols vary from plate to plate depending on the particular plex of antibodies and specific protocols that are supplied with each kit.
-
1.
Bring all reagents to room temperature.
-
2.
Dispense 25 μl of diluent 2 to the MSD plate for 30 min with vigorous shaking (300 rpm).
-
3.
Prepare 8 point standard curve (calibrator) for MMP1/3 (100,000–24 pg/ml) and MMP9 (500,000–122 pg/ml) in diluent provided in the kit.
-
4.
Dispense 25 μl of calibrator in duplicate, blank (diluent) or sample (diluted 1:50 in diluent) into the MSD plate. Seal the plate and incubate for 2 h with vigorous shaking (300 rpm).
-
5.
Wash the plate three times with PBS, 0.01 % Tween 20 and pat dry. Dispense 25 μl of 1× detection antibody solution into each well of MSD plate. Seal the plate and incubate for 2 h with vigorous shaking (300 rpm).
-
6.
Wash the plate as described in step 5. Add 150 μl of read solution into each well. Analyze the plate on the SECTOR Imager using the MSD DISCOVERY WORKBENCH® software. Plates must be read immediately after addition of Read buffer.
4 Notes
-
1.
The nature and frequency of the RA tissue samples we process has changed over the last decade: RA is much more effectively managed by the use of high dose disease-modifying anti-rheumatic drugs (DMARD) such as methotrexate and the anti-TNF based biologicals. As such, we have observed that the spontaneous production of many cytokines, including TNF-α, IL-1, and IL-15, is much more conservative than previously described, while IL-6, IL-8, and matrix metalloproteinases are still expressed at high, pathogenic levels in this subset of patients undergoing joint replacement therapy.
-
2.
To test the quality of the emulsion, place one drop of emulsion on water. If the droplet floats on the surface and remains intact, the emulsion is of optimal quality.
-
3.
This animal experiment is a regulated procedure that has to be performed in an approved animal facility according to legal regulation. For each animal experiment planned, an application must be filed and approved by the appropriate institutional and governmental committees.
-
4.
The amount of Hypnorm to be administered varies in function of the mouse body weight. Consult the vet to work out the appropriate dose of Hypnorm for the mouse strain in question. Moreover, because sedated mice get cold, it is essential to keep mice warm until fully recovered.
-
5.
In order to boost T cell reactivity against the antigen, immunization of mice may be established by means of an injection of mBSA in CFA in the front paws and flanks and an intraperitoneal injection of heat-killed B. pertussis bacteria followed by a second set of injections 7 days later as described previously [32, 42]. Note that, in this case, induction of arthritis by intra-articular injection of mBSA is performed at day 21.
-
6.
Recommended sites for intradermal injections are at the base of the tail and in a slightly more anterior location.
-
7.
After filling the syringe with the emulsion, hold the syringe up to a light source and remove any air bubble as this will result in less emulsion administered to the mice. Change the needle frequently since it becomes blunt after few injections.
-
8.
This injection requires two people: one to hold the mouse (person A) and one to perform the injection (person B). While person A scruffs the mouse, person B pulls out the leg and shaves it around the knee joint. The patella (or knee cap) should be visible under the skin as white.
Person A scruffs the mouse and turns it onto its back with one hand and gently pulls the leg nearly straight with the other hand. The hind foot is held down with the thumb while the knee is supported from underneath with the index finger.
Person B aligns the needle perpendicular to the leg and over the top of the patella and, by pressing down the needle gently, identifies the groove between the femur and the tibia (see Fig. 2a). The needle is maintained in line with this groove while slid slightly back before raising it to approximately a 45° angle and inserting it into the cavity of the joint; all in one smooth motion (see Fig. 2b). Ten microliters of solution is dispensed.
The two most frequent incorrect targets of the injection are the bone and the site immediately below the patella. The person performing the injection will encounter resistance in the former case while notice the needle moving loosely around in the latter case. If the solution comes straight out in the process of injection or if in an incorrect location, remove the needle and begin the process again. If the skin has been damaged, manipulate surrounding shaven skin to have intact layer over the knee. No more than three attempts should be made on the knee, after which intra-articular administration should be stopped if unsuccessful and the mouse allowed to recover.
-
9.
Clinical evaluation of arthritis may include the use of calipers to measure knee joint swelling. This consists of measuring the distance between the medial and lateral aspects of each knee joint at the level of the patellar ligament and is expressed as knee diameter. However, in our experience we have found this technique not very reliable. Alternatively, water displacement [42] is a more accurate and reliable method that can be used to measure knee swelling. However, this requires the use of a plethysmometer, which may not be readily available.
-
10.
Tissues such as joints containing calcified areas need to be decalcified before processing in order to become soft enough for sectioning. It is possible to test biochemically for calcium in solution to assess endpoint of decalcification.
-
11.
DPX is a synthetic resin mounting media composed of Distyrene, a plasticizer, and xylene. It preserves the stain and dries quickly, enabling slides to be screened immediately. It has a low viscosity, allowing the medium to flow easily and prevents air bubbles from becoming trapped. Application of coverslips to microscope slides can also be done manually by adding a drop of mounting media at base of slide, placing the coverslip at an angle as to begin to spread the media and carefully lower the coverslip onto the tissue while the media spreads underneath. Allow slides to dry under a hood.
-
12.
Histological analysis should be performed by an investigator who is blinded to the experimental groups.
-
13.
During the first 7 days after intra-articular injection of mBSA, the acute phase of the arthritic response can be investigated. In order to evaluate the chronic phase of the arthritic response, disease can be allowed to progress for 2–3 weeks after intra-articular injection of antigen.
-
14.
Isolation of total RNA from tissue lysates requires homogenization to reduce viscosity caused by high-molecular-weight cellular components and cell debris. Unlike traditional methods that use syringes and needles, QIAshredder spin columns require a single and fast centrifugation step and reduce loss of sample material.
-
15.
Oligo(dT) primers anneal to any mRNA with a poly(A) tail, generating full length copies of the mRNA. Alternatively, random primers can be used. These are random combinations of nucleotides, 6 or 9 bp long, that enable transcription of 5′ ends of long genes, generating cDNAs that may not be full length copies of the entire gene.
-
16.
If performing the real-time PCR in a Rotor-Gene 6000 instrument using 0.1 ml strip tubes, there is no need to centrifuge the tubes before starting the reaction as the machine spins samples for the entire duration of the PCR.
-
17.
Choose the acrylamide–bis solution percentage most appropriate to the endogenous TLR ligand of interest.
-
18.
There are numerous commercial sources of collagenase used by various laboratories to digest synovial tissue. However, great care has to be taken to ensure each batch of enzyme is tested for endotoxin contamination and not simply rely on manufacturer’s product sheets. We batch test using Endpoint Chromogenic LAL Assays (Lonza) and reject if contamination exceeds 1 EU/ml. In addition to exclude any possibility that low levels of endotoxin could stimulate the highly sensitive macrophage population within RA synovial membranes, we perform mock enzymatic digestions (i.e., incubation of human monocytes with collagenase NB1 8 mg/ml for 2 h followed by three washes, culture of monocytes for 18 h and measurement of monocyte activation by assaying for TNF-α production by ELISA). Many commercial sources of collagenase induce up to 20 ng/ml of TNF-α under these conditions. We observe no such effect using NB1 or Liberase TL in any batches assayed.
-
19.
The choice of enzyme to digest synovial tissue is also critical depending on the end point assay each researcher uses. We have found Collagenase A from Roche cleaves CD56, a NK cell marker which then may give a false under representation of NK cells within the tissue. Another popular source of enzyme is Roche Liberase TL, which we found to cleave CD4 (as demonstrated in Fig. 7), leading to an underestimation of this cell population. As new technologies such as CyTOF and multicolor FACS are developed which allow multiple parameter analysis of mixed cells populations, it is critical that the integrity of cell surface receptors remain intact. After extensive testing, we have found NB1 with its high collagenase and low neutral protease activity was the optimal collagenase for tissue digestion while maintaining cell surface receptor expression. However the high specificity of this particular enzyme results in a lower cell yield and careful thought is needed as RA synovial membranes can yield very little cells and if cytokine analysis is the endpoint, a collagenase preparation such as Liberase TL® may be a more appropriate digestive enzyme of choice.
-
20.
For clear definition of positive staining and to assist set up of the flow cytometer, it is suggested to leave one sample unstained (in addition to those for staining panels A and B).
-
21.
The inclusion of FcR block is necessary to avoid nonspecific staining of all FcR bearing cells, in particular macrophages, which are abundant in RA synovial membranes.
-
22.
It is essential to include a viability stain as up to 20 % of total cells do not remain intact after tissue dissociation. Therefore only collect data from viable cells.
-
23.
For low abundance cell types, it is suggested to gate on the appropriate subset and collect a minimum of 5000 events therein.
-
24.
While it is preferable to analyze cells directly after staining, if a cytometer is not available, samples may be kept at 4 °C in the dark for up to a few hours, or, alternatively, they can be fixed post staining and analyzed the following day.
-
25.
NK cells are also detectable with the staining panels detailed here (CD45+, CD3− and CD56+) when using collagenase NB-1 for tissue digestion. Other collagenases (e.g., Liberase TL) cleave CD56, rendering it undetectable on the cell surface (see Fig. 7 and Note 18 ).
References
Brentano F, Schorr O, Gay RE et al (2005) RNA released from necrotic synovial fluid cells activates rheumatoid arthritis synovial fibroblasts via Toll-like receptor 3. Arthritis Rheum 52:2656–2665
Pierer M, Rethage J, Seibl R et al (2004) Chemokine secretion of rheumatoid arthritis synovial fibroblasts stimulated by Toll-like receptor 2 ligands. J Immunol 172:1256–1265
Seibl R, Birchler T, Loeliger S et al (2003) Expression and regulation of Toll-like receptor 2 in rheumatoid arthritis synovium. Am J Pathol 162:1221–1227
Roelofs MF, Joosten LA, Abdollahi-Roodsaz S et al (2005) The expression of toll-like receptors 3 and 7 in rheumatoid arthritis synovium is increased and costimulation of toll-like receptors 3, 4, and 7/8 results in synergistic cytokine production by dendritic cells. Arthritis Rheum 52:2313–2322
Sacre SM, Lo A, Gregory B et al (2008) Inhibitors of TLR8 reduce TNF production from human rheumatoid synovial membrane cultures. J Immunol 181:8002–8009
Kyburz D, Rethage J, Seibl R et al (2003) Bacterial peptidoglycans but not CpG oligodeoxynucleotides activate synovial fibroblasts by toll-like receptor signaling. Arthritis Rheum 48:642–650
Sacre SM, Andreakos E, Kiriakidis S et al (2007) The Toll-like receptor adaptor proteins MyD88 and Mal/TIRAP contribute to the inflammatory and destructive processes in a human model of rheumatoid arthritis. Am J Pathol 170:518–525
Ultaigh SN, Saber TP, McCormick J et al (2011) Blockade of Toll-like receptor 2 prevents spontaneous cytokine release from rheumatoid arthritis ex vivo synovial explant cultures. Arthritis Res Ther 13:R33
Elson G, Page T, Buatois V et al (2011) NI-0101, a therapeutic TLR4 monoclonal antibody for rheumatoid arthritis. Arthritis Rheum 63:S383
Joosten LA, Koenders MI, Smeets RL et al (2003) Toll-like receptor 2 pathway drives streptococcal cell wall-induced joint inflammation: critical role of myeloid differentiation factor 88. J Immunol 171:6145–6153
Abdollahi-Roodsaz S, Joosten LA, Koenders MI et al (2008) Stimulation of TLR2 and TLR4 differentially skews the balance of T cells in a mouse model of arthritis. J Clin Invest 118:205–216
Choe JY, Crain B, Wu SR et al (2003) Interleukin 1 receptor dependence of serum transferred arthritis can be circumvented by toll-like receptor 4 signaling. J Exp Med 197:537–542
Zare F, Bokarewa M, Nenonen N et al (2004) Arthritogenic properties of double-stranded (viral) RNA. J Immunol 172:5656–5663
Alzabin S, Kong P, Medghalchi M et al (2012) Investigation of the role of endosomal Toll-like receptors in murine collagen-induced arthritis reveals a potential role for TLR7 in disease maintenance. Arthritis Res Ther 14:R142
Abdollahi-Roodsaz S, Joosten LA, Roelofs MF et al (2007) Inhibition of Toll-like receptor 4 breaks the inflammatory loop in autoimmune destructive arthritis. Arthritis Rheum 56:2957–2967
Leung BP, Xu D, Culshaw S et al (2004) A novel therapy of murine collagen-induced arthritis with soluble T1/ST2. J Immunol 173:145–150
Hayashi T, Gray CS, Chan M et al (2009) Prevention of autoimmune disease by induction of tolerance to Toll-like receptor 7. Proc Natl Acad Sci U S A 106:2764–2769
Dong L, Ito S, Ishii KJ et al (2004) Suppressive oligonucleotides protect against collagen-induced arthritis in mice. Arthritis Rheum 50:1686–1689
Zeuner RA, Ishii KJ, Lizak MJ et al (2002) Reduction of CpG-induced arthritis by suppressive oligodeoxynucleotides. Arthritis Rheum 46:2219–2224
Midwood KS, Piccinini AM, Sacre S (2009) Targeting Toll-like receptors in autoimmunity. Curr Drug Targets 10:1139–1155
Huang QQ, Pope RM (2009) The role of Toll-like receptors in rheumatoid arthritis. Curr Rheumatol Rep 11:357–364
Piccinini AM, Midwood KS (2010) DAMPening inflammation by modulating TLR signalling. Mediators Inflamm 2010
Roelofs MF, Abdollahi-Roodsaz S, Joosten LA et al (2008) The orchestra of Toll-like receptors and their potential role in frequently occurring rheumatic conditions. Arthritis Rheum 58:338–348
Midwood K, Sacre S, Piccinini AM et al (2009) Tenascin-C is an endogenous activator of Toll-like receptor 4 that is essential for maintaining inflammation in arthritic joint disease. Nat Med 15:774–780
Andersson U, Erlandsson-Harris H (2004) HMGB1 is a potent trigger of arthritis. J Intern Med 255:344–350
Rice JW, Veal JM, Fadden RP et al (2008) Small molecule inhibitors of Hsp90 potently affect inflammatory disease pathways and exhibit activity in models of rheumatoid arthritis. Arthritis Rheum 58:3765–3775
Kakimoto K, Matsukawa A, Yoshinaga M et al (1995) Suppressive effect of a neutrophil elastase inhibitor on the development of collagen-induced arthritis. Cell Immunol 165:26–32
Gondokaryono SP, Ushio H, Niyonsaba F et al (2007) The extra domain A of fibronectin stimulates murine mast cells via toll-like receptor 4. J Leukoc Biol 82:657–665
Pullerits R, Jonsson IM, Verdrengh M et al (2003) High mobility group box chromosomal protein 1, a DNA binding cytokine, induces arthritis. Arthritis Rheum 48:1693–1700
van Lent PL, Grevers LC, Schelbergen R et al (2010) S100A8 causes a shift toward expression of activatory Fcgamma receptors on macrophages via toll-like receptor 4 and regulates Fcgamma receptor expression in synovium during chronic experimental arthritis. Arthritis Rheum 62:3353–3364
Dumonde DC, Glynn LE (1962) The production of arthritis in rabbits by an immunological reaction to fibrin. Br J Exp Pathol 43:373–383
Brackertz D, Mitchell GF, Mackay IR (1977) Antigen-induced arthritis in mice. I. Induction of arthritis in various strains of mice. Arthritis Rheum 20:841–850
van den Berg WB, van de Putte LB (1985) Electrical charge of the antigen determines its localization in the mouse knee joint. Deep penetration of cationic BSA in hyaline articular cartilage. Am J Pathol 121:224–234
van den Berg WB, Kruijsen MW, van de Putte LB et al (1981) Antigen-induced and zymosan-induced arthritis in mice: studies on in vivo cartilage proteoglycan synthesis and chondrocyte death. Br J Exp Pathol 62:308–316
Brennan FM, Chantry D, Jackson AM et al (1989) Cytokine production in culture by cells isolated from the synovial membrane. J Autoimmun 2(Suppl):177–186
Feldmann M, Brennan FM, Maini RN (1996) Role of cytokines in rheumatoid arthritis. Annu Rev Immunol 14:397–440
Brennan FM, Chantry D, Jackson A et al (1989) Inhibitory effect of TNF alpha antibodies on synovial cell interleukin-1 production in rheumatoid arthritis. Lancet 2:244–247
Arnett FC, Edworthy SM, Bloch DA et al (1988) The American Rheumatism Association 1987 revised criteria for the classification of rheumatoid arthritis. Arthritis Rheum 31:315–324
van Lent PL, Grevers L, Lubberts E et al (2006) Fcgamma receptors directly mediate cartilage, but not bone, destruction in murine antigen-induced arthritis: uncoupling of cartilage damage from bone erosion and joint inflammation. Arthritis Rheum 54:3868–3877
Laemmli UK (1970) Cleavage of structural proteins during the assembly of the head of bacteriophage T4. Nature 227:680–685
Davis A, Taylor C, Willetts K et al (2007) Adenoviral targeting of signal transduction pathways in synovial cell cultures. Methods Mol Med 136:395–419
Boyle DL, Moore J, Yang L et al (2002) Spinal adenosine receptor activation inhibits inflammation and joint destruction in rat adjuvant-induced arthritis. Arthritis Rheum 46:3076–3082
Acknowledgements
We would like to thank Mr Khaja Syed and Mr. Arran Speirs for their technical assistance; Mr. Richard Field, Consultant Orthopedic Surgeon, Elective Orthopedic Centre, Epsom and St Helier University Hospital, Mr. Grey Giddings, Consultant Plastic and Hand Surgeon, Royal United Hospital Bath, and Mr. Kang, Consultant Plastic and Hand Surgeon, Royal Free London, NHS Hospital trust, for their invaluable provision of RA synovial tissue.
Author information
Authors and Affiliations
Corresponding author
Editor information
Editors and Affiliations
Rights and permissions
Copyright information
© 2016 Springer Science+Business Media New York
About this protocol
Cite this protocol
Piccinini, A.M., Williams, L., McCann, F.E., Midwood, K.S. (2016). Investigating the Role of Toll-Like Receptors in Models of Arthritis. In: McCoy, C. (eds) Toll-Like Receptors. Methods in Molecular Biology, vol 1390. Humana Press, New York, NY. https://doi.org/10.1007/978-1-4939-3335-8_22
Download citation
DOI: https://doi.org/10.1007/978-1-4939-3335-8_22
Published:
Publisher Name: Humana Press, New York, NY
Print ISBN: 978-1-4939-3333-4
Online ISBN: 978-1-4939-3335-8
eBook Packages: Springer Protocols