
Abstract
Epigenetic mechanisms including DNA methylation are fundamental for the regulation of gene expression. Epigenetic alterations can lead to the development and the evolution of malignant tumors as well as the emergence of phenotypically different cancer cells or metastasis from one single tumor cell. Here we describe bisulfite pyrosequencing, a technology to perform quantitative DNA methylation analyses, to detect aberrant DNA methylation in malignant tumors.
Access provided by CONRICYT – Journals CONACYT. Download protocol PDF
Key words
1 Introduction
Deciphering epigenetic alterations contributes to our understanding of the molecular basis of different clinical phenotypes as well as characteristics of malignant tumors . Like genetic information epigenetic information is heritable, but epigenetic information is not encoded in the DNA sequence itself. Epigenetic information has a major impact on gene expression and chromatin structure. Since epigenetic modifications are reversible, they allow the adaptation of gene activity to the environmental conditions. Epigenetic mechanisms include modifications of bases in the DNA , of histones, and of other proteins of the chromatin, the expression of non-coding RNAs (ncRNA) as well as positioning of genes in the nucleus. The probably nowadays best studied epigenetic modification is the methylation of DNA . In this post-replicative process particularly cytosine residues located in CG dinucleotides become methylated by DNA -methyltransferases [1–3]. Especially in cancer cells, a large number of epigenetic alterations in the DNA methylome can be observed. Consequently, multiple drugs have been developed targeting epigenetic modifications in cancer , including drugs suppose to demethylate DNA [4].
It has been estimated that 70–80 % of the approximately 2.7 × 10⁷ cytosines in the human genome which are located in CG dinucleotides are methylated [5]. This corresponds to 3–5 % of all cytosines in the human genome [6]. The function of DNA methylation depends on the localization of the methylated cytosine in the genome. High methylation of repeated sequences and “molecular parasites” prevents DNA recombination events and ensures genome stability. DNA methylation of regulatory elements (i.e. promoters and enhancers) controls gene expression and DNA methylation of single alleles depending on their parental origin controls parental imprinting [7–17]. Germline alterations in the DNA methylation pattern limited to single regions of a genome might be associated with developmental disorders [18], while extensive alterations in the DNA methylome in somatic cells including aberrant DNA methylation of regulatory elements and hypomethylation of repetitive sequences are a typical hallmark of cancer contributing to genomic instability [12, 19, 20].
Consequently, strategies to analyze alterations in the DNA methylation pattern got into the focus not only of scientific questions but also of clinical diagnostics and applications. For example, altered DNA methylation of imprinting centers on chromosome 11p might be causative for the Silver-Russell syndrome (SRS) or the Beckwith-Wiedemann syndrome (BWS). Furthermore, depending on which imprinting center (IC1 or IC2) is affected in BWS altered DNA methylation is associated with a significantly increased risk for either Wilms’ tumors or hepatoblastomas, respectively [21, 22].
DNA methylation analysis might also be of interest for individualized antitumor therapies. A promising chemotherapeutic drug for the treatment of glioblastomas is temozolomide, which induces alkylation of the DNA and disturbs DNA replication in tumor cells. However, lack of DNA methylation of the O-6-methylguanine-DNA methyltransferase-activity gene (MGMT, a member of the family of DNA repair enzymes) in glioblastomas corresponds to MGMT activity which reverses the alkylation of the DNA and therefore confers resistance to temozolomide therapy [23–25]. Thus, knowing the DNA methylation state of MGMT allows identifying patients which will benefit from temozolomide therapy. Furthermore, several drugs acting by inhibition of DNA methyltransferases or other epigenetic key players are already used for cancer therapy [4, 19, 20, 26].
Understanding the impact of alterations in the DNA methylome for cancer research and clinical management, numerous techniques with different foci and fields of applications have been developed. Some of them focus on a small number of selected sequences or even single CG loci, others focus on the genome-wide analysis of the DNA methylome. However, most of the protocols for performing quantitative DNA methylation analysis available today do rely on the chemical modification of cytosine residues in the DNA in a methylation-dependent manner [27]. Because of length restrictions we cannot discuss multiple techniques in detail in this chapter. Therefore, we here focus on bisulfite pyrosequencing (BSPS), which is a quite universal and robust technique for targeted DNA methylation analysis in a quantitative manner suiting many requirements in research and clinical diagnostics.
1.1 The Principles of Bisulfite Conversion of DNA and of Bisulfite Pyrosequencing
Bisulfite pyrosequencing is a sequencing-by-synthesis technology allowing the analysis of DNA methylation at multiple CG loci. In the first step, a bisulfite conversion of the DNA has to be performed. During this procedure, a sulfonation of unmethylated cytosines results in cytosinsulfonate which becomes converted into uracilsulfonate by hydrolytic deamination. A final desulfonation step results into uracil [28]. In a subsequent PCR , the uracil will be further “converted” to thymidine. Since the bisulfite conversion prefers unmethylated cytosine residues, while methylated cytosines are much less affected, cytosine residues located in the resulting PCR products correspond to methylated cytosine residues in the sequence of interest (Fig. 1). Bisulfite-converted DNA is the analyte used for bisulfite pyrosequencing.

Bisulfite conversion and subsequent PCR amplification . Unmethylated cytosine residues in the DNA sequence will be converted into uracil by bisulfite treatment. In a subsequent PCR reaction, uracil will be converted into thymine
For performing bisulfite pyrosequencing three primers are needed, two for amplifying the target sequence of interest and one for the subsequent sequencing reaction. When designing these primers, it is mandatory to keep in mind that after bisulfite conversion the original DNA strands are not complementary anymore. Thus, in most situations the primer set has to be designed specifically either for the sense or for the antisense strand. Furthermore, for performing pyrosequencing purified single-stranded DNA is needed. Therefore, one strand of the PCR product containing the target sequence has to be biotinylated at its 5′-end (modified PCR primers can be ordered from several vendors). The sequencing primer has to be designed being complementary to that strand of the PCR product carrying the biotin label. When designing the PCR primers manually, you should consider the following general aspects:
-
1.
Length of the PCR product (usually between 200 and 600 bp, might depend on the quality of DNA subjected to analysis).
-
2.
Melting temperature of primers (please consider that the sequencing reaction will be performed at 28 °C, thus the sequencing primers have to anneal below this temperature but not at high temperature usually used in PCR ).
-
3.
CG content of the primers.
-
4.
CG dinucleotides in the primer sequence should be avoided due to their unknown methylation status (if unavoidable, order a primer mix containing primers binding to the methylated or unmethylated sequence or, alternatively, order a primer containing a mismatch at the position of the respective cytosine).
-
5.
Limitation of sequencing length to ~80–100 bp.
-
6.
Repeats in the sequence to analyze (homopolymers) might interfere with correct quantification and might cause sequencing errors.
However, it is strongly recommended to make use of suitable software packages like those delivered with the pyrosequencer by the manufacturer. Besides packages for, e.g. identifying organisms or analyzing genetic variations also packages for DNA methylation analysis or for designing suitable PCR and sequencing primers are available (i.e. PyroMark Assay Design Software, Qiagen).
The final primer set should be validated whether it contains known SNPs or other known sequence alterations. These might cause differences in primer binding or PCR efficiency between both alleles resulting in selective allele amplification , allelic drop outs, and consequently misleading results. SNP information is available from several databases (e.g. dbSNP (http://www.ncbi.nlm.nih.gov/SNP /) or F-SNP (http://compbio.cs.queensu.ca/F-SNP/)).
In the PCR amplification reaction, a high number of PCR cycles should be performed ensuring most primer molecules becoming incorporated (usually >35–45 cycles). Otherwise, in particular free biotinylated PCR primers might interfere with the subsequent sequencing reaction. After amplifying the DNA sequence of interest, the PCR products will be purified and denaturized. Here, the protocol takes advantages from the fact that one of the amplification primers is labeled with biotin . The PCR products will be bound to streptavidin-coated sepharose beads. Using a washing device (aspiration tool) belonging to the pyrosequencing system, the beads loaded with the PCR product will be immobilized to a membrane filter by applying a vacuum to the filter. This setup is used to purify the PCR products by sticking the filters into washing buffers and to generate single-stranded DNA . For this purpose, the PCR products are incubated in an aqueous solution of sodium hydroxide. While the biotinylated PCR strand still binds to the sepharose beads and to the filter, the opposite strand is removed in this step.
In general, the bisulfite pyrosequencing reaction is based on the sequential addition of nucleotides to the DNA in the presence of a mixture of enzymes and substrates, “converting” every integrated nucleotide into a light signal (Fig. 2).

Bisulfite pyrosequencing. After bisulfite conversion and purification of the DNA , the sequencing primer will be annealed to the single-stranded DNA template (a) before the pyrosequencing reaction can be initiated (b). 5mC 5-methyl cytosine, bio biotin , PPi pyrophosphate, APS adenosine 5′ phosphosulfate, dNTP desoxy nucleoside triphosphate
After the initial annealing of the sequencing primer and the addition of a defined mix of enzymes and substrates, the nucleotides will be sequentially injected to the reaction according to the known sequence of the DNA to analyze. When using the manufacture’s software package for designing the primer set this sequence to analyze, which might also contain additional injections for control purposes, is also provided by the software. If the injected nucleotide is complementary to the DNA strand to be sequenced, the DNA polymerase in the reaction mixture will prolong the sequencing primer. During this reaction, pyrophosphate will be released, giving the technique its name.
Together with adenosine 5′-phosphosulfate (APS) the pyrophosphate will be enzymatically processed by a sulfurylase to generate ATP, which afterward acts as substrate for luciferase converting luciferine to oxiluciferine. During the luciferase catalyzed reaction a light signal is emitted, which is recorded by a camera. The signal intensity correlates with the number of base repeats in the DNA sequence. In a parallel step, excessive nucleotides will be removed by an apyrase from the reaction. Finally, the next nucleotide is injected. Injection of a nucleotide which cannot be incorporated into the newly synthesized strand (i.e. the base is not complementary to the template DNA ) does not result in light emission and no peak can be detected. When the sequencing reaction reaches a position in the DNA that contains a cytosine which is potentially methylated, dCTP and dTTP will be injected consecutively. The resulting signal ratio obtained from these both injections is used by the software to calculate the amount of methylated or unmethylated cytosines at that position. Due to limitations of the reaction mix the maximum read length is usually restricted to 100–150 bp, depending on the sequence to analyze. The typical read length is usually around 80 bp. To a certain amount, this decreasing enzymatic efficiency can be compensated by the software package used; however, this compensation is limited. As controls a fully methylated DNA (either generated by in vitro methylation of genomic DNA using, e.g. M.Sss I methyltransferase or using commercially available methylated DNA , e.g. Millipore #S7821) and an unmethylated DNA (e.g. generated by whole genome amplification of genomic DNA , e.g. by Illustra GenomiPhi (GE Healthcare)) should be processed in parallel to detect putative issues of this procedure. Furthermore, a genomic control (DNA which is not bisulfite-converted) is recommended, to ensure specificity of the primer set for bisulfite-converted DNA to exclude putative background from unconverted DNA remaining in the reaction. Including a control not containing any template DNA would reveal hidden contaminations of, e.g. kit reagents with DNA template.
2 Materials
2.1 Bisulfite Conversion
-
1.
Sodium bisulfite or sodium metabisulfite.
-
2.
Hydrochinone.
-
3.
Purified water.
-
4.
0.2 ml PCR vials with tightly (!) closing lids.
-
5.
PCR thermocycler.
-
6.
50 ng–2 μg DNA (DNA to analyze, methylated and unmethylated control DNAs).
Alternatively, kits for bisulfite conversion are commercially available making this highly critical step more convenient and reproducible. Bisulfite conversion kit systems are available from several manufacturers. For the pyrosequencing protocols outlined below, both the EpiTect-Kit (Qiagen) as well as the bisulfite conversion kit Gold (ZymoResearch) have been successfully tested in our hands. Bisulfite conversion using these kits can be performed according to the manufacturer’s instruction, also with low amounts of DNA . To our experience applying different commercially available kit systems or protocols for bisulfite conversion of the DNA can affect the outcome of the analysis. Therefore, it is recommended using the same procedure (and kit system) for optimization as well as for the subsequent analyses.
2.2 Bisulfite Pyrosequencing
-
1.
DNA to analyze (bisulfite-converted).
-
2.
Appropriate primers for amplification and sequencing (concentration adjusted to 20 pmol/μl). These can be designed either using the PyroMark Assay Design software package (Qiagen), or an alternative software package available from other sources (e.g. Methprimer, available at http://www.urogene.org/cgi-bin/methprimer/methprimer.cgi). Alternatively, primers can also be designed manually (see Note 1 ).
-
3.
Annealing Buffer (Qiagen).
-
4.
Binding buffer (Qiagen).
-
5.
PSQ 96 Sample Prep Thermoplate Low, U-shaped wells (PSQ96; Qiagen).
-
6.
PSQ 96 Reagent Cartridge (Qiagen).
-
7.
Denaturing solution (0.2 M NaOH).
-
8.
70 % Ethanol .
-
9.
1× Washing buffer (dissolve 6.5 g Tris-base in 5 l water).
-
10.
PCR plate, 96 well, V-shaped wells (Eppendorf).
-
11.
Adhesive tape (e.g. BioRad).
-
12.
Streptavidin coated Sepharose Beads (GE Healthcare).
-
13.
Heating device for 96-well plates.
-
14.
VacuumPrep workstation coming with the sequencer (aspiration tool; Qiagen).
-
15.
Plate shaker MS3 basic (IKA).
-
16.
Pyrosequencer (e.g. PyroMark ID, Qiagen).
-
17.
AmpliTaq Gold polymerase system (10 U/μl; Life Technologies).
-
18.
dNTP Mix (5 mM of each nucleotide).
-
19.
Purified water.
-
20.
Wizard SV Gel and PCR Clean-Up System (Promega; only when performing bisulfite conversion manually).
-
21.
DNA loading buffer (e.g. 3 ml glycerol, 25 mg bromophenol blue , add water to 10 ml).
Optional the PyroMark PCR kit (Qiagen) can be used. This kit substitutes for the items 17, 18, and 21 above.
3 Methods
3.1 Bisulfite Conversion
When using a commercially available kit system (highly recommended), please follow the instruction of the kit’s manufacturer. If you prefer a conventional setup, you might follow the protocol outlined below. This protocol makes use of the “Wizard SV Gel and PCR Clean-Up System” available from Promega to isolate the DNA after bisulfite conversion. Besides the sample of interest also a negative (unmethylated DNA , e.g. generated by whole genome amplification ), a positive control (fully methylated DNA) as well as a water control (containing no DNA sample) should be included and processed in parallel (see Note 2 ).
Freshly prepare the following solutions [29]:
-
1.
100 mM Hydrochinon solution (50 mg in 10 ml water, freshly prepared).
-
2.
3 M Sodium hydroxide solution (400 mg in 3.3 ml water, freshly prepared).
-
3.
0.5 M EDTA solution (adjust pH to 8.0 by adding sodium hydroxide).
-
4.
Denaturation-buffer (3-fold, freshly prepared):
-
(a)
3.0 μl sodium hydroxide solution.
-
(b)
0.5 μl EDTA solution.
-
(c)
6.5 μl water.
-
(a)
-
5.
Bisulfite solution (saturated, freshly prepared):
-
(a)
5.0 g sodium metabisulfite.
-
(b)
7.0 ml water.
-
(c)
100 μl hydrochinon solution.
-
(d)
1.2 ml sodium hydroxide solution.
-
(e)
Adjust pH to 5.0, heat to 50 °C to dissolve as much bisulfite as possible (saturated solution, the bisulfite might not dissolve completely).
-
(a)
-
6.
Mix 10 μl denaturation-buffer (3-fold) with 20 μl DNA (~1 μg DNA).
-
7.
Incubate for 15 min at 40 °C (e.g. in a PCR machine).
-
8.
Add 180 μl bisulfite solution (prewarmed), close PCR lid tightly.
-
9.
Incubate for 5 min at 98 °C.
-
10.
Incubate for 6–10 h at 50 °C with heating up temperature to 98 °C for 3 min each hour.
-
11.
Re-isolate the converted DNA using the “Wizard SV Gel and PCR Clean-Up System” according to the manufacturer’s instruction. If necessary adapt the elution volume according to the DNA amount.
-
12.
Adjust the final concentration of the DNA to ~50 ng/μl (depends on starting amount and elution volume in step 12).
3.2 Amplification of the Target Sequences
Besides including the controls stated above (positive, negative, water control), it is also recommended adding a sample with (unconverted) genomic DNA at this step (same amount of DNA as used for the bisulfite-converted DNA samples). Prepare the PCR -mix using standard 0.2 ml PCR-tubes. When processing several samples in parallel, prepare a mastermix and add 10 % of each component as “reserve.” The components for a single sequencing reaction contain:
-
1.
1.0 μl bisulfite-converted DNA (~50 ng/μl).
-
2.
18.3 μl water.
-
3.
2.5 μl PCR buffer II.
-
4.
1.0 μl MgCl2 solution (50 mM, comes with the AmpliTaq polymerase).
-
5.
1.0 μl dNTP mix (5 mM of each nucleotide).
-
6.
0.5 μl forward primer (20 pmol/μl).
-
7.
0.5 μl reverse primer (20 pmol/μl).
-
8.
0.2 μl AmpliTaq Gold polymerase (10 units/μl).
When using the PyroMark PCR kit instead of AmpliTaq polymerase the following scheme applies:
-
1.
1.0 μl bisulfite-converted DNA (~50 ng/μl).
-
2.
8.0 μl water.
-
3.
12.5 μl PyroMark MasterMix.
-
4.
2.5 μl Coral Load.
-
5.
0.5 μl forward primer (20 pmol/μl).
-
6.
0.5 μl reverse primer (20 pmol/μl).
The subsequent PCR amplification can be performed according to the following scheme:
Step | Temperature | Duration | PCR |
1 | 95 °C | 5 min | Denaturing step |
2 | 95 °C | 45 s | 45× PCR amplification cycles |
3 | Tm-5 °C | 45 s | |
4 | 72 °C | 45 s–1 min | |
5 | 72 °C | 5 min | Final elongation step |
6 | 4 °C | Inf. | Storage |
The temperature in step 3 (primer hybridization) should be adjusted according to the calculated melting temperature (Tm) of the primer minus 5 °C. The duration of the PCR elongation step (step 4) depends on the PCR product (e.g. its length). Usually, 45 s works fine. However, further optimization of the annealing temperature in step 3 and the duration of the amplification step might be necessary. If using the PyroMark kit instead of AmpliTaq denaturing temperatures can be reduced to 94 °C and the duration time of all three steps of the amplification cycles can be shortened to 30 s. When using a different polymerase, possibly the elongation temperature and duration times have to be individually optimized also. Due to variations in speed, ramping rates as well as temperature stability it is recommended to perform assay optimization and subsequent analyses using the same thermocycler block.
After the PCR has been finished, take 5 μl of the PCR product, add 3 μl DNA loading buffer and load the sample to a standard agarose gel. Addition of loading buffer can be omitted when using the PyroMark kit. After separation and staining of the DNA (e.g. by ethidium bromide) only one strong specific PCR band should be visible on the gel. Any additional signal on the gel might interfere with the subsequent analysis. Therefore, it is mandatory to optimize PCR conditions. Of course, the control containing unconverted DNA as well as the water control should not result in any PCR amplification (see Note 3 ).
3.3 Purification of the PCR Product and Preparation of a Single-Stranded Sequencing Template
-
1.
When using the PyroMark Assay Design software package for designing the primer sets, the software also provides the core sequence to analyze. However, we recommend spending some time analyzing both the provided sequence to analyze as well as the unconverted DNA sequence. To verify complete bisulfite conversion of the DNA, manually introducing additional cytosines into the provided sequence to analyze at positions which contain cytosine residues not part of CG dinucleotides in the unconverted DNA sequence is highly recommended. For this purpose a specific function introducing bases into the sequence to analyze is provided by the Q-CpG software package, the particular positions are shown in bold letters by the software. When preferring performing the primer design manually, you also have to prepare the sequence to analyze by yourself (see Note 4 ).
-
2.
Start the pyrosequencer, open the adequate software package (usually the Q-CpG software) and enter the assays to perform, the sequences to analyze and the plate designs according to the manual of the software package. Based on this information the software also calculates the volumes of enzyme, substrate, and nucleotide mixes needed to perform the assays and the plate layout.
-
3.
Heat up a heating device to 85 °C (the device usually comes with the pyrosequencer).
-
4.
Transfer 40 μl of each PCR amplification product into a well of a PCR 96-well plate.
-
5.
Prepare a mastermix containing 5 μl sepharose beads (shake/vortex before use!) and 40 μl binding buffer for each sample or control to become sequenced.
-
6.
Add 43 μl mastermix to each DNA sample to be analyzed on the 96-well plate.
-
7.
Seal the plate tightly (e.g. by applying adhesive sealing tape) and mix for ~10 min at high speed on a plate shaker.
-
8.
Prepare sequencing mastermix containing 40 μl annealing buffer and 0.5 μl sequencing primer (20 pmol/μl) for each sample (add 10 % of each component as a “reserve” for pipetting).
-
9.
Prepare the sequencing plate (PSQ96) by pipetting 40 μl sequencing mastermix to each well needed. Take care that on the PSQ96 plate the same positions are used as on the PCR plate containing the sepharose beads, as the loaded beads will be transferred into the corresponding well on the sequencing plate.
-
10.
Set up the vacuum/aspiration tool. Adjust the vacuum to ~ −70 mmHg. Prepare the dishes of the aspiration tool. One each is filled with (a) 70 % ethanol , (b) denaturing solution, and (c) washing solution.
-
11.
Remove the PCR plate containing the sepharose beads from the shaker and instantaneously aspirate the solution using the aspiration tool. The DNA bound to the beads sticks to the filter membrane.
-
12.
Transfer the filters for 5–10 s into the ethanol bath, followed by 5–10 s into the bath containing the denaturing solution and 5–10 s into the washing bath. When removing the filters from a bath turn around the handhold slowly (~180°), so that the filters show upwards for ~1 s. By this procedure, solution that remained in the handhold of the vacuum tool will be removed.
-
13.
Transfer the filters on top of the wells of the plate containing the sequencing mix (PSQ96). Do not transfer the filters into the mix, since this would result in the aspiration of the mix. Subsequently, turn off the vacuum, transfer the filters (without vacuum applied!) into the sequencing mix and shake the filters gently to release the beads containing the DNA into the wells.
-
14.
Incubate the plate at 80 °C for 2–5 min on the heating device. Finally, cool down the plate to room temperature.
-
15.
Transfer the volumes of the mixes into a sequencing cartridge as determined by the software. Place the sequencing plate and the cartridge into the pyrosequencer, close the plate frame and the lid and start the sequencer.
-
16.
The system will perform the sequencing automatically. Collected data will be continuously presented, thus the progress can be traced on the screen.
-
17.
After finishing sequencing the results can be evaluated using the Q-CpG software (see below).
3.4 Data Analysis
After the run has been finished, the results are presented as a pyrogram by the Q-CpG software package (see Note 5 ).
In Fig. 3, the major components of a pyrogram are presented. It shows the analysis of a short sequence from the NFE2L3 gene. The upper pyrogram belongs to a methylated control sample (3a), while the lower one belongs to an unmethylated control generated by WGA (3b). The left (y-) axis of a pyrogram (3–1) indicates the intensity of a signal (indicated by the red line). If the sequence to analyze (3–2) contains a sequential series of the same base the nucleotide injected during one sequencing cycle will be incorporated consecutively several times, which finally results in increased signal intensity (3–3). Therefore, the signal intensity (peak height) is a direct measurement of how many consecutively repeats of a base are contained in the sequence. Since the sequence to analyze (3–2) is known before the sequencing reaction is started, the expected peak height at each position of the pyrogram can be calculated in advance by the software. The software can optionally indicate the expected peak height as grey bar in the background of each peak (3–4). A peak which is significantly lower or higher as expected would argue for a divergence between the DNA sequenced and the sequence expected (the “sequence to analyze”, (3–2)). Positions at which additional cytosines have been added into the sequence to analyze for verifying complete bisulfite conversion are highlighted in yellow (3–5). At the corresponding positions the original sequence (before bisulfite conversion) contains a cytosine which is not part of a CG dinucleotide and therefore cannot become methylated (taking the rare non-CG methylation sites not into consideration). Consequently, all of these cytosine residues have to be converted into thymidine. If still cytosine is detectable, bisulfite conversion was not complete. In this case, quantitative DNA methylation analysis is erroneous. Positions in the pyrogram corresponding to CG loci in the sequence to analyze are indicated as grey bars (3–6). At these positions, dCTP and dTTP are injected consecutively. The ratio of the peak heights corresponds to the DNA methylation value (3–7). Please note that a thymidine preceding a CG dinucleotide also results in a T-corresponding peak even if the cytosine is fully methylated (3–8). In particular if a homopolymer (multiple copies of one nucleotide) precedes a CG dinucleotide correct quantification of the DNA methylation is error prone.

The pyrogram: interpretation of the primary results. 3–1 scale (signal intensity). Peak heights (originating from a single base) below 15 indicate a bad quality of the pyrogram due to an unfavorable signal:noise ratio. 3–2 sequence to analyze, 3–3 the height of a peak correlates with nucleotides incorporated in a single sequencing cycle and the how often a base is present in the DNA sequence (here: four consecutive adenines), 3–4 grey bars beyond the peaks indicate the expected signal intensity, 3–5 yellow bars indicate positions introduced to detect incomplete bisulfite conversion, 3–6 putatively methylated cytosines are highlighted by large grey bars, 3–7 the methylation value is shown by small numbers on top of the pyrogram, 3–8 a thymine preceding a CG dinucleotide is integrated into the grey bar indicating a CG dinucleotide since the signals do overlap
The DNA methylation data can be exported into a tab delimited format which can be easily processed by other software packages.
4 Notes
-
1.
After bisulfite conversion of the target DNA , the resulting DNA strands are not complementary anymore. Thus, the primer sets have to be designed specifically either for one strand of interest or for both strands individually. Mixing up both strands would result either in no or unpredictable results.
-
2.
To collect proper DNA methylation values, complete bisulfite conversion of the DNA is mandatory. Else unconverted cytosines become interpreted as methylated cytosines resulting in high DNA methylation values. An example is shown in Fig. 4a. The presence of peaks at control positions in the pyrogram (arrows, highlighted in yellow) indicate incomplete bisulfite conversion. For comparison, Fig. 4b shows a completely converted DNA. If bisulfite conversion turns out to be incomplete, fragmentation of the DNA (heat, ultrasound, enzymatic) prior to bisulfite conversion might improve the conversion rate. However, the sequence to be amplified for bisulfite sequencing has to be left intact (e.g. no restriction sites are allowed in this sequence to analyze).
Fig. 4 
Incomplete bisulfite conversion. The presence of peaks at control positions in the pyrogram (arrows, highlighted in yellow) indicate incomplete bisulfite conversion. (a) Poor bisulfite conversion, (b) complete bisulfite conversion of the DNA
-
3.
Unspecific binding of the sequencing primer results into unexpected or missing peaks already at the beginning of the pyrogram. Furthermore, already at the beginning of the pyrogram the expected peak heights (indicated by grey bars beyond the peaks) are often not reached (Fig. 5).
Fig. 5 
Unspecific binding of the sequencing primer. Unspecific binding of the sequencing primer might result into unexpected peak heights (e.g. positions 10 and 15)
-
4.
An insufficient assay design might result in the PCR amplification and/or sequencing of unconverted DNA since the primers are not specific for bisulfite-converted DNA . In this case pyrosequencing of a control containing only (unconverted) genomic control DNA will be helpful, since it results in a specific sequencing pattern similar to the expected pattern (Fig. 6a). Because without a specific control containing only genomic/unconverted DNA this problem is difficult to detect (Fig. 6b the corresponding bisulfite-converted sample), it is highly recommended to include such a control.
Fig. 6 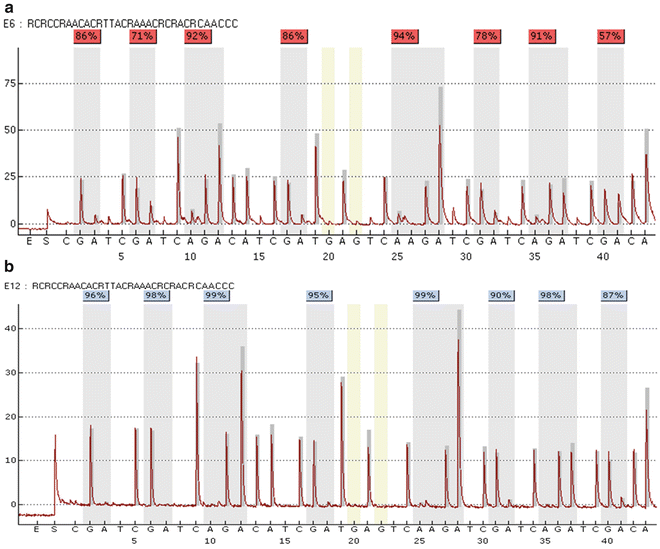
An insufficient assay design can result in the amplification and sequencing of unconverted DNA (a), which can interfere with quantification of DNA methylation . Without an appropriate control containing unconverted DNA this putative source of errors might remain undetected. (a) Pyrogram obtained from unconverted DNA, (b) pyrogram obtained from bisulfite-converted DNA
Methylated cytosines are a hotspot for C to T transitions [30]. Consequently, positions in the DNA containing methylated cytosines often contain SNPs. If a sample carries such SNP heterozygous, the theoretically maximal DNA methylation value could reach 50 %, if the sample is homozygous for such SNP no DNA methylation could be detected at all. Therefore, when designing a pyrosequencing assay, the resulting sequence to analyze should be checked whether it contains already known SNPs using available databases .
-
5.
Bisulfite pyrosequencing is mainly based on the assumption that the DNA methylation status of the DNA to analyze has no major impact on PCR amplification subsequent to bisulfite conversion. However, a high number of CG loci in the sequence to analyze as well as primer binding sites containing CG loci might result in the preferential amplification or sequencing of originally either methylated or unmethylated DNA leading to erroneous results. Thus, if highly accurate DNA methylation analysis is a concern, we would recommend performing a DNA methylation analysis of a serial dilution of fully methylated DNA (e.g. either commercially available methylated DNA or M.SssI-treated DNA) and unmethylated DNA (e.g. generated by whole genome amplification ). A subsequent comparison of the bisulfite pyrosequencing analysis with the expected results might reveal a potential bias of the PCR amplification or the sequencing reaction. Furthermore, a serial dilution might be helpful for correcting the results obtained from the analysis.


References
Bestor TH (2000) The DNA methyltransferases of mammals. Hum Mol Genet 9(16):2395–2402
Brenner C, Fuks F (2006) DNA methyltransferases: facts, clues, mysteries. Curr Top Microbiol Immunol 301:45–66
Cheng X, Blumenthal RM (2008) Mammalian DNA methyltransferases: a structural perspective. Structure 16(3):341–350. doi:10.1016/j.str.2008.01.004
Gowher H, Jeltsch A (2004) Mechanism of inhibition of DNA methyltransferases by cytidine analogs in cancer therapy. Cancer Biol Ther 3(11):1062–1068
Wigler MH (1981) The inheritance of methylation patterns in vertebrates. Cell 24(2):285–286
Clark SJ, Harrison J, Frommer M (1995) CpNpG methylation in mammalian cells. Nat Genet 10(1):20–27. doi:10.1038/ng0595-20
Gama-Sosa MA, Wang RY, Kuo KC, Gehrke CW, Ehrlich M (1983) The 5-methylcytosine content of highly repeated sequences in human DNA. Nucleic Acids Res 11(10):3087–3095
Hsieh J, Gage FH (2004) Epigenetic control of neural stem cell fate. Curr Opin Genet Dev 14(5):461–469. doi:10.1016/j.gde.2004.07.006
Lopez-Serra L, Esteller M (2008) Proteins that bind methylated DNA and human cancer: reading the wrong words. Br J Cancer 98(12):1881–1885. doi:10.1038/sj.bjc.6604374
Morgan HD, Santos F, Green K, Dean W, Reik W (2005) Epigenetic reprogramming in mammals. Hum Mol Genet 14 Spec No 1:R47–R58. doi:10.1093/hmg/ddi114
Plass C, Smiraglia DJ (2006) Genome-wide analysis of DNA methylation changes in human malignancies. Curr Top Microbiol Immunol 310:179–198
Robertson KD (2001) DNA methylation, methyltransferases, and cancer. Oncogene 20(24):3139–3155. doi:10.1038/sj.onc.1204341
Robertson KD (2005) DNA methylation and human disease. Nat Rev Genet 6(8):597–610. doi:10.1038/nrg1655
Simonsson S, Gurdon JB (2005) Changing cell fate by nuclear reprogramming. Cell Cycle 4(4):513–515
Smith SS (1991) DNA methylation in eukaryotic chromosome stability. Mol Carcinog 4(2):91–92
Smith SS, Crocitto L (1999) DNA methylation in eukaryotic chromosome stability revisited: DNA methyltransferase in the management of DNA conformation space. Mol Carcinog 26(1):1–9
Turek-Plewa J, Jagodzinski PP (2005) The role of mammalian DNA methyltransferases in the regulation of gene expression. Cell Mol Biol Lett 10(4):631–647
Soejima H, Wagstaff J (2005) Imprinting centers, chromatin structure, and disease. J Cell Biochem 95(2):226–233. doi:10.1002/jcb.20443
Brueckner B, Kuck D, Lyko F (2007) DNA methyltransferase inhibitors for cancer therapy. Cancer J 13(1):17–22. doi:10.1097/PPO.0b013e31803c7245
Ghoshal K, Bai S (2007) DNA methyltransferases as targets for cancer therapy. Drugs of Today 43(6):395–422. doi:10.1358/dot.2007.43.6.1062666
Cooper WN, Luharia A, Evans GA, Raza H, Haire AC, Grundy R, Bowdin SC, Riccio A, Sebastio G, Bliek J, Schofield PN, Reik W, Macdonald F, Maher ER (2005) Molecular subtypes and phenotypic expression of Beckwith-Wiedemann syndrome. Eur J Hum Genet 13(9):1025–1032. doi:10.1038/sj.ejhg.5201463
Shuman C, Beckwith JB, Smith AC, Weksberg R (1993) Beckwith-Wiedemann Syndrome. In: Pagon RA, Adam MP, Ardinger HH et al (eds) GeneReviews(R). Seattle (WA),
Hegi ME, Diserens AC, Godard S, Dietrich PY, Regli L, Ostermann S, Otten P, Van Melle G, de Tribolet N, Stupp R (2004) Clinical trial substantiates the predictive value of O-6-methylguanine-DNA methyltransferase promoter methylation in glioblastoma patients treated with temozolomide. Clin Cancer Res 10(6):1871–1874
Parkinson JF, Wheeler HR, Clarkson A, McKenzie CA, Biggs MT, Little NS, Cook RJ, Messina M, Robinson BG, McDonald KL (2008) Variation of O(6)-methylguanine-DNA methyltransferase (MGMT) promoter methylation in serial samples in glioblastoma. J Neurooncol 87(1):71–78. doi:10.1007/s11060-007-9486-0
Yachi K, Watanabe T, Ohta T, Fukushima T, Yoshino A, Ogino A, Katayama Y, Nagase H (2008) Relevance of MSP assay for the detection of MGMT promoter hypermethylation in glioblastomas. Int J Oncol 33(3):469–475
Mund C, Brueckner B, Lyko F (2006) Reactivation of epigenetically silenced genes by DNA methyltransferase inhibitors: basic concepts and clinical applications. Epigenetics 1(1):7–13
Ammerpohl O, Martin-Subero JI, Richter J, Vater I, Siebert R (2009) Hunting for the 5th base: techniques for analyzing DNA methylation. Biochim Biophys Acta 1790(9):847–862. doi:10.1016/j.bbagen.2009.02.001
Frommer M, McDonald LE, Millar DS, Collis CM, Watt F, Grigg GW, Molloy PL, Paul CL (1992) A genomic sequencing protocol that yields a positive display of 5-methylcytosine residues in individual DNA strands. Proc Natl Acad Sci U S A 89(5):1827–1831
Kladde MP, Xu M, Simpson RT (1999) DNA methyltransferases as probes of chromatin structure in vivo. Methods Enzymol 304:431–447
Lutsenko E, Bhagwat AS (1999) Principal causes of hot spots for cytosine to thymine mutations at sites of cytosine methylation in growing cells. a model, its experimental support and implications. Mutat Res 437(1):11–20
Author information
Authors and Affiliations
Corresponding author
Editor information
Editors and Affiliations
Rights and permissions
Copyright information
© 2016 Springer Science+Business Media New York
About this protocol
Cite this protocol
Ammerpohl, O., Haake, A., Kolarova, J., Siebert, R. (2016). Quantitative DNA Methylation Profiling in Cancer. In: Grützmann, R., Pilarsky, C. (eds) Cancer Gene Profiling. Methods in Molecular Biology, vol 1381. Humana Press, New York, NY. https://doi.org/10.1007/978-1-4939-3204-7_5
Download citation
DOI: https://doi.org/10.1007/978-1-4939-3204-7_5
Publisher Name: Humana Press, New York, NY
Print ISBN: 978-1-4939-3203-0
Online ISBN: 978-1-4939-3204-7
eBook Packages: Springer Protocols