
Abstract
Pulmonary function tests (PFTs) are diagnostic modalities that evaluate qualitatively and quantitatively the size and function of the lungs. The most common areas of evaluation in clinical practice are: (a) the measurement of the lung volume, (b) the assessment and measurement of the airway function (upper and lower), and (c) the ability of the lung to diffuse oxygen. Several other tests can be performed to evaluate specific aspects of the lung function such as lung or respiratory system compliance and resistance, airway hyperreactivity/hyperresponsiveness, airway inflammation. This chapter focuses on the principles of interpretation (and its pitfalls) of the most commonly used tests that are commercially available for use in children and adolescents in an inpatient or outpatient setting.
Access provided by Autonomous University of Puebla. Download chapter PDF
Keywords
- Pulmonary function tests
- Lung volume
- Airway function
- Airway hyperreactivity/hyperresponsiveness
- Airway inflammation
Indications
PFTs are not pathognomonic of a specific disease but they can be highly specific of the type of the disease process (e.g., obstructive vs. restrictive lung disease) and most importantly of which component of the lung function is affected. In general, obtaining PFTs should be considered in the following situations: (a) to determine the specific nature of an unknown disease process (e.g., obstructive vs. restrictive lung defects); (b) to study the progression of a known condition (e.g., changes in lung function in a patient with cystic fibrosis); (c) to evaluate the effect of a particular therapy (e.g., reversibility of lower airway obstruction after treatment with bronchodilator); (d) to establish a baseline in patients whose lung function may be affected in various often unpredictable ways either by a disease process and/or by its treatment (e.g., a patient with malignancy who is about to start treatment with radiation and chemotherapy).
Evaluation of Lung Volumes
Background
Volume is the amount of space taken up by an object, whereas capacity is the amount of a substance that can be held by an object. If the object has a fixed volume, its capacity will depend on the substance that is filling it (e.g., air vs. liquid). In the case of the respiratory system, lung volume is the space the lungs occupy inside the thoracic cavity and lung capacity is the amount of air the lungs can hold. The lung volume and the corresponding capacity are not fixed, but they change as the lungs inflate and deflate.
The evaluation of lung volumes consists of measurements at different phases of the respiratory cycle. The total lung capacity (TLC) is the maximum amount of air that the lungs can hold (Fig. 7.1). Functional residual capacity (FRC) is the amount of air that fills the lungs in between breaths, and it is at that level where the actual breathing occurs. The tidal volume (VT) (the amount of air taken into the lungs with a regular breath), inflates the lungs above the level of FRC. The amount of air that can fill the lungs from FRC to TLC is the inspiratory capacity (IC), whereas, the maximal amount of air that can be emptied from FRC with a maximal exhalation is the expiratory reserve volume (ERV). The amount of air that remains inside the lungs after a maximal exhalation is the residual volume (RV). The amount of air that can inflate the lungs from RV to TLC is the slow (or inspiratory) vital capacity (SVC), whereas the amount of air that can be exhaled during a forced exhalation from TLC to RV is the forced vital capacity (FVC).

Schematic representation of the total lung capacity and its various subdivisions (for explanation of the abbreviations, see text)
The TLC, RV, and FRC are “static” lung volumes (also referred to as “absolute” volumes), whereas all the others are “dynamic.” The static lung volumes depend on the interactions between the compliance and elastic recoil of the lung and of the chest wall, as well as on the strength of the respiratory muscles. Diseases and conditions affecting the lung parenchyma such as fibrosis, interstitial lung disease, pulmonary edema, atelectasis, etc. are characterized by low lung compliance that limits the distensibility of the lungs, and thus the TLC. The same is true for conditions limiting the expansion of the chest wall, either due to chest wall deformity (severe kyphoscoliosis, asphyxiating thoracic dystrophy, etc.), and/or due to respiratory muscle weakness (e.g., spinal muscular atrophy). The FRC depends on the balance between the elastic recoil of the lungs and of the chest wall. The RV depends on the expiratory muscle strength, the elastic recoil of the lung and of the chest wall, and on the airway closure. Thus, elevated RV can occur both due to premature airway closure as in obstructive lung diseases, but also due to thoracic cage abnormalities or expiratory muscle weakness that prevent the chest wall from returning to its neutral position. In a normal healthy lung the various measured volumes and capacities are in a specific and pretty consistent relationship to each other, that changes relatively little throughout life (Table 7.1).
Lung volumes can be measured with three basic methods. It is beyond the scope of this chapter to explain in detail the theory behind and the technical aspects of each method. However, it is important to know and understand their basic differences because they often have a direct impact on the interpretation of the results. The first method is based on gas dilution. Its two most common applications are the Helium dilution and the Nitrogen washout. In the Helium dilution technique, the patient is breathing a tracer gas (Helium) from a container with known volume. When steady state is achieved, the Helium is equilibrated between the lungs and the container. The difference in the volume of the container before and after the equilibrium has been achieved is assumed to represent the FRC. In the Nitrogen washout, the patient is breathing 100 % oxygen that “washes” the nitrogen out of the lungs. Since the nitrogen exists in a fixed concentration in the lungs and it is not diffused into the blood stream like the oxygen, the measured amount that is washed out can be used to calculate the FRC. Both techniques are performed while the patient breathes with regular tidal breaths and thus they require minimal cooperation from the patient.
The second method is the body plethysmography that measures the compressible thoracic volume during a panting maneuver. The technique is sensitive, reproducible and accurate. However, it requires a certain level of cooperation from the patient that cannot be achieved by young children. Body plethysmography measures the air in the thoracic cavity (TGV), not just in the lungs. The third method is the estimation of lung volume from standard chest radiographs (or from computed tomography) based on mathematical formulas that measure the volume within the perimeter of the thoracic cage and the diaphragm (minus the volume of the mediastinum). This technique is very rarely used in clinical practice especially in pediatrics.
In a healthy normal individual there is very little difference between the measurements made by the gas dilution techniques compared with those obtained by body plethysmography. However, significant differences do exist when measurements are made in patients with obstructive lung disease. This is because the gas dilution techniques are measuring the communicating gas volume whereas the body plethysmography measures the compressible gas volume in the thoracic cavity. Thus, in cases of severe air-trapping or of non-communicating air-filled cystic lesions, the gas dilution techniques tend to underestimate the lung volume. On the other hand body plethysmography may overestimate the lung volume because it may take into account even air that is not in the thoracic cavity (e.g., abdominal “bloating,” or large oropharyngeal cavity). Therefore, when comparing results it is important to know what technique was used for each of the measurements. Ideally, both techniques should be used. In such case, the difference between the TGV and the FRC is assumed to represent the true air-trapping.
Interpretation
The critical parameter for the interpretation of lung volumes is the TLC. If it is below the predicted normal values then there is loss of lung volume. An increased TLC can be found either in cases of generalized hyperinflation or in individuals with large lungs (fairly commonly seen in athletes). What determines the type of a disease process (i.e., restrictive or obstructive) is the relationship of the TLC to its subdivisions. Thus, in a healthy individual the TLC and all of its subdivisions are within the normal range and proportional to each other as outlined in Table 7.1. Similarly, in restrictive lung defects, the TLC and all of its subdivisions are proportionately decreased, so the ratios of the various subdivisions to TLC remain the same as in a healthy lung. In contrast, in obstructive lung diseases the TLC can be normal, increased (in case of generalized hyperinflation) or even decreased (in case of a mixed defect). However, regardless of the actual value of TLC, the ratios of RV/TLC, FRC/TLC are increased and as a result the VC and the IC are going to be decreased.
There are very limited data on lung volumes for non-Caucasians. Blacks are supposed to have smaller lung volumes than whites by approximately 15 %. In some PFT laboratories, the software automatically subtracts 15 % of the predicted normal values for whites but in others this has to be done manually, otherwise all black patients will appear to have a “restrictive lung disease.” Thus, when interpreting a test that was performed in an outside laboratory, it is very important to determine what predicted normal values the laboratory is using. There is very little information on lung volumes for other racial groups (although Hispanics tend to have values that are more similar to whites than blacks).
Evaluation of the Airway Function
Background
The respiratory tract is essentially a continuum that starts from the nose and ends in the alveoli. For purposes of convenience the different segments of the respiratory tree are classified as into “upper” airways, that consist of the nose, pharynx, larynx and the extrathoracic part of the trachea, and the “lower” airways, that include the intrathoracic trachea, and all generations of the bronchii. The intrathoracic airways are further divided into the large or “central” airways (main stem, lobar and segmental bronchii) and the small or “peripheral” airways. These distinctions are useful because different diseases processes and conditions affect primarily or selectively some but not all (or at least not to the same degree) of these groups.
The evaluation of the airway function essentially refers to the direct or indirect measurement of the resistance to airflow posed by the airways. Although direct measurements of the airway resistance can be made, the most commonly used evaluation in clinical practice is the spirometry/maximal expiratory flow–volume curve (MEFVC) (Fig. 7.2). The test is performed with a forced exhalation from TLC to RV, the latter being the point when there is no more flow. The exhaled volume is plotted against time, thus allowing its extrapolation into flow rate. Measurements are being made either on volumes exhaled in a particular unit of time (e.g., FEV1 is the volume exhaled during the first second of exhalation) or in terms of flow rate at specific levels of lung deflation. Although measurements can be made at any level, the standard measurements usually include the maximal expiratory flow (FEFmax), and the forced expiratory flow rates when 25 %, 50 % and 75 % (FEF25, FEF50 and FEF75) of the FVC has been exhaled. The average flow rate between 20 and 75 % of FVC (FEF25–75) is also calculated.

Normal maximal expiratory and inspiratory flow–volume curve depicting the various indices of lung function. Note the difference in the shape of the expiratory and inspiratory curves as well as the small size of the tidal breath relative to FVC
The rationale for and clinical significance of these measurements is based on the fact that the volume of exhaled air and the flow rates measured in the beginning of exhalation (roughly during the first 25 % of the vital capacity) reflect primarily the resistance to airflow posed by the large airways, whereas the flow rates measured towards the end exhalation (generally after 50 % of the vital capacity has been exhaled), reflect primarily the resistance of the small peripheral airways. Thus, the test provides not only a quantitative assessment of the obstruction but it can also specify which part of the tracheobronchial tree is primarily affected. More specifically, the proximal portion of the MEFV curve (approximately between 100 and 75 % of the FVC) reflects the function of the large airways (distal trachea, main stem bronchii, segmental bronchii) and is represented primarily by the PEFR, FEF25 and in part by the FEV1. The middle portion of the curve (reflected by the FEF25, FEF50, and in part by the FEV1 and the FEF25–75) represents the function of the medium sized central airways. The distal portion of the curve (represented by the FEF75 and in part by the FEF25–75) reflects the function of the small peripheral airways.
One of the major advantages of the MEFVCs is that they are in part “effort independent.” The beginning of the forced exhalation (that includes the FEFmax, the FEV1, and the FEF25), depends primarily on the strength of the expiratory muscles and on the overall understanding and cooperation of the patient and therefore it is “effort dependent.” In contrast, the later part of the exhalation depends entirely on the elastic recoil of the lungs, and thus it is “effort independent.” Figure 7.3a, b illustrates this point. Figure 7.3a shows three superimposed curves with the same vital capacity but with different degree of effort during exhalation. Although the FEFmax, the FEF25, and the FEF50 vary significantly between the different curves, the flows at the distal end are virtually identical. Similarly, in Fig. 7.3b there are several superimposed MEFV curves produced with the same amount of effort but from different volumes. The curves are very different in their proximal (effort dependent) limb, but they are virtually identical in their distal end that consists of the effort independent portion. As a result measurements made in the effort dependent portion of the MEFV curve should be interpreted with caution especially if there is doubt about the amount of effort the patient made.

(a) Three superimposed expiratory flow–volume curves with virtually the same FVC, but produced with different effort. As a result there is significant difference in the measured FEFmax and FEF25. However, there are no differences in the distal end of the MEFVC that is the effort-independent portion. (b) Multiple MEFVCs with different volume but produced with the same amount of effort. The MEFVCs differ in the FVC but their distal (effort independent) portion is superimposable
The function of the upper airways can be evaluated with the performance of maximal inspiratory flow–volume (MIFV) curves produced with a maximal breath from RV to TLC. In contrast with the triangular shape of the MEFV curve, the MIFV curve of a person with normal extrathoracic airways has a semicircular shape (Fig. 7.2). As a result, the maximal inspiratory flow occurs at approximately 50 % of the VC, thus corresponding with the FEF50 and not with the FEFmax that is measured in the very beginning of forced exhalation. In a healthy lung with normal airways the ratio of FEF50/FIFmax is approximately 1.
Interpretation of Maximal Expiratory Flow–Volume Curves
Disease processes affect not only the values of measured parameters but the overall shape of the MFVCs as well. Thus, a fairly accurate qualitative assessment of the nature of the problem can be often made by the visual inspection of the curves. The following patterns can be identified.
-
“Normal” (Fig. 7.2): The expiratory curve that has the shape of a “right triangle,” with a sharp peak and a straight (and occasionally convex) descending limb (in reality, the angle between the ascending limb and the horizontal axis is less than 90°). The inspiratory MFV curve has a very different configuration resembling “half-circle.”
-
“Obstructive” (Fig. 7.4): The MEFV curve of a patient with obstructive lung disease has a characteristic concave appearance. The degree of concavity varies and it may involve only part or the entire length of the expiratory limb. The small, peripheral airways are the first and more severely affected, whereas the larger airways can be relatively spared. It is not uncommon, to have significant (even severe) decrease in FEF25–75 but “normal” FEV1 and FEFmax. It is important to note that the inspiratory MFVC is usually not affected in obstructive lung defects.
Fig. 7.4 
Different variations of lower airway obstruction. All MEFVCs show concavity in their distal end indicating small airway obstruction but only some show significant involvement of the large airways. Note that in all of them the degree of lower airway obstruction has minimal or no effect on the inspiratory flows
-
“Restrictive” pattern (Fig. 7.5): The MFEV curve in restrictive lung defects may look like a “miniature” normal. However, because they are usually associated with conditions that cause an increase in the elastic recoil of the lungs, the produced expiratory flow rates are higher than normal and the MEFVC has a very tall and narrow shape, almost resembling an “isosceles triangle.” In such cases, the inspiratory MIFV curve may be a “mirror image” of the MEFV curve.
Fig. 7.5 
(a) The MEFVC in patients with restrictive lung defect often resembles a “miniature” of a normal MEFVC. (b) Severe restrictive lung defects (often seen in patients with chest wall muscle weakness) present with a characteristic tall and narrow flow–volume curve, in which the inspiratory curve appears like a “mirror-image” of the expiratory curve
-
“Variable intrathoracic soft tissue obstruction” (Fig. 7.6): Conditions such as tracheobronchomalacia that affect the large and central airways, produce a characteristic flattening of the proximal portion of the MEFVC. In such cases the maximal inspiratory flow–volume curve is usually normal.
Fig. 7.6 
Patient with severe tracheobronchomalacia following repair of tracheoesophageal fistula at birth. The airway closes almost immediately after the beginning of exhalation limiting all the measured expiratory flow rates. However, there is virtually no effect on the inspiratory flows
-
“Variable extrathoracic soft tissue obstruction” (Fig. 7.7): Affected patients have a very characteristic flattening of the inspiratory portion of the MFVC, whereas the expiratory portion remains unaffected. A ratio of FEF50/FIFmax > 1.2 is highly suggestive of variable extrathoracic soft tissue obstruction.
Fig. 7.7 
The inspiratory flow–volume curve is flattened limiting the maximal inspiratory flow (FIF50) to less than half of the FEF50 . The expiratory flow–volume curve is normal. Similar picture can be seen in a healthy normal individual due to closure of the vocal cords during inspiration. Thus, it is imperative to document that the flattening of the inspiratory flow–volume curve occurs consistently in all the efforts
-
“Fixed airway obstruction” (Fig. 7.8): A fixed airway obstruction produces a very characteristic flattening of the inspiratory and expiratory portions of the MFVC (Fig. 7.8a). In such cases the obstruction is in the large intrathoracic airways (e.g., vocal cords, subglottic space, mid-trachea). Affected patients present with a biphasic (inspiratory/expiratory) sound that is a mixture of “harsh wheeze” and “muffled stridor.” The noise will be worse with activity and diminishes during sleep due to the shallow breathing. Although fixed airway obstruction is usually due to a structural abnormality, it can be also caused by functional disorders such as vocal cord dysfunction (Fig. 7.8b). The patient may present with severe inspiratory/expiratory wheezing, not responding to any treatment and they are usually anxious or panicky. If they can perform spirometry they produce a picture of very severe fixed airway obstruction that resolves spontaneously as soon as the patient relaxes (Fig. 7.8c).
Fig. 7.8 
(a) Acquired tracheal stenosis secondary to radiation therapy for lymphoma. The fact that both the expiratory and inspiratory flow–volume curves are flattened to the same degree indicates that the obstruction is very high up in the tracheobronchial tree (mid-trachea). (b) The test shows very severe fixed airway obstruction. The patient had audible inspiratory and expiratory wheezing but no hypoxemia. (c) Repeat effort a few minutes later produced a normal flow–volume curve. The patient had received no medication but she had been distracted through conversation. This is characteristic of vocal cord dysfunction


Pitfalls in the Interpretation of MEFVCs
There are several potential pitfalls in the performance of MFVCs that may affect their interpretation. The most common ones, especially among young children are due to poor technique/effort.
-
1.
“Incomplete” (Fig. 7.9): the patient stopped the exhalation prematurely, before it reached the point of RV. This is reflected in the abrupt termination of the expiratory flow (vertical drop) and it is a common problem with young children and/or with patients who cannot exhale for several seconds. When this occurs, the computer software, “assigns” the point of the cessation of flow as the RV, thus underestimating the value of the true FVC and overestimating the values of the FEFs. This combination of decreased FVC and increased expiratory flow rates can be easily misinterpreted as “restrictive lung defect” when in fact the lung function may be normal or obstructive. Thus, it is imperative to verify whether the measured parameters correlate with the shape of the MEFVC.
Fig. 7.9 
The patient interrupted the exhalation prematurely as indicated by the vertical drop of the descending limb. As a result, the FVC is underestimated and the expiratory flow rates (red dotted arrows) overestimated. The black dashed arrows and line represent what the true flows and FVC would have probably been had the patient exhaled completely. Although most of the measured values are erroneous, one can still infer that the lower airway function is probably within the normal range because the flow–volume curve is convex, the FEV1 and the FEFmax (that are not affected by the premature inspiration) are within the normal range, and even the FVC although underestimated is borderline normal. It should be noted that interpretation of the test without examining the flow–volume curve would have led to the erroneous conclusion of a mild restrictive defect based on the borderline “low” FVC and the disproportionately increased FEFs
Although an incomplete MEFVC is not considered valid for interpretation it often contains useful and clinical information. Specifically, presence of lower airway obstruction can be reliably assumed (a) when the MEFVC has a clear concave pattern, (b) when the FEV1 and the measured expiratory flows are disproportionately low relative to the FVC despite the fact that they are overestimated. In addition, a reasonably valid assessment can be made about the lung volume. Specifically, if the value of the measured FVC is close to or within the normal range despite the fact that it is underestimated, one can safely assume that the lung volume is within the normal range. Finally, because the incomplete effort is affecting the distal part of the MEFV curve, it does not affect the FEFmax and/or the FEV1 that are measured in the beginning of exhalation. It is up to the interpreter’s judgment to decide whether an incomplete MEFV curve can be interpreted but when it is made the interpretation should be explicit as to what values are valid and why.
-
2.
“Submaximal” MEFV curve (Fig. 7.10) is the result of (a) a submaximal inhalation that failed to inflate the lungs to TLC, (b) a submaximal exhalation because the patient did not exhale with maximal force, (c) submaximal effort only in the beginning of the exhalation. The latter is probably the most common among young children who seem to have trouble understanding the concept of blowing-out “fast and hard.” In the first two cases all measured parameters are going reduced, but the proportions among them remain the same. In the third case, the parameter that is mostly (or exclusively) affected is the FEFmax and to a lesser extent the FEF25 and the FEV1. Thus, their percent predicted value is going to be considerably higher than that of the FEFmax.
Fig. 7.10 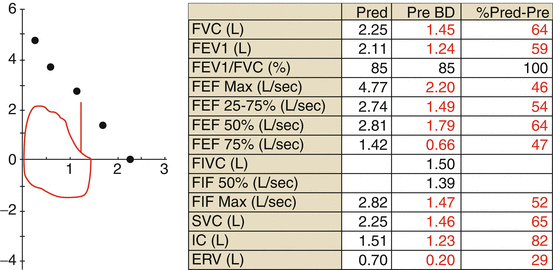
A submaximal effort can be easily misinterpreted as “restrictive lung defect” (proportionate decrease in FVC, FEV1, and all expiratory flow rates)
-
3.
“Non-interpretable” (Fig. 7.11): the curve does not have any recognizable pattern, usually due to excessive cough, very premature inspiratory efforts (occurring at <50 % of the FVC), leak around the mouthpiece, etc. In such case, no interpretation can or should be given.
Fig. 7.11 
This is a non-interpretable test because it does not have a recognizable pattern, it has a submaximal start, artifacts, and premature termination of the exhalation
-
4.
Evaluation of lung volume. The MEFVCs can provide a basic quantitative assessment of lung volume with the measurement of the FVC. A normal FVC usually corresponds with a normal total lung capacity (i.e., TLC). An increased FVC suggests the presence of large lungs (commonly seen among athletes) or some degree of generalized hyperinflation. A decrease in FVC can be seen when there is actual loss of lung volume, but it can be also the result of air-trapping. Thus, a decrease in FVC should be further evaluated by measurements of lung volumes in order to determine whether the decrease is due to loss of lung volume or due to air-trapping. This is particularly important when the MEFVC does not have a definite pattern of obstructive or restrictive lung disease (Fig. 7.12).
Fig. 7.12 
Interpreting only the spirometric part of this test would lead into the conclusion that the patient has a mild restrictive lung defect (decreased FVC with the FEV1 and all expiratory flow rates being increased relative to FVC). However, measurement of the lung volumes reveals that the total lung capacity is completely normal and that the SVC (and FVC) are actually decreased because of significant air-trapping


Evaluation of Hyperreactivity and (Hyper) responsiveness
Background
The terms airway/bronchial hyperreactivity (or simply reactivity) and airway/bronchial hyperresponsiveness (or responsiveness) are often used interchangeably to describe bronchoconstriction and/or bronchodilation. In this chapter, the term hyperreactivity refers to bronchoconstriction, whereas hyperresponsiveness refers to bronchodilation.
The presence of airway hyperreactivity can be assessed with the performance of a bronchoprovocation challenge. In such studies, the patient performs MEFV curves before and after exposure (usually by inhalation) to substances capable of causing bronchoconstriction. The most common direct challenge is by meth choline that is being inhaled in increasing concentrations until a predetermined drop in one or more of the measured indices occurs (most commonly, a 20 % decrease from baseline in the FEV1). MEFV curves are performed after each concentration (Fig. 7.13a, b). If the decrease in FEV1 occurs with a concentration of ≤1 mg/ml, the test is considered “positive,” and the likelihood of asthma is high. If there is no significant decrease with concentrations of ≥16 mg/ml, asthma is effectively ruled out. Histamine can be also used instead of methacholine under the same criteria.

Exercise challenge test. Baseline spirometry was normal. Post-exercise spirometry showed significant decrease in all indices and change in the shape of the flow–volume curve from convex to concave. Post-bronchodilator spirometry showed that all values had returned to their baseline levels
Challenges can also be performed with nonspecific substances such as hypertonic saline, mannitol, adenosine monophosphate or even with exposure to a suspected allergen. Non-pharmacologic challenges include exercise (Fig. 7.13), and eucapneic hyperventilation. Which test should be performed depends on what question the test aims to answer. Direct challenges (e.g., methacholine) are very sensitive but not specific, and therefore they are best in ruling out airway hyperreactivity. Indirect challenges such as exercise challenge are very specific but not as sensitive, and therefore they are very good in confirming presence of airway hyperreactivity (e.g., exercise induced asthma). The presence of airway hyperresponsiveness is usually assessed by the performance of spirometry/MEFV curves before and after the administration of bronchodilators.
Interpretation
The most commonly used criterion for the presence of hyperreactivity is the decrease in FEV1 by 20 % from baseline and the dose that causes such decrease is termed “provocative dose” (PD20). Despite its widespread use it may not be the most appropriate criterion for the evaluation of young children however. This is because the majority of children with mild to moderate obstructive lung disease such as asthma and Cystic Fibrosis may exhibit decreases primarily in the expiratory flow rates reflecting the small airway function and very little change in the FEV1 (and/or the FEFmax) that reflect primarily the large airways. In addition, both the FEV1 and the FEFmax are effort dependent variables, and therefore a significant decrease may occur as a result of poor effort and not necessarily because of bronchoconstriction. For these reasons we would recommend that the response to a challenge and/or to bronchodilator should be based on the changes in all indices of airway function.
The most important probably criterion for the presence of bronchoconstriction or of bronchodilation is the change in the configuration of the MEFV curve. True bronchoconstriction or bronchodilation should be manifested by a change in the slope of the MEFV curve (Fig. 7.14a). In children, the change in slope may often be seen only in the effort independent portion. A change only in the FEFmax and in FEV1 is probably due to effort (Fig. 7.14b). What percentage change is clinically significant is still rather undetermined. We recommend the following: FVC ≥ 10 % from baseline; FEV1 ≥ 12 %; FEFmax ≥ 25 % and FEF25–75 ≥ 25 %. What is very important for every laboratory and for every professional who interprets the tests is to be consistent in the criteria they use.

(a) True response to bronchodilator is indicated by significant increase in the measured indices and by change in the slope of the flow–volume curve. (b) An increase in the measured indices without change in the slope of the flow–volume curve could be due to a better inspiratory/expiratory effort. However, it does not rule out presence of hyperresponsiveness
Evaluation of the Diffusing Capacity
Background
The measurement of the diffusing capacity (DL) is a commonly used test that evaluates the ability of carbon monoxide (CO) to pass from the alveolar space into the capillary circulation. The DL is defined as the rate at which the CO enters the blood, divided by the difference in partial pressure between the alveoli and the pulmonary capillaries that is the driving force for the diffusion. The measurement of the diffusing capacity of CO is used as surrogate of the diffusion of oxygen. The reason for the use of the CO is based on the fact that its affinity for hemoglobin is 200 times greater than that of oxygen and therefore it is bound to Hb very rapidly, and because under normal circumstances its partial pressure in the blood is close to zero.
The most commonly used technique for the measurement of DLCO is the single breath technique (DLSB), in which the patient exhales to RV and then rapidly inspires to TLC a mixture of gas that contains a small amount of CO (0.3 or 0.5 %), as well as an inert gas (usually Helium or methane). The patient is instructed to hold his/her breathe for a period of 10 s, during which the CO is diffused through the alveolar membrane into the blood stream and it is combined with Hb. After 10 s the patient exhales. The difference in CO between the inspired air and the expired air is assumed to be due to the combined with Hb CO and it allows for the calculation of the rate of the diffusion.
The resistance to diffusion by the alveolar membrane (Dm) depends on multiple factors including the overall gas exchange area, the thickness of the alveolar membrane, the affinity to hemoglobin, the amount of available Hb, and the pulmonary capillary blood volume. Conditions that alter any or all of these factors will affect the diffusing capacity as well. Such conditions include absolute loss of lung volume (e.g., decrease in TLC due to significant scoliosis); loss of gas exchange surface area regardless of changes in TLC (e.g., destruction of alveoli in emphysema); loss of alveolar space (e.g., filling of the alveoli with material other than air as in the case of alveolar proteinosis); thickening of the alveolar membrane (e.g., fibrosis); severe anemia (e.g., sickle cell crisis); decreased perfusion of the lung (e.g., severe pulmonary hypertension); increased partial pressure of CO in the capillaries that prevents the diffusion (e.g., heavy smokers may develop carboxyhemoglobin in excess of 10 %).
The DLCO is dependent on the lung volume. This means that a larger lung is going to diffuse more CO than a smaller lung even if they are both normal. To adjust for these differences, the DLCO is corrected for the alveolar volume (DLCO/VA). This ratio is known as “diffusion constant” and it a measure of efficiency of the functioning units of the lungs.
Interpretation
In a healthy lung, the diffusing capacity and the diffusion constant are pretty proportional. Both restrictive and obstructive lung diseases can affect the DLCO and its decrease in absolute terms is proportional to the lung volume (e.g., if hypothetically a healthy lung diffuses 100 molecules of CO, a 50 % decrease in TLC will result in the diffusion of only 50 molecules). However, the diffusion constant will be still normal. In certain conditions, when the decrease in DLCO is due to vascular reasons (e.g., sickle cell disease, pulmonary hypertension) the body has certain compensatory mechanisms (e.g., increase in the heart rate and decrease in transit times of the red cells through the capillaries) that increase the “efficiency” of the ventilated and perfused areas. Thus, although the absolute value of the DLCO will be low, the DLCO/VA will be normal or even increased compared with the normal.
In cases of pulmonary hemorrhage the measurement of DLCO can be of great importance both diagnostically and for the monitoring of the condition. Pulmonary hemorrhage generally decreases the TLC because of the flooding of the alveoli with blood. This normally would result in decreased DLCO. However, the red cells that are in the alveolar spaces bind the molecules of CO before it even gets diffused into the capillaries and as a result the measured DLCO is abnormally high especially in relation to the decreased lung volume. As the pulmonary hemorrhage resolves and the alveolar spaces gradually empty from the red cells, the measured DLCO decreases (Fig. 7.15).

Serial PFTs in a patient who had undergone bone marrow transplant. In the first column the TLC and the DLCO are within the normal range and proportional to each other (in terms of their %predicted values). In the second column there has been a significant decrease in TLC whereas the DLCO actually increased that is a typical finding in cases of pulmonary hemorrhage. The hemorrhage was confirmed by bronchoscopy. The third column shows a decrease in the DLCO to levels proportional to the TLC reflecting the clearing of the blood from the alveolar spaces
Special Issues
“Normal” Versus “Within the Normal Range”
The absolute values of the various indices of lung function differ significantly among different individuals depending on their age, race, gender and size (primarily the height). Thus, the absolute value of any of the indices of lung function does not convey by itself the degree of normalcy, i.e., the same value may be completely normal for an individual and completely abnormal for another. Thus, the measured indices are usually presented as percentage of the predicted normal (“%pred”) values derived from measurements made in asymptomatic healthy individuals of same age, gender, race and height. Values within 2 standard deviations above or below the mean are considered to represent the “normal range.” This system is easily understood by patients and doctors alike and it allows for easy comparisons between patients and/or between testing periods on the same patient.
It is very important to emphasize that having a value within the “normal range” is not synonymous to being “normal.” To be interpreted as normal a test requires that each of the measured indices is within the normal range but also that they are proportional to each other. This is because the “range of normal” for virtually all indices is pretty wide (e.g., it ranges from approximately 90–110 % for the FVC to almost 60–140 % for the FEF25–75). For example, the MEFVC in Fig. 7.16a as well as the ratio FEV1/FVC show a clear obstructive pattern, although both the FVC and the FEV1 are within their respective normal range. The same degree of obstruction can be seen in Fig. 7.16b although both the FVC and the FEV1 are well below the lower level of normal. On the other hand, in Fig. 7.16c, the decrease in both the FVC and the FEV1 is proportional and therefore the airway function (although not the lung volume) is normal.

The ratio FEV1/FVC does not depend on how normal or abnormal the values of its components are. (a) The ratio FEV1/FVC is low although both the FVC and the FEV1 are within the normal range. (b) The ratio FEV1/FVC is the same with the one from (a) although the FVC and the FEV1 are below the lower normal levels. (c) The ratio FEV1/FVC is above the predicted normal although both the FVC and the FEV1 are abnormally low
Despite their usefulness, the various series of predicted normal values have also a number of inherent problems. This is mainly because they have not been derived from repeated longitudinal measurements on the same cohort of individuals but from different cohorts that varied from each other. Values for non-Caucasians are much less accurate and often based on gross and inaccurate generalizations (for example, series on predicted normal values from Mexican-Americans had been used for a long-time for all patients classified as “Hispanics” despite the often obvious differences between them).
In order to minimize these problems an effort has been undertaken to compile databases with the contribution of data from many parts of the world. The product of this effort is the Global Lung Function Initiative (GLI) Reference Equations for Spirometry. Its advantage over the older series is that it is based on approximately 75,000 measurements performed on healthy males and females, ages 3–95 years of age in more than 70 counties worldwide. A second change in the new equations is the departure from the traditional “percent of the predicted normal” and the introduction of the z-scores as the means of presenting and correcting the values. The z-score is a statistical method that describes how far from the normal range a value is. The method is based on the fact that, 95 % of normally distributed values fall within ±2 z-scores. Although the GLI equations and the z-scores offer advantages especially for research purposes, they do not completely eliminate the drawbacks of the currently used series of predicted normal values especially considering that they are currently limited to spirometry and they are heavily derived from Caucasian populations. Furthermore, they are conceptually much less understood by patients and doctors alike. Thus, for the remaining of this chapter we refer to the traditional system of “percent predicted.”
Many clinicians (and even clinical researchers) in adult medicine often use a “cutoff” value to separate normal from abnormal values. Although this is a quick and easy way to define “normalcy” it is bound to overestimate or underestimate the lung function of many patients. Cutoff values are particularly unsuitable for pediatric patients because the definition of “normal” varies significantly among the various age groups (for example a ratio of FEV1/FVC of 85 % would be completely normal for an older teenager but very abnormal for a 6 year-old).
The Acceptability of the Tests
Because pulmonary function tests require from the patient a certain level of cooperation and effort, it is important for those who interpret the test to know that it represents the patient’s maximal effort. For this, one has to rely to a large extend on the observation of the respiratory technician who is performing the test. Certain criteria for the acceptability of a test were developed for adult patients but they are not applicable to children. More recent criteria are more suitable but still not optimal for children (Table 7.2). As a study in young children showed (Table 7.3) most of the young children have difficulty meeting the criterion of the back extrapolated volume of <0.05 (an indicator of how hard and fast a patient breathes out) and many of them fully exhale in less than 3 s. A second criterion of acceptability is the reproducibility of the test (at least three reproducible efforts for adults and older children and two for younger children). However, it is not unusual for younger children to master only one effort. It is our opinion, that in clinical practice reproducibility is desirable but not absolutely necessary and that even one technically acceptable effort could and should be accepted for interpretation (for a detailed discussion on the subject see references [9, 10]). After all, the concern about non-reproducible suboptimal efforts is that they can make the results look worse than they really are. However, there are no technically acceptable efforts that can make the results look better than they really are (erroneously high flows are measured only when the patient terminates the exhalation prematurely). This should be obvious in the visual inspection of the MEFVC and the numerical values should not be used. However, be discarded but one can still derive useful information (see previous section on the interpretation of the MEFVCs). It is obvious that stricter criteria may be necessary for research purposes in order to assure the uniformity and quality of the data.
What Test to Use?
The fact that there are many different available tests of lung function does not mean that they should all be used on every patient, all the time. Like other diagnostic tests, the selection of the appropriate pulmonary function should be based on the question that the test is intended to answer (Is it an obstructive or a restrictive lung disease? Is the disease getting better or worse? Is the patient responding to a specific treatment? etc.) Table 7.4 presents some guidelines for the initial evaluation and for the follow-up of patients with a variety of different conditions.
How Often Should a Patient be Tested?
Like any other test, PFTs are not meant to replace the history taking and the physical examination of the patient, but to complement them because they can reveal changes in lung function that are not easily detectable by the physical examination and often not felt by the patient either. This is particularly true for slowly developing lower airway obstruction that may remain unnoticed by patients and doctors alike because the patients adapt to these changes and learn to adjust their breathing. Figure 7.17 illustrates this point in a patient with known asthma during four “routine” visits to the clinic. In all instances, the patient stated that he was feeling “fine” and the physical examination was pretty unremarkable. However, not only his baseline pulmonary function was markedly different in each visit but his response to bronchodilator therapy varied significantly as well. As a general rule we perform at least basic spirometry during every clinic visit even if the patient does not report any particular problems and of course when changes in the therapeutic regimen are made as well as in the beginning and at the end of hospitalization. In our institution, patients with Cystic Fibrosis are being tested once or twice/week during hospitalizations and the continuation of the intravenous antibiotics depends to a large extend on the improvement of the PFTs.

Serial MEFVCs from the same patient at different time periods showing significant changes both in his baseline function as well as in his response to bronchodilators
Summary
Pulmonary function tests are noninvasive, easy to perform, relatively cheap, and usually accurate diagnostic tests of the lung function. The normalcy of a test should be based not only on the normalcy of the measured values but on the proportionality between them. Sudden changes in the PFTs of an individual that are not accompanied by relevant clinical changes should always raise the possibility of a “technical” error. The latter can be due to equipment malfunction or failure or more commonly due to the patients’ suboptimal effort, lack of cooperation, etc. and often due to the use of inappropriate predicted normal values.
Bibliography
ATS/ERS Task Force Standardisation of Lung Function Testing: General considerations for lung function testing. 2005. http://www.thoracic.org/statements/resources/pfet/PFT1.pdf.
ATS/ERS Task Force Standardisation of Lung Function Testing: Interpretative strategies for lung function tests. 2005. http://www.thoracic.org/statements/resources/pfet/pft5.pdf.
ATS/ERS Task Force Standardisation of Lung Function Testing: Standardization of the measurement of lung volumes. 2005. http://www.thoracic.org/statements/resources/pfet/pft3.pdf.
ATS/ERS Task Force Standardization of Lung Function Testing: Standardization of the single-breath determination of carbon monoxide uptake in the lung. 2005. http://www.thoracic.org/statements/resources/pfet/pft4.pdf.
ATS/ERS Task Force Standardization of Lung Function Testing: Standardization of spirometry. 2005. http://www.thoracic.org/statements/resources/pfet/PFT2.pdf.
Hankinson JL, Odencrantz JR, Fedan KB. Spirometric reference values from a sample of the general US population. Am J Respir Crit Care Med. 1999;159(1):179–87.
Cockcroft D, Davis B. Direct and indirect challenges in the clinical assessment of asthma. Ann Allergy Asthma Immunol. 2009;103(5):363–9.
Quanjer PH, Stanojevic S, Cole TJ, Baur X, Hall GL, Culver BH, Enright PL, Hankinson JL, Ip MS, Zheng J, et al. Multi-ethnic reference values for spirometry for the 3–95-yr age range: the global lung function 2012 equations. Eur Respir J. 2012;40(6):1324–43.
Seed L, Wilson D, Coates AL. Children should not be treated like little adults in the PFT lab. Respir Care. 2012;57(1):61–70.
Stocks J, Kirkby J, Lum S. How to avoid misinterpreting lung function tests in children: a few practical tips. Paediatr Respir Rev. 2014. pii: S1526-0542(14)00025-6.
Author information
Authors and Affiliations
Corresponding author
Editor information
Editors and Affiliations
Guidelines for the Interpretation of Commonly Used Pulmonary Function Tests in Clinical Practice
Guidelines for the Interpretation of Commonly Used Pulmonary Function Tests in Clinical Practice
Lung Volumes
Questions to be addressed: Is the TLC normal, increased, or decreased?
An increased TLC can be due to larger than average lungs (often seen in athletes), or due to nonspecific hyperinflation.
A decreased TLC is indicative of loss of lung volume.
-
Are the various subdivisions proportionate to TLC (in terms of their %predicted value and/or in terms of their ratio to TLC)?
Based on the answers given to the above questions the possible interpretations are the following:
-
Normal lung volumes: The TLC and all of its subdivisions are within the normal range and proportional to each other.
-
Restrictive lung defect: The TLC and all of its subdivisions are proportionately decreased.
-
Obstructive lung disease: The RV and FRC are increased relative to TLC (RV/TLC > 30 %; FRC/TLC > 60 %).
-
Mixed defect: The TLC is decreased but the RV/TLC and FRC/TLC are increased.
Additional Points
-
Because the TLC consists of the sum of VC and RV, when one of them increases the other one decreases (and vice versa). Thus, the SVC is disproportionately low relative to TLC when there is air-trapping (i.e., increased RV and RV/TLC). Conversely the SVC is disproportionately high relative to TLC when there is decreased RV (e.g., alveolar fibrosis as a result of chemotherapeutic agents).
-
Increased RV can be present without increase in FRC (fairly common in patients with chest wall deformities that prevent the complete emptying of the lungs).
Maximal Expiratory Flow–Volume Curves/Spirometry
Visual Inspection
-
Is the MEFVC technically acceptable (complete without artifacts)?
-
What is the “shape” of the MEFVC (concave, convex, or tall and narrow)?
-
Is the MIFVC a “mirror image” of the MEFVC?
Forced Vital Capacity (FVC)
Is the FVC within the normal range, increased, or decreased?
-
A decreased FVC can be due to a restrictive lung defect causing loss of lung volume or due to an obstructive lung disease causing air-trapping. A decreased FVC should be further investigated with the measurements of lung volumes.
Forced Expiratory Volume in First Second (FEV1)
-
A decreased FEV1 can be due to obstructive lung disease, due to a restrictive lung defect causing loss of lung volume or due to poor effort.
-
The ratio of FEV1/FVC is the major determinant of lower airway obstruction. However, a normal FEV1/FVC ration does not preclude the presence of small/peripheral airway obstruction.
Ratio FEV1/FVC
-
The ratio FEV1/FVC normal for age the normal values vary significantly according to the age of the patient; it is as high as 97 % for those less than 6 years of age and as low as the mid-80 % for older children.
-
A proportional decrease in FVC and FEV1 (FEV1/FVC > 90 %) in an older child is suggestive of loss of lung volume (restrictive lung defect).
-
A disproportionate decrease in FEV1 relative to FVC (FEV1/FVC < 80 %) is indicative of lower airway obstruction (LAO).
Maximal or Peak Expiratory Flow Rate (FEFmax or PEFR)
A decreased FEFmax can be due to:
-
Obstructive lung disease. In such case the FEV1 and the other expiratory flow rates indices should be equally or more affected;
-
A restrictive lung defect causing loss of lung volume. In such case the FVC, FEV1 and the other expiratory flow rates indices should be equally affected;
-
Poor effort. This should be suspected when the %predicted value of the FEV1 is much higher than the %predicted value of the FEFmax (e.g., FEFmax of 70 %predicted, FEV1 90 %predicted).
Forced expiratory flow (FEF) at 25–75 %, 25 %, 50 %, 75 % of FVC:
-
A disproportionate decrease in the FEFs in relation to FVC (e.g., FVC: 95 %predicted, FEFs: <60 %predicted) indicates lower airway obstruction.
-
A ratio of FEF25–75 (%predicted)/FVC (%predicted) < 0.8 is highly suggestive of lower airway obstruction.
-
A decrease in the FEFs that is proportionate to FVC (e.g., FVC 70 %predicted; FEF25–75: 68 %predicted) is suggestive of a restrictive defect.
-
An increase in the FEFs relative to FVC (e.g., FVC: 85 %predicted; FEF25–75: 110 %predicted) suggests increased elastic recoil of the lung. This is normal in infants and very young children (usually less than 6 years of age) but abnormal in older ones and suggestive of a restrictive lung disease.
Inspiratory Flow–Volume Curves
-
A flattened inspiratory curve suggests variable extrathoracic soft tissue obstruction if it is consistent. If it is intermittent it is usually due to vocal closure.
-
A ratio FEF50/FIF50 > 1.2 is also suggestive of variable extrathoracic obstruction.
-
Flattening of the inspiratory and expiratory flow–volume curves indicates fixed airway obstruction.
Diffusing Capacity
-
Is the DLCO normal or decreased?
-
Is the DLCO proportional to the lung volume (TLC or FVC)?
-
Is the DLCO/VA proportional or increased?
Rights and permissions
Copyright information
© 2015 Springer Science+Business Media New York
About this chapter
Cite this chapter
Koumbourlis, A.C. (2015). Interpretation of Pulmonary Function Tests in Clinical Practice. In: Davis, S., Eber, E., Koumbourlis, A. (eds) Diagnostic Tests in Pediatric Pulmonology. Respiratory Medicine. Humana Press, New York, NY. https://doi.org/10.1007/978-1-4939-1801-0_7
Download citation
DOI: https://doi.org/10.1007/978-1-4939-1801-0_7
Published:
Publisher Name: Humana Press, New York, NY
Print ISBN: 978-1-4939-1800-3
Online ISBN: 978-1-4939-1801-0
eBook Packages: MedicineMedicine (R0)