
Abstract
Echocardiography has become the most widely used imaging procedure in patients with cardiovascular disease. The basis of echocardiography relies on the transmission and reflection of ultrasound waves from a transducer and interaction with different tissue interfaces to generate a digital image. The images obtained include M-Mode, 2D, 3D and Doppler (CW: Continuous wave, PW: Pulse wave, Color and tissue Doppler) to define both normal and abnormal structures and pathologies. The uses include evaluation of the structures of the cardiac chamber walls, the systolic and diastolic performances of the ventricles, the structure and function of the native or prosthetic cardiac valves, evidence of pericardial effusion and constriction, the appearance of the proximal great vessels and inferior vena cava, and the presence of abnormal intracardiac shunting.
Access provided by CONRICYT-eBooks. Download chapter PDF
Keywords
Echocardiography has become the most widely used imaging procedure in patients with cardiovascular disease. The basis of echocardiography relies on the transmission and reflection of ultrasound waves from a transducer and interaction with different tissue interfaces to generate a digital image. The images obtained include M-Mode, 2D, 3D and Doppler (CW: continuous wave, PW: pulse wave, color and tissue Doppler) to define both normal and abnormal structures and pathologies. The uses include evaluation of the structures of the cardiac chamber walls, the systolic and diastolic performances of the ventricles, the structure and function of the native or prosthetic cardiac valves, evidence of pericardial effusion and constriction, the appearance of the proximal great vessels and inferior vena cava, and the presence of abnormal intracardiac shunting.
Indications
The American College of Cardiology (ACC) and American Heart Association (AHA) published guidelines for the clinical application of echocardiography in 1997 (with an update in 2003) for various cardiovascular conditions [1]. In 2011, the ACCF/ASE/AHA/ASNC/HFSA/HRS/SCAI/SCCM/SCCT/SCMR Appropriate Use Criteria for Echocardiography were published with the level of appropriateness to guide physicians [2]. These of indications are extensive and generally includes usefulness in the acute setting and in patients with cardiac signs and symptoms, patients with valvular heart disease, hypertension, heart failure and cardiomyopathies, cardiac masses and pericardial diseases, suspected cardiovascular sources of emboli, and aortic diseases (Table 1.1).
Contraindications
Transthoracic echocardiography has no contraindications, as the use of ultrasound has no adverse effects when used for cardiac imaging. However, ultrasound waves have the potential to cause thermal bioeffects depending on the intensity and length of exposure that are determined by the frequency, focus, power output, depth, perfusion, tissue density; these bioeffects are considered minimal.
Contrast agents, when used, include the following contraindications:
-
1.
Clinical instability with hypotension in such cases as acute myocardial infarction, worsening or clinically unstable heart failure, life threatening ventricular arrhythmias, respiratory failure, severe emphysema, pulmonary embolism;
-
2.
Right-left, bidirectional, or transient right-to-left cardiac shunts;
-
3.
Hypersensitivity to contrast agents.
For additional details about contrast agents, please see Chap. 3 (Contrast echocardiography)
Equipment
The necessary equipment for performing an echocardiographic exam includes the portable echocardiography unit, a suitable ultrasound transducer (typically 2–4 Mhz) and an experienced sonographer or physician. The ultrasound transducer uses a piezoelectric crystal (such as quartz or titanate ceramic) to generate and receive ultrasound waves. The received waves are converted to electrical signals and displayed on the echocardiographic machine. The equipment is portable and allows examination in multiple locations aside from the echocardiography laboratories.
Technique
The echocardiographic examination starts by connecting the ECG electrodes and positioning the patient comfortably in the left lateral decubitus position to obtain optimal images (Obtaining images in supine position are possible if patients are unable to lie on their side). The ultrasound transducer is applied (using a water soluble gel) to the parasternal, apical, subcostal and in some cases suprasternal notch to obtain the usual images of an echocardiographic protocol. Parasternal long axis (PLAX), parasternal short axis (PSAX), apical 4 (A4C), 2 (A2C), and 3-chamber (A3C or long axis), subcostal, and suprasternal notch images are obtained. Doppler echocardiography (color flow, continuous and pulsed wave) is used to determine regurgitant and stenotic flow across valves and measure the velocity, pressure gradients, and volumetric flow. Tissue Doppler (mitral annulus) is used in determining diastolic function.
-
1.
The parasternal long axis view (PLAX) (Fig. 1.1) with the transducer slightly left of the sternum is initiated with the 2D evaluation of a sagittal view of the left ventricle (LV) (long axis view). This view allows evaluation of the structure and systolic function of the LV including LV outflow tract, left atrium (LA), the structure and motion of the aortic valve (AV) right and non-coronary cusps, the proximal aortic size and wall characteristics, and a portion of the right ventricular outflow. The posterior pericardium can also be evaluated for thickening or presence of pericardial effusion and more posteriorly pleural effusion. The septum is visualized and information can be obtained on the presence of a ventricular septal defect (VSD).
Fig. 1.1 
Parasternal long axis (PLAX) views: (a) shows PLAX with the LA, LV, MV-mitral valve with anterior and posterior leaflets, AV-aortic valve with RCC-right coronary cusp and NCC-non-coronary cusp. The RV lies anteriorly and posteriorly the pericardium and descending aorta are seen. In the PLAX, the anteroseptal and inferolateral walls of the LV are evaluated for any wall motion abnormalities. Panel (b) shows an RV inflow view with the RV, RA, the TV-tricuspid valve as well as the ostia of the IVC-inferior vena cava and the CS-coronary sinus
-
2.
A parasternal right ventricular (RV) inflow (Fig. 1.1) view can be obtained by medial angulation of the transducer from the parasternal long axis position. This allows visualization of the tricuspid valve (TV), right atrium (RA), coronary sinus (CS), and RV inflow tract. Tricuspid regurgitation can be evaluated and using continuous flow (CW) Doppler, right ventricular systolic pressure (RSVP) can be calculated.
-
3.
Parasternal short axis view (PSAX) (Fig. 1.2) is orthogonal to the long axis view. It is obtained by rotating the transducer 90°. Cross sectional evaluation of the LV, mitral valve (MV), AV, and LA are obtained, as well as views of the interatrial septum, RA, TV, RV outflow tract, PV, proximal PA and main PA branches. Doppler studies allow assessment of aortic regurgitation, tricuspid regurgitation, PA velocity, and the presence of pulmonic stenosis or regurgitation. Shunts that can be assessed in this view include membranous and supracristal VSD, patent ductus arteriosus (PDA), atrial septal defects (ASD) and patent foramen ovale (PFO)
Fig. 1.2 
Parasternal short axis (PSAX) views: (a, b) At the aortic level in diastole (AV closed) and systole (AV open). Note the three cusps: RCC, LCC, and NCC (located at the IAS-interatrial septum). Also seen are the LA, RA, IAS with slight dropout, RV outflow, PV-pulmonary vein and MPA-main pulmonary artery. Panel (c) shows short axis of the LV at the mitral valve level showing the anterior and posterior leaflets. Panel (d) shows a short axis of the LV at the papillary muscle level with the AL-anterolateral and PM-posteromedial papillary muscles from [1]
-
4.
Apical four chamber (A4C) view (Fig. 1.3): The transducer is placed on the left side of the chest as far inferiorly and laterally as possible to obtain views of the four chambers, including the mitral and tricuspid valves. This view allows assessment of the LV apex, inferoseptal and anterolateral walls and the lateral RV wall. The view is useful for evaluation of global LV systolic performance and the presence of LV apical aneurysm and thrombus. Diastolic performance can be determined by Doppler assessment of mitral inflow, pulmonary vein, and mitral annular (tissue Doppler) motion. This is the best view for assessing the presence and degree of mitral and tricuspid stenosis and regurgitation and is useful for assessing the extent of pericardial effusion, and respirophasic characteristics of mitral and tricuspid characteristics that may include pericardial tamponade. RV and RA invagination or compression also suggesting tamponade can be seen in these views. Doppler interrogation for muscular VSD is best accomplished in this view. Saline intravenous injections for R-L shunts are best determined in this view.
Fig. 1.3 
Apical views. (a) Apical 4 chamber (A4C) view showing the LA, RA, RV, LV (anterolateral and inferoseptal walls), and the MV/TV. (b) Apical 5 chamber (A5C) with slight anterior angulation of the transducer, the aorta is opened and the aortic valve can be seen and interrogated with CW to evaluate for AS, and PW of the LVOT to measure the SV-stroke volume. (c) Apical 2 chamber (A2C) showing the LA, MV and LV (Anterior and inferior walls). (d) Long axis (A3C) showing the LA, LV, MV, and AV. Similar to the PLAX, the anteroseptal and inferolateral walls of the LV are seen from [5]
-
5.
Apical 2 chamber (A2C) view (Fig. 1.3): Rotation of the transducer 60° counterclockwise provides visualization of the LV, MV, and LA. This view allows evaluation of the LV inferior and anterior walls, further evaluation for mitral regurgitation, and may be the best view for demonstration of LV pseudoaneurysm, which usually involves the inferior wall.
-
6.
Apical 3 chamber (A3C) view (Fig. 1.3): Rotating the transducer 60° clockwise and tilting is slightly anteriorly allows visualization of the LV, MV, LA, LV outflow tract, AV and proximal aorta. It is the best view for Doppler interrogation for aortic stenosis, subaortic stenosis and aortic regurgitation.
-
7.
Subcostal view (Fig. 1.4): The transducer is placed in the epigastrium just below the subxiphoid process. It is the best view for evaluating RA and RV free wall motion, and presence of PFO or ASD. The inferior vena cava is best viewed in this location. The diameter of which is measured and used to estimate RA pressure. The abdominal aorta can be seen several centimeters below the diaphragm, which allows the evaluation of aneurysms or dissection at this level.
Fig. 1.4 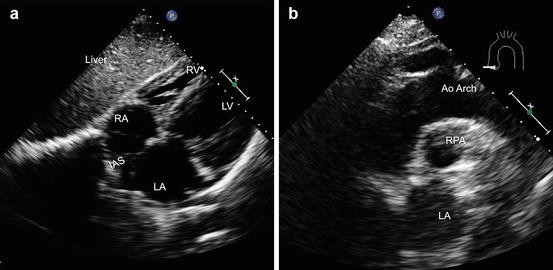
Subcostal and suprasternal TTE views: (a) A subcostal view with the four chambers LA, LV, RA, and RV are seen. This is the best view to evaluate for the presence of IAS-interatrial septal defects such as ASDs or PFOs using color flow Doppler. (b) Suprasternal notch view showing the aortic arch, RPA-right pulmonary artery and LA. This view is used to evaluate for the presence of aortic coarctation and diastolic flow reversal to determine the severity of aortic regurgitation
-
8.
Suprasternal view (Fig. 1.4): This view allows Doppler assessment of the ascending aortic velocities in aortic stenosis an can provide 2D imaging of the transverse and proximal descending thoracic aorta. Doppler assessment of the descending aorta in this view may be useful for the diagnosis of PDA and coarctation.


In general, standard images can be obtained in most patients with limitations in those with extremes of weight, with severe lung hyperinflation (i.e. severe COPD), or in patients in which access to the chest wall is precluded in setting of thoracic bone malformations, open-heart surgery or other thoracic surgeries. In difficult to image patients, ultrasound contrast agents are used to improve image quality.
Data Interpretation
Physicians with specialized training should perform data interpretation as established by competency guidelines from the ACC/AHA/ASE to generate a formal report. It is important to use a consistent systemic approach with special attention directed to the clinical question.
A systemic approach includes the following:
-
Left Ventricle: Chamber dimension, wall thickness, fractional shortening (FS), ejection fraction, regional wall motion abnormalities, stroke volume, diastolic characteristics and presence of VSD [3].
-
Right Ventricle: Chamber dimension, wall thickness and global function.
-
Left atrium: size, presence of masses or cor triatriatum.
-
Right atrium: Size, abnormal motion suggesting pericardial tamponade.
-
Proximal aorta: size, evidence of dissection and fibrocalcific changes.
-
Proximal PA: size, presence of PDA.
-
Valves: Stenosis, regurgitation, vegetations, calcification, prolapse, bicuspid and other AV abnormalities.
-
Congenital anomalies: PFO, ASD, VSD, cor triatriatum, Ebstein anomaly, transposition of ventricles and other congenital abnormalities.
-
Pericardium: Pericardial effusion, tamponade, constriction.
-
Hemodynamic: Hemodynamics play an important role in echocardiography and is helpful in evaluating the degree of right to left or left to right shunting, degree of mitral and aortic stenosis, regurgitant flow, PA systolic pressure.
Flows can be calculated using the formula Flow Rate = Area (πr2) × Vmax. πr2 represents the area across a circle assuming the left ventricular outflow tract (LVOT) is circular in shape. The volume is calculated as Volume = Area (πr2) × VTI (Velocity time integral: measured by tracing the CW or PW signal). The stroke volume (SV) can be calculated using multiple methods, with the use of the LVOT being the most accurate: SV = Area (LVOT) × VTI (PW LVOT). The SV can also be calculated by SV = EDV − ESV by tracing the LV in end diastole and end systole and using the biplane summation method to calculate volumes.
The pressure gradients across valves can be calculated using the Bernoulli equation Δp = 4 V2. Another method to evaluate aortic stenosis is by measuring the mean pressure gradient (PG) by tracing the CW AV signal or approximating it by calculating 2/3 or 0.7 of max PG. The aortic valve area (AVA) is calculated using Newton’s 2nd law of conservation of energy (Flow in = flow out), therefore, AVA × VTI = CSA (LVOT) × VTI (PW at LVOT). CSA of LVOT = πr2. R = radius of the LVOT, CSA = Cross sectional area, VTI = Velocity time integral. Lastly, a dimensionless index defined as DVI = VTI (LVOT) divided by VTI (AV) is used to estimate severity with a value less than 0.25 signifying severe. This method avoids the error of measuring the LVOT diameter because LVOT squared- results in squaring any error obtained.
Table 1.2 shows the classification of the severity of aortic stenosis.
Mitral stenosis can be evaluated with several methods including the determination of the mean pressure gradient by tracing the CW signal across the mitral valve or by calculating the mitral valve area (MVA) by planimetry using the parasternal short axis at the mitral valve level. Additionally, MVA may also be determined by pressure half time (PHT), which is defined as the time for the LA to LV pressure gradient to fall to half its peak. A deceleration time (DT) can be calculated from the slope and PHT = 0.29 × DT and MVA = 220/PHT (Table 1.3).
Quantification of valvular regurgitation can be achieved using volumetric methods or PISA. The volumetric methods, uses the principle of “What goes in, must come out”. Therefore, the regurgitant volume (RV) across the MV RV (MR) = SV (MV) – SV (LVOT) and RV (AI) = SV (LVOT) – SV (MR). The ERO (Effective regurgitant orifice) can be calculated by dividing the regurgitant volume (RV) by the VTI of the regurgitant valve (MR or AI). The regurgitant fraction is calculate by dividing the RV by the SV at the valve i.e., if MR then SV of MV and if AI then SV LVOT. Using the PISA method, by adjusting the aliasing velocity and creating a hemisphere of isovelocity, calculations can be made to quantify regurgitation with the ERO measuring lesion severity and RV measuring volume overload from the regurgitation. ERO = 2πr2 × Va (Aliasing velocity)/Vmax of MR, RV = ERO × MR VTI, and RF = RV/SV of mitral valve. Similar calculations are made for aortic regurgitation. Tables 1.4 and 1.5 demonstrate the ASE criteria for classification of mitral and aortic regurgitation.
The RVSP and PASP can be estimated. The right atrial pressure (RAP) is estimated using the size or diameter of the IVC. If the IVC diameter is <2.1 cm, the RAP is given a value of 3 mmHg. If the IVC diameter is >2.1 cm and collapses with a sniff or <2.1 cm and is non-collapsed, then a value of 8 mmHg is given. If the IVC is >2.1 cm and is non-collapsed, then a value of 15 mmHg is given. The RVSP can be calculated using the TR velocity by applying the Bernoulli equation with RVSP = 4 V2 (TR) + RAP. The pulmonary artery systolic pressure (PASP) is estimated to be equal to the RVSP unless pulmonary stenosis is present.
Finally, shunts such as ASD and VSD can be estimated using the Qp/Qs ratio. The formula to calculate the shunt is Qp/Qs = RVOT CSA × RVOT VTI/LVOT CSA × LVOT VTI.
The assessment of diastolic dysfunction is an integral part of a routine echocardiographic examination especially in heart failure patients [6]. Assessment of diastolic dysfunction usually includes measurement of mitral inflow and peak early filling (E-wave) and late diastolic filling (A-wave) velocities, E/A ratio, deceleration time (DT) of early filling velocity and the IVRT (isovolemic relaxation time). Pulmonary venous flow is performed with a PW Doppler at the right upper pulmonary vein. Measurements include peak systolic (S) velocity, peak antegrade diastolic (D) velocity, S/D ratio, and the peak A reversal in late diastole. The time difference between it and the mitral A wave duration (Ar-A) is used in assessing diastolic dysfunction. PW tissue Doppler of the septal and lateral mitral annulus is performed in the A4C. The early diastolic annular velocity e′ is integral in the assessment of diastolic function. Normal diastolic function is defined by a septal e′ >8 and lateral e′ >10. If the values are <8 and <10 respectively, multiple parameters are evaluated (E/A, DT, Ar-A, Valsalva ΔE/A) to determine the grade of diastolic dysfunction I, II, or III.
Complications
As mentioned, echocardiography is generally very safe with no complications. The key procedural complications are usually related to contrast administration or inaccuracy of data.
Clinical Vignettes
Case 1
Sixty-five-year-old male with history of hypertension, hyperlipidemia and heavy alcohol and tobacco use was admitted with 2 weeks of worsening dyspnea on exertion, orthopnea and cough with clear sputum production. His vitals include a blood pressure (BP) of 80/44, heart rate (HR) 126 and respiratory rate (RR) of 22. Physical exam is significant for distant heart sounds, few crackles and lower extremity edema. ECG is remarkable for low voltage and electrical alternans. 2D transthoracic images are shown in (Fig. 1.5).

Case #1. (a) Parasternal long axis; (b, c) Short axis, (d). Four chamber view (see text for details)
The TTE images clearly show a large circumferential pericardial effusion that is causing hemodynamic compromise and tamponade. Pericardial effusions are classified as small (less than 1 cm), moderate (1–2 cm), and large (>2 cm). In this case, the effusion is 3–4 cm with diastolic collapse or invagination of the right-sided chambers. The treatment of choice is emergent pericardiocentesis.
Case 2
Eighty-five year old male with hypertension, hyperlipidemia, prostate cancer s/p radiation and surgery presented with worsening clinical status over the last year with episodes of chest pain, dyspnea and an episode of syncope that prompt the admission. His Vitals are stable. Physical examination is notable for a grade 3/6 systolic murmur at the right upper sternal border with radiation to the carotids, S2 is diminished, lungs bibasilar crackles. ECG unremarkable. Transthoracic echocardiographic images are shown in (Fig. 1.6).

(a) Parasternal long axis (severe calcification of the aortic valve) (b) zoom on aortic valve (c) Parasternal short axis (d) Continuous wave Doppler through the aortic valve to measure the peak and mean aortic stenosis gradients. (e) Pulse wave Doppler at the LVOT to calculate the aortic stroke volume. (f) Continuous wave Doppler through the aortic valve to quantify the pressure half time of aortic regurgitation
The TTE images show severe calcifications of the aortic valve with a slit like opening during systole indicating the presence of severe aortic stenosis (As shown in the upper panels). The lower panels show a continuous wave through the aortic valve, a pulse wave at the LVOT level, and a CW of the aortic regurgitation Δp = 4(4 m/s)2 is 64 mmHg. The mean PG is calculated by tracing the CW across the aortic valve or 2/3 of the Peak PG. AVA is calculated at 0.9 cm2 indicative of severe AS per guidelines (AVA < 1 cm2) and in symptomatic patients should be referred for aortic valve replacement.
References
Cheitlin MD, et al. ACC/AHA guidelines for the clinical application of echocardiography: executive summary. A report of the American College of Cardiology/American Heart Association Task Force on practice guidelines (Committee on clinical application of echocardiography). Developed in collaboration with the American Society of Echocardiography. J Am Coll Cardiol. 1997;29(4):862–79.
American College of Cardiology Foundation Appropriate Use Criteria Task, F, et al. ACCF/ASE/AHA/ASNC/HFSA/HRS/SCAI/SCCM/SCCT/SCMR 2011 appropriate use criteria for echocardiography. A report of the American College of Cardiology Foundation Appropriate Use Criteria Task Force, American Society of Echocardiography, American Heart Association, American Society of Nuclear Cardiology, Heart Failure Society of America, Heart Rhythm Society, Society for Cardiovascular Angiography and Interventions, Society of Critical Care Medicine, Society of Cardiovascular Computed Tomography, and Society for Cardiovascular Magnetic Resonance Endorsed by the American College of Chest Physicians. J Am Coll Cardiol. 2011;57(9):1126–66.
Lang RM, et al. Recommendations for cardiac chamber quantification by echocardiography in adults: an update from the American Society of Echocardiography and the European Association of Cardiovascular Imaging. J Am Soc Echocardiogr. 2015;28(1):1–39 e14.
Baumgartner H, et al. Echocardiographic assessment of valve stenosis: EAE/ASE recommendations for clinical practice. J Am Soc Echocardiogr. 2009;22(1):1–23; quiz 101–2.
Zoghbi WA, et al. Recommendations for evaluation of the severity of native valvular regurgitation with two-dimensional and Doppler echocardiography. J Am Soc Echocardiogr. 2003;16(7):777–802.
Nagueh SF, et al. Recommendations for the evaluation of left ventricular diastolic function by echocardiography. J Am Soc Echocardiogr. 2009;22(2):107–33.
Author information
Authors and Affiliations
Corresponding author
Editor information
Editors and Affiliations
Rights and permissions
Copyright information
© 2017 Springer-Verlag London
About this chapter
Cite this chapter
Karnabi, E. (2017). Transthoracic Echocardiography. In: Hendel, R., Kimmelstiel, C. (eds) Cardiology Procedures. Springer, London. https://doi.org/10.1007/978-1-4471-7290-1_1
Download citation
DOI: https://doi.org/10.1007/978-1-4471-7290-1_1
Published:
Publisher Name: Springer, London
Print ISBN: 978-1-4471-7288-8
Online ISBN: 978-1-4471-7290-1
eBook Packages: MedicineMedicine (R0)