
Abstract
To evaluate the intracellular force transmission between the nucleus and cytoskeleton, we optimized a single cell-based assay that involves the manipulation of living, adherent cells with a fine glass microneedle and a microscope-mounted micromanipulator. The user inserts the microneedle into the cytoplasm and then, using a custom-programmable computer script, pulls the needle laterally toward the cell periphery. Normalized cross-correlation is applied to recorded time-lapse image sequences to determine average displacements within predefined regions of the nucleus and the cytoskeleton. These regional displacements, together with calculations of nuclear elongation, nuclear centroid translocation, and nuclear shape changes, enable quantitative assessments of nucleo-cytoskeletal coupling in both normal and disease conditions and provide an improved understanding of the role of specific nuclear envelope proteins in intracellular force propagation.
Access provided by CONRICYT – Journals CONACYT. Download protocol PDF
Key words
- Force transmission
- Mechanotransduction
- LINC complex
- Cell signaling
- Cell mechanics
- Nesprin
- SUN proteins
- Lamins
1 Introduction
Connecting the nucleus to the cytoskeleton is important for a number of cellular processes, such as nuclear positioning, cell migration, cellular differentiation, chromosome movements, and mechanotransduction signaling [1]. However, the specific molecular connectors that maintain nuclear shape and position under various mechanical stimuli are just beginning to emerge. One important component is the linker of nucleoskeleton and cytoskeleton (LINC) complex, comprised of SUN and nesprin proteins, which span the inner and outer nuclear membrane s, respectively. In 2006, Crisp and colleagues first identified the LINC complex and characterized the consequences of LINC complex disruption [2]. This foundational work has led to the recent discovery of various human pathologies related to mutations in LINC complex proteins, including Emery-Dreifuss muscular dystrophy, dilated cardiomyopathy, and various types of cancer, prompting a search for additional LINC complex components and regulators [3–5]. Despite these efforts, the precise mechanisms underlying these diseases are still not well understood. This may be due in part to the limited arsenal of tools to study intracellular force coupling within living cells.
The microharpoon assay—a technique which harpoons the cytoskeleton of single adherent living cells with a glass microneedle and exerts a pulling force on the cytoskeleton and nucleus while monitoring the induced nuclear displacement and deformation—is well equipped to study the force-transmitting properties of nuclear envelope proteins. The first applications of this technique in the late 1990s demonstrated that the cell is mechanically interconnected, with forces being transmitted from the cytoskeleton to the nucleus, where they can induce large deformation [6]. In the same seminal study, Maniotis et al. also used a glass micropipette and a micromanipulator to pull on extracellular matrix (ECM )-coated microbeads attached to the cell surface. However, shortcomings of the technique included endocytosis of the microbeads and difficulty in getting a single microbead per cell positioned at the appropriate distance from the nucleus.
Other techniques to probe nuclear envelope mechanics exist, each with their own merits and limitations. Force spectroscopy with optical tweezers offers great precision, but struggles to generate forces required to substantially affect the nucleus. A recent study found that forces of several nanonewtons are necessary to induce nuclear deformation and translocation , much larger than the forces generated by individual kinesin and dynein motor forces (≈2–7 pN), which collectively drive nuclear positioning [7, 8], and larger than the forces obtained with optical tweezers (typically up to 100 nN). It should be noted that force propagation in some cells (e.g., beating cardiac myocytes and migrating cells) is sufficient to cause visible deformation of the cell nucleus, rendering nanonewton force magnitudes generated by the microharpoon biologically relevant. Other, magnetic bead-based approaches can generate larger pulling or twisting forces, but in these assays it is difficult to control the number and localization of the paramagnetic beads [9, 10]. The use of isolated nuclei enables direct probing of the nucleus [11], yet it may conceal important cytoskeletal effects, and the isolation procedure may cause damage to the nuclear exterior and/or affect chromatin organization based on the exact buffer conditions [12, 13]. A recent technique combines microneedle manipulation with micropipette aspiration to “directly” apply a mechanical load on the nuclear surface of intact cells. Rapid nuclear relaxation dynamics are then monitored upon release of the nucleus from the pipette [7].
The microharpoon assay described herein advances the approach pioneered by Maniotis and colleagues [6] and subsequently refined by our group [14, 15] and addresses major technical difficulties—such as the risk of permanently damaging the cell membrane during the pull—by minimizing vibrations and abrogating the need for potentially cytotoxic dyes to track cytoskeletal movements. The use of computer automation allows for precise control of the micromanipulator , making the pull of the needle more consistent and reproducible. Lastly, sophisticated image processing helps to extract maximal information from the time-lapse image sequences. Future applications may help to identify new protein–protein interactions at the nuclear envelope, uncover potential functional overlap and redundancies among nuclear envelope proteins (e.g., nesprin -1, nesprin-2, and nesprin-3), and characterize the effects of disease-causing mutations in nuclear envelope proteins on intracellular force transmission.
2 Materials
2.1 Image Acquisition and Analysis
-
1.
Inverted epifluorescence microscope (see Note 1 and Fig. 1 ).
Fig. 1 
Micromanipulator microscope setup. An inverted fluorescence microscope equipped with a long working distance condenser to accommodate the motorized micromanipulation module unit, e.g., InjectMan NI 2 (Eppendorf). The glass microneedle is held within a micropipette holder that inserts the microneedle into the cell culture dish axially at 45°. The micromanipulator controller and its connection to the computer are not visible in this image
-
2.
40× air objective with phase contrast (see Note 1 ).
-
3.
Lower magnification (5× and/or 10×) long working distance objective(s).
-
4.
Microscope-mounted digital camera: CCD or CMOS.
-
5.
Image acquisition software: e.g., MATLAB (see Note 2 ).

2.2 Micro-manipulation
-
1.
Motorized microscope-mounted micromanipulator with micropipette holder: e.g., InjectMan NI 2 (Eppendorf).
-
2.
Borosilicate glass tubing: OD: 1.0 mm, ID: 0.78 mm; 10 cm length (Sutter).
-
3.
Micropipette puller: e.g., P-97 Model (Sutter).
2.3 Cell Culture and Labeling Reagents
-
1.
Cell permeable DNA stain, such as Hoechst 33342 (Invitrogen) (see Note 3 ).
-
2.
Dulbecco’s modified Eagle medium (DMEM).
-
3.
Phenol red-free DMEM with 25 mM HEPES.
-
4.
Fetal bovine serum (FBS) (Aleken Biologicals).
-
5.
Penicillin/Streptomycin (P/S) (Life Technologies).
-
6.
Dulbecco’s Phosphate Buffered Saline (PBS).
-
7.
35 mm glass bottom culture dish es (FluoroDish, World Precision Instruments, Inc.).
-
8.
Fibronectin (EMD Millipore) (see Note 4 ).
3 Methods
The protocol has been developed for studying mouse embryonic fibroblasts (MEFs); however, it is easily adaptable for many other adherent cell types. The protocol has been used effectively on a variety of mouse and human cell types (e.g., human fibroblasts, NIH 3T3, MDA-MB-231, etc.), including wild-type cells and cells lacking specific nuclear envelope proteins.
3.1 Cell Culture Preparation
-
1.
Prepare 35 mm glass bottom cell culture dish es for cell seeding. For many cell lines, it is sufficient to use cell culture-treated glass. Otherwise, incubate the dish with a low concentration of fibronectin (0.5 μg/mL) in Phosphate Buffered Saline (PBS) or other suitable cell-adhesion protein for 2 h at 37 °C (see Note 4 ). Wash dishes 2× with PBS.
-
2.
Detach cells with 0.05 % trypsin. Seed 2 mL of cell suspension in growth medium (DMEM w/o sodium pyruvate, 10 % FBS, 1 % P/S) in 35 mm glass bottom cell culture dish to achieve a subconfluent density of ≈70 % (see Note 5 ). The number of cells should be optimized for the specific cell type used (e.g., for MEFs, the density will be approximately 80,000 cells/mL).
-
3.
Incubate cells at 37 °C (5 % CO2) for a minimum of 3 h to allow spreading (see Note 6 ). Immediately before the microharpooning procedure, add Hoechst 33342 nuclear dye (1 μg/mL final concentration) to the growth medium and incubate cells for 10 min in a 37 °C incubator.
-
4.
Wash the cells 1× in PBS or growth medium for 30 s at room temperature to remove the residual Hoechst and then add phenol red-free growth medium (DMEM w/o sodium pyruvate and with 25 mM HEPES, 10 % FBS, 1 % P/S) to the cells for imaging.
3.2 Microscope Set-Up, Microharpooning , and Image Acquisition
-
1.
Set up the inverted epifluorescence microscope for phase contrast and fluorescence (Hoechst/DAPI filter cube) imaging and initiate the image acquisition software.
-
2.
Pull the borosilicate glass tubing with a micropipette puller to generate fine microneedles with tip diameters of ≈1 μm (see Note 7 and Fig. 2 ). This can be done in advance or immediately preceding the experiment.
Fig. 2 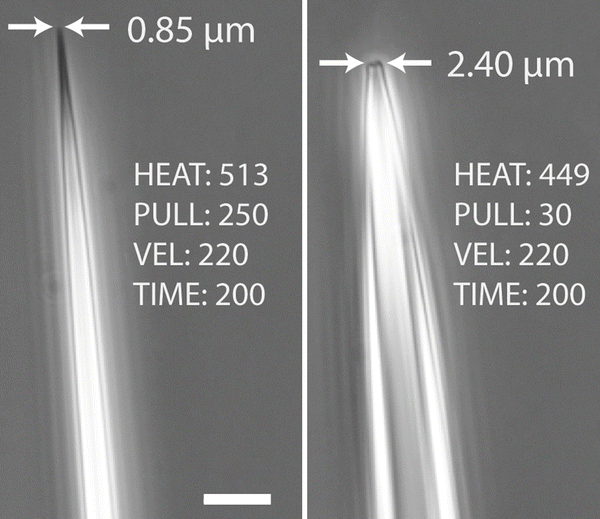
Microneedle tip dimensions and pull parameters. A Sutter P-97 micropipette puller was used to create microharpoons from borosilicate glass rods. A tip diameter of ≈1 μm (left) or smaller is well suited for the microharpoon assay. Different tip diameters and taper lengths result from changing the pull parameters (right, lower HEAT and PULL). Note that a wider tip (right) is less ideal for the microharpoon assay as it could damage the cell membrane. Scale bar: 10 μm
-
3.
Load the needle into the needle holder and fasten into the module unit at a 45° angle (see Fig. 1 ). Start by positioning the needle above the liquid level of the dish (see Note 8 ). Slowly lower the needle down toward the cells (−z direction) using the micromanipulator controls, until the cells are in focus and the needle is visible at the desired magnification (see Notes 9 – 11 ). For the subsequent experiments, the needle is typically maintained in a central position within the field of view; cells are selected by moving the microscope stage. Adjustments are then made by moving the needle.
-
4.
Select a well-spread, isolated, and healthy-looking cell (see Note 12 ) and acquire 1–2 sets of images prior to needle insertion, each set consisting of one phase contrast image and one image of the fluorescent Hoechst DNA stain. Use the same reflector/filter-cube for both contrast and fluorescence image acquisition to avoid vibrations caused by rotating the filter block turret (see Note 13 ).
-
5.
Using a micromanipulator , carefully insert the microneedle into the cytoplasm of a cell at fixed distance (5 μm) away from the nuclear periphery. Insert the needle axially to minimize membrane damage. Use a piece of reference tape on the screen to mark out the distance between the edge of the nucleus and needle insertion site (see Note 14 ). Once the needle locally indents the plasma membrane, which is visible in phase contrast mode, insert the needle up to an additional ≈2 μm into the cytoplasm and then halt the needle. The needle should be deep enough so that it “catches” cytoskeletal structures and will not simply slide over the surface or detach from the membrane during the pull, but not too deep, causing unwanted premature deformations in the regions of interest prior to executing the pull. Inserting the needle too deep may also damage the cell (see Note 13 ) and potentially cause collision between the needle and glass-bottom dish.
-
6.
Initiate the microneedle manipulation sequence to move the microneedle away from the nucleus towards the cell periphery at a user-specified speed and distance (see Note 15 ). This is done with a computer connected to the micromanipulator (e.g., using a USB-interface in combination with a custom-written MATLAB script available from the Lammerding laboratory upon request) or by using a programmable micromanipulator. Simultaneously, collect time-lapse images (brightfield and fluorescence) throughout the pull (see Note 16 , Movie 1 and Fig. 3 ) and after the needle has reached its final position. Collect images at fixed time intervals every 2–5 s.
Fig. 3 
Representative time-lapse image sequence showing nuclear deformation during manipulation with the microharpoon. The frames are taken approximately 4 s apart and follow the 10 μm translocation of the microharpoon. Scale bar: 10 μm. The corresponding movie is available in the Supplemental materials (see Movie 1)
-
7.
Using the computer or the micromanipulator control panel to control the micromanipulator, remove the needle by rapidly retracting it away from the cell in the axial direction (20 μm/s works well).
-
8.
Acquire 1–2 final sets of images following removal of the microneedle from the cytoskeleton to check for cell damage and viability (see Note 17 ).


3.3 Image Processing and Analysis
The following steps should be tailored to the specific needs of the user. While we chose a MATLAB -based approach, alternative approaches for image processing and analysis exist, many of which are publically available (see Note 2 ). Custom-written MATLAB scripts are available from the Lammerding laboratory upon request.
-
1.
Using custom analysis software, generate displacement maps by tracking phase contrast features in the cytoplasm and fluorescently labelled features in the nucleus (see Movie 2 and Fig. 4 ). One approach divides the image into a grid of regularly spaced small image regions (≈2 × 2 μm2) and applies a normalized cross-correlation algorithm to each small image region in subsequent image frames (see Note 18 ). This approach enables the tracking of each region-center from frame-to-frame, which is then used to calculate the displacement of each image region. The collection of displacement vectors forms a displacement map of the cell for each time-point, from which average displacements within regions of interest can be computed.
Fig. 4 
Representative time-lapse image sequence illustrating the computed cytoskeletal strain map during micromanipulation. As the microharpoon pulls on the cytoskeleton , forces and deformations (indicated by the growing displacement vectors) are transmitted throughout the cell. The displacement vectors are drawn 2× their actual size. Similar displacement maps are computed for nuclear displacements. Scale bar: 10 μm. The corresponding movie is available in the Supplemental materials (see Movie 2)
-
2.
In order to quantify nucleo-cytoskeletal coupling , compute induced intracellular displacements within four discrete, 2 μm × 2 μm regions: (a) near the microneedle manipulation site (cyto near); (b) an area inside the nucleus near the microneedle insertion site (nuc near); (c) an area on the opposite side of the nucleus (nuc far); and (d) the cytoskeleton on the other side of the nucleus (cyto far) (see Note 19 and Fig. 5a). Compare displacement differences between a “pre-pull” frame, showing the harpooned cell immediately prior to pull initiation, and a “post-pull” frame of the cell just before harpoon removal.
Fig. 5 
Schematic overview of microharpoon assay and sample results comparing wild-type cells with those possessing a nucleo-cytoskeletal coupling defect. (a) Wild-type cell before and after the microharpoon pull. The four discrete regions used to evaluate nucleo-cytoskeletal coupling are shown in the colored boxes: “cyto near” in purple, “nuc near” in green, “nuc far” in orange, and “cyto far” in red. (b) Expected results for a cell with a force transmission defect. Note the decrease in nuclear strain along the axis of force application, calculated by dividing the nuclear elongation (ΔL = L − L 0) by the initial length, L 0 , where L is the final length of the nucleus (in the microneedle pull direction) at the end of strain application. Also note the decrease in nuclear centroid displacement. (c) Hypothetical plot of expected results comparing the cells in (a) and (b). The “nuc near” and “nuc far” regions typically provide the most relevant information about nucleo-cytoskeletal coupling, whereas the “cyto far” region is often influenced by high noise. Displacements in the “cyto near” region should show comparable results for both cell types, as these measurements reflect the applied cytoskeletal strain
-
3.
To analyze the nuclear shape and deformation, apply thresholding and smoothing to the fluorescence image of the nucleus. From this binary image, nuclear area and shape changes can be tracked over time. Fitting an ellipsoid to the binary image can be used to extract additional parameters such as effective major and minor radius, eccentricity, etc. Nuclear strain along the axis of force application is calculated by dividing the nuclear elongation (ΔL = L − L 0) by the initial length, L 0, where L is the final length of the nucleus (in the microneedle pull direction) at the end of the strain application. Nuclear centroid movements can also be quantified (see Note 20 ).
-
4.
Interpret results. Figure 5c schematically illustrates how to identify nucleo-cytoskeletal coupling defects based on the plot of nuclear and cytoskeletal displacements. Figure 5a, b show expected results for wild-type cells and cells with a force transmission defect, respectively (see Note 19 ).


3.4 Optional Experimental Variations
-
1.
Selectively disrupting the various cytoskeletal systems (e.g., using nocodazole for microtubules, cytochalasin D for actin, etc.) may help better define the mechanism of force transmission for a given protein of interest (e.g., novel LINC complex candidates).
-
2.
In the future, combining the microharpoon assay with 3-D confocal microscopy may provide a more detailed view of cellular force transmission and may reveal additional phenomena (e.g., 3-D nuclear shape changes, differences between apical and basal protein distribution, and response to force).
4 Notes
-
1.
The experimental procedure requires a fluorescence microscope equipped with a long working distance condenser to accommodate the micromanipulation unit (see Fig. 1 ), a filter block for Hoechst, and a high-magnification air objective (e.g., Zeiss EC Plan-Neofluar 40×/0.75 Ph2 M27 with 1.6× Tubelens Optovar).
-
2.
Other programming platforms may be used for the analysis. For MATLAB , the Mathworks online FileExchange has some well-documented and helpful digital image correlation (DIC) programs, such as the following: http://www.mathworks.com/matlabcentral/fileexchange/43073-improved-digital-image-correlation--dic.
-
3.
Alternatives to Hoechst 33342 may be used to stain the nucleus, such as the dye SYTO 59. This minor-groove binding molecule has been shown to work well for live-cell imaging with limited cytotoxicity. Dyes with longer excitation wavelengths are advantageous as this will minimize potential phototoxicity . While we and others have successfully used fluorescently labeled histones (e.g., GFP -histone H2B) to visualize nuclear deformations, a recent study found that expression of GFP-histone H1.1 altered nuclear mechanics [7].
-
4.
The concentration and type of ECM protein can substantially affect cell morphology, spreading, and cytoskeletal organization, which is likely to influence intracellular force transmission. Therefore, it is crucial that the cells are not allowed to spread too thin, which increases the risk of inserting the needle through the cells and/or ripping the cytoskeleton with the needle. This can be achieved by using only low concentrations of ECM molecules for coating the cell culture surface, or by micropatterning by microcontact printing . Incubation with cell adhesion protein can go longer than 2 h or overnight at 4 °C.
-
5.
It is important to minimize cell–cell contacts in order to reduce variability in the assay. We found that a cell confluency of 50–70 % provides a good balance between having a large number of cells to choose from and maintaining cells in a “happy” state while keeping the number of cell–cell contacts low. Substrate patterning approaches such as direct printing using deep UVs [16] or microcontact printing can help to achieve this.
-
6.
The incubation time required for sufficient cell spreading may vary depending on cell type. We have performed the microharpoon assay at various time-points (e.g., 3, 6, 24, or 48 h post seeding) and concluded that results at the 3, 6, and 24 h time-points are essentially identical. At 48 h, the cells display greater displacements in the “nuc far” and “cyto far” regions, potentially due to increased cytoskeletal tension. We therefore recommend performing the experiments between 3 and 24 h after seeding the cells.
-
7.
Using a P-97 micropipette puller (Sutter), we had success with the following pull parameters: HEAT: 513, PULL: 250, VEL: 220, TIME: 200. Please note that the exact settings will vary depending on the machine and its configuration. Generally, increasing the HEAT and PULL parameters results in a smaller microneedle diameter and a longer taper. We recommend experimenting with varying the parameters until a reproducible, long, and sharp needle shape can be produced (see Fig. 2 ).
-
8.
The starting position of the microneedle should be just above the level of medium. This will be helpful in the case where a cell or piece of debris sticks to the needle . Surface tension at the medium–air interface can be used to shear off the debris upon rapid removal of the needle in the + z direction.
-
9.
To position the needle at the experimental onset, start with a low magnification (e.g., 5× or 10×) long working distance objective and bring the needle into focus at the center of the viewing field. Lower the focal plane using the coarse adjustment knob of the microscope and slowly lower the needle into focus. Repeat this process until the cells appear in focus with the needle slightly above. As the needle is drawn closer to the cells, change the objective to the final magnification (40× or higher). The need to change objectives (e.g., in order to efficiently locate the microneedle) favors use of an air objective over an immersion objective.
-
10.
The same needle may be used for multiple cells and multiple dishes; however, it should be changed in the case of damage or debris stuck to the needle (see Note 7 ).
-
11.
Once the cells are in view at 40×, change the controls to “Fine” and “Axial” (for the Eppendorf InjectMan NI 2 micromanipulator ) to enable precise control over the microneedle movement in the axial direction.
-
12.
Try to select interphase cells that resemble a sunny-side-up egg , with the nucleus as close to the center as possible. Cells with nuclei close to the cell periphery often behave inconsistently in response to microneedle manipulation. For the analysis, it is also necessary to have a minimum of 5 μm of visible cytoplasm beyond the far side of the nucleus. Once again, substrate patterning approaches may help to increase throughput and reduce experimental variability.
-
13.
The formation of visible, expanding lacerations in the cell membrane and cytoskeleton caused by microneedle manipulation was a major challenge during optimization of the technique. Upon imaging the microneedle pull using a high-speed digital camera, we noticed the presence of vibrations induced by rotation of the high-speed filter turret. This issue could be prevented by acquiring all of the images using a single filter cube (for the Hoechst fluorescence signal). An alternative approach would be to use an external excitation filter wheel or LED illumination in combination with multi-band filter cube. We confirmed that cytoskeletal displacements calculated based on phase contrast images closely match results obtained in previous approaches that tracked GFP - or mCherry-actin and GFP-vimentin as fiducial markers of cytoskeletal displacements. Other reasons for cytoskeletal ripping may include excessive cell spreading, improper microneedle tip shape/size, or vibration of the microscope stage, for example, caused by the camera cooling fan or the lack of an anti-vibration platform.
-
14.
It is helpful to position a piece of tape on the computer screen displaying the live camera image in order to mark the targeted needle insertion site. The length of the tape should correspond to an actual length of 5 μm in the microscope sample, which can be easily determined by image calibration. In our settings, this corresponds to tape of about 10 mm length. During the experiments, the stage is moved so that the bottom edge of the nucleus aligns with the top end of the tape. The microharpoon is then inserted even with the bottom end of the tape.
-
15.
The micromanipulator can be interfaced with MATLAB through the computer USB terminal in order to achieve automated and highly reproducible needle translocations. For MEFs, moving the needle a total distance of 10 μm at 1 μm/s provides sufficient nuclear deformations that can be analyzed using our algorithm and compared between cell types. We found that human cells (e.g., human skin fibroblasts) are more rigid than mouse cells and require greater forces to achieve detectable nuclear deformations and displacements. This can be accomplished by moving the needle a further distance at a greater speed (e.g., 30 μm at 5 μm/s). Under some conditions, the cytoskeletal tension in the cell will resist the motion of the needle, causing a slight bend in the glass needle. Therefore, the tip of the needle does not always travel the full distance specified by the software.
-
16.
It is essential to have one set of images with the needle inserted prior to the start of the pull, and another set of images at the final position of the needle translocation . In order to calculate profiles of nuclear strain rate and nuclear centroid speed, one should acquire 3–5 frames during the pull, itself, taken at intervals of about 3 s. It can be advantageous to synchronize the micromanipulator and the image acquisition software so that the needle will always be at the same location for a given frame (assuming all other parameters are consistent). However, this step is not essential if the analysis is only based on the comparison between the initial and final frames of the image sequences.
-
17.
After the pull, check for nuclear retraction and major rips in the cytoplasm (see Note 13 ). Damaged cells must be excluded from the analysis. Additionally, a live/dead assay or membrane damage assay may be performed.
-
18.
Our cross-correlation windows are 2 μm × 2 μm corresponding to 20 × 20 pixels with a center-to-center distance of 0.5 μm or 5 pixels.
-
19.
The displacements in the “cyto near” site should all be very similar since the same microneedle displacement is applied to all cells. Comparing the “nuc far” and especially the “nuc near” displacements between modified (e.g., mutant or knockdown) and control cells gives the best indication of nucleo-cytoskeletal coupling . Reduced displacements compared to control cells suggest that forces are not transmitted very well across the nuclear envelope. Displacements in the “cyto far” region become more difficult to interpret as they are often quite small (on the order of 1–2 pixels), approaching the detection limit. For MEFs, our “cyto near” and “cyto far” regions are both 5 μm from the nuclear membrane. In our software, the user selects regions of interest and the program calculates displacements within 2 μm × 2 μm (20 pixel × 20 pixel) windows. This is repeated 3× using partially overlapping windows, and the results are averaged for each cell. Statistical analysis is then performed on about 15–30 cells for each condition, with data collected from at least three independent experiments.
-
20.
The analysis described here allows one to determine rates of nuclear deformation and translation. One may also consider examining the rate and extent of nuclear retraction following needle removal. These measurements reflect the relative magnitude of elastic versus viscous resistance in nuclear mechanics [7]. Other image processing approaches may be used to estimate the ratio of nuclear to cytoplasmic stiffness [6]. The microharpoon assay is best used in conjunction with other approaches such as membrane strain, micropipette aspiration, cell migration, and perfusion experiments [17] to help elucidate physical/mechanical consequences of certain mutations, etc.
References
Chang W, Worman HJ, Gundersen GG (2015) Accessorizing and anchoring the LINC complex for multifunctionality. J Cell Biol 208(1):11–22
Crisp M, Liu Q, Roux K, Rattner JB, Shanahan C, Burke B, Stahl PD, Hodzic D (2006) Coupling of the nucleus and cytoplasm: role of the LINC complex. J Cell Biol 172(1):41–53. doi:10.1083/jcb.200509124
Luxton GG, Starr DA (2014) KASHing up with the nucleus: novel functional roles of KASH proteins at the cytoplasmic surface of the nucleus. Curr Opin Cell Biol 28:69–75
Mejat A, Decostre V, Li J, Renou L, Kesari A, Hantai D, Stewart CL, Xiao X, Hoffman E, Bonne G, Misteli T (2009) Lamin A/C-mediated neuromuscular junction defects in Emery-Dreifuss muscular dystrophy. J Cell Biol 184(1):31–44. doi:10.1083/jcb.200811035
Méjat A (2010) LINC complexes in health and disease. Nucleus 1(1):40–52
Maniotis AJ, Chen CS, Ingber DE (1997) Demonstration of mechanical connections between integrins, cytoskeletal filaments, and nucleoplasm that stabilize nuclear structure. Proc Natl Acad Sci U S A 94(3):849–854
Neelam S, Chancellor TJ, Li Y, Nickerson JA, Roux KJ, Dickinson RB, Lele TP (2015) Direct force probe reveals the mechanics of nuclear homeostasis in the mammalian cell. Proc Natl Acad Sci U S A 112(18):5720–5725
Tanenbaum ME, Akhmanova A, Medema R (2011) Bi-directional transport of the nucleus by dynein and kinesin-1. Commun Integr Biol 4(1):21–25
Iyer KV, Pulford S, Mogilner A, Shivashankar G (2012) Mechanical activation of cells induces chromatin remodeling preceding MKL nuclear transport. Biophys J 103(7):1416–1428
Poh Y-C, Shevtsov SP, Chowdhury F, Wu DC, Na S, Dundr M, Wang N (2012) Dynamic force-induced direct dissociation of protein complexes in a nuclear body in living cells. Nat Commun 3:866
Guilluy C, Osborne LD, Van Landeghem L, Sharek L, Superfine R, Garcia-Mata R, Burridge K (2014) Isolated nuclei adapt to force and reveal a mechanotransduction pathway in the nucleus. Nat Cell Biol 16(4):376–381
Lammerding J, Dahl KN, Discher DE, Kamm RD (2007) Nuclear mechanics and methods. Methods Cell Biol 83:269–294. doi:10.1016/S0091-679X(07)83011-1
Dahl KN, Engler AJ, Pajerowski JD, Discher DE (2005) Power-law rheology of isolated nuclei with deformation mapping of nuclear substructures. Biophys J 89(4):2855–2864
Lombardi ML, Jaalouk DE, Shanahan CM, Burke B, Roux KJ, Lammerding J (2011) The interaction between nesprins and sun proteins at the nuclear envelope is critical for force transmission between the nucleus and cytoskeleton. J Biol Chem 286(30):26743–26753. doi:10.1074/jbc.M111.233700
Zwerger M, Jaalouk DE, Lombardi ML, Isermann P, Mauermann M, Dialynas G, Herrmann H, Wallrath LL, Lammerding J (2013) Myopathic lamin mutations impair nuclear stability in cells and tissue and disrupt nucleo-cytoskeletal coupling. Hum Mol Genet 22(12):2335–2349. doi:10.1093/hmg/ddt079
Azioune A, Carpi N, Tseng Q, Thery M, Piel M (2010) Protein micropatterns: a direct printing protocol using deep UVs. Methods Cell Biol 97:133–146
Isermann P, Davidson PM, Sliz JD, Lammerding J (2012) Assays to measure nuclear mechanics in interphase cells. Curr Protoc Cell Biol. Chapter 22:Unit 22.16. Doi: 10.1002/0471143030.cb2216s56
Acknowledgments
This work was supported by National Institutes of Health awards [R01 HL082792 and R01 NS59348]; a Department of Defense Breast Cancer Idea Award [BC102152]; a National Science Foundation CAREER award to J Lammerding [CBET-1254846]; and a Pilot Project Award by the Cornell Center on the Microenvironment & Metastasis through Award Number U54CA143876 from the National Cancer Institute, as well as a NSF graduate research fellowship to G Fedorchak [2014163403].
Author information
Authors and Affiliations
Corresponding author
Editor information
Editors and Affiliations
1 Electronic Supplementary Material
Below is the link to the electronic supplementary material.
Movie 1
Representative time-lapse sequence showing nuclear deformation during manipulation with the microharpoon. The movie is an overlay of phase contrast images of the cell and micropipette (gray) with the fluorescence signal of the labeled nucleus (blue). Individual frames were taken approximately 4 s apart and follow the 10 μm translocation of the microharpoon. The corresponding image sequence is depicted in Fig. 3 . (MOV 108 kb)
Movie 2
Representative time-lapse movie of the computed cytoskeletal displacement map during micromanipulation. The movie is an overlay of phase contrast images (gray) with the fluorescence signal of the labeled nucleus (bright white signal) and the results of the displacement map analysis (green arrows). Displacement arrows are omitted in areas with no displacement or insufficient image contrast. The displacement vectors are drawn 2× their actual size. As the microharpoon pulls on the cytoskeleton, forces and deformations (indicated by the growing displacement vectors) are transmitted throughout the cell. The corresponding image sequence is given in Fig. 4 . Similar displacement maps can be computed for nuclear displacements. (AVI 3447 kb)
Rights and permissions
Copyright information
© 2016 Springer Science+Business Media New York
About this protocol
Cite this protocol
Fedorchak, G., Lammerding, J. (2016). Cell Microharpooning to Study Nucleo-Cytoskeletal Coupling. In: Shackleton, S., Collas, P., Schirmer, E. (eds) The Nuclear Envelope. Methods in Molecular Biology, vol 1411. Humana Press, New York, NY. https://doi.org/10.1007/978-1-4939-3530-7_16
Download citation
DOI: https://doi.org/10.1007/978-1-4939-3530-7_16
Published:
Publisher Name: Humana Press, New York, NY
Print ISBN: 978-1-4939-3528-4
Online ISBN: 978-1-4939-3530-7
eBook Packages: Springer Protocols