
Abstract
The expansion of livestock farming is one of the main causes of deforestation in the Brazilian Amazon. Intensive land use for beef production can cause changes, affecting native fauna composition and species richness. Ants are important organism of soil biota in tropical forests, mainly for their ecological attributes and their remarkable abundance. We investigated the effects of habitat loss by livestock farming on the richness and composition of ground-dwelling ants in the Brazilian Amazon. Ants were captured in five areas of secondary forests and pastures using pitfall traps for 48 h. Our results showed that the ant richness did not differ between habitats (p = 0.89). However, the species composition was different, resulting in two segregated clusters: one formed by forest areas and one by those of pasture. An indicator species analysis underscored the occurrence of three species that can be considered typical of the secondary forest, while a subset of four species from pasture, which probably tolerate land-use disturbance by livestock farming. Our results suggest the importance of maintaining secondary forests for biodiversity conservation and that livestock farming directly affects the taxonomic composition of ant species in the Amazonian biome.
Introduction
Land use change is a major driver of biodiversity depletion, mainly because of its devastating effect on habitat availability and the consequent extinction of species (Sala et al. 2000; Pimm et al. 2014; Ceballos et al. 2017). These changes in natural landscapes are strongly linked to the replacement of mature forest areas for intensive agroforestry, agriculture, and livestock farming (Hansen et al. 2013; Vale et al. 2019). Between these impacts, the conversions of forest to livestock farming is one of the major causes of deforestation in the Brazilian Amazon, one of the most diversity areas of the planet (e.g., Barona et al. 2010).
The colonization of beef cattle has played an important role in Brazil’s economy (Walker et al. 2013; ABIEC 2019). Brazil is currently the largest producer and exporter of commercial livestock in the world (Meyer and Rodrigues 2014; ABIEC 2019). This brought negative implications to Amazon forest (Vale et al. 2019), because livestock farming tends to increase deforestation (Walker et al. 2013; Fearnside 2017). Between 2004 and 2019, the Brazilian Amazon was deforested at an average rate of 10,021 km2 per year (INPE 2020), and the majority forest area lost in the Brazilian Amazon eventually became pastures (Barona et al. 2010). Therefore, understanding the land-use change and its effects on biodiversity, especially in the Brazilian Amazon, is a critical starting point to make decisions about effective conservation strategies (Phillips et al. 2017).
Ants (Hymenoptera: Formicidae) are a taxonomic group with a long history as biological indicators (Alonso 2000; Andersen et al. 2002; Gerlach et al. 2013; Carvalho et al. 2020). This dominant group is present in most Neotropical and subtropical habitats of native forests up to pastures and farmlands (Carvalho et al. 2020). Overall, some ant species are highly resilient to habitat disturbance (Anjos et al. 2017; Andersen 2018), however few studies have shown the responses of Amazonian ant communities to human disturbances (see Vasconcelos et al. 2006, 2010), and across different land uses in the landscape (Solar et al. 2016). In response to habitat disturbances, the abundance of dominant species mediated by changes in vegetation structure can induce changes in richness and composition of ant assemblages (Solar et al. 2016) showing a direct—and negative impact—of deforestation on ant diversity (Yates and Andrew 2011; Kuate et al. 2015).
In this study, we directly studied the diversity of ground-dwelling ant species in secondary forests and neighboring pastures areas. These two landscape components are becoming common habitats in the Amazon (Barona et al. 2010; Fearnside 2017), specially for insects, e.g., ants. Ground-dwelling ants play crucial roles in the ecosystems such as natural processes (e.g. nutrient cycling, soil aeration) (Folgarait 1998) and forest regeneration (e.g. seed dispersal) (Gallegos et al. 2014; Anjos et al. 2020). In addition, this ant fauna is diversity and sensitivity to environmental changes (Ribas et al. 2012), which makes this group suitable to be used on studies that aim to compare diversity between habitats. For this reason, we evaluated the species richness and composition of ant communities occurring in secondary forests and in pastures of the Amazon. We hypothesized that the conversion of secondary forest to pasture: (i) impoverish the ant species diversity and (ii) promote changes in ant assemblage composition. In this way, specific ant species are expected to be defined for each kind of environment.
Materials and methods
Study site
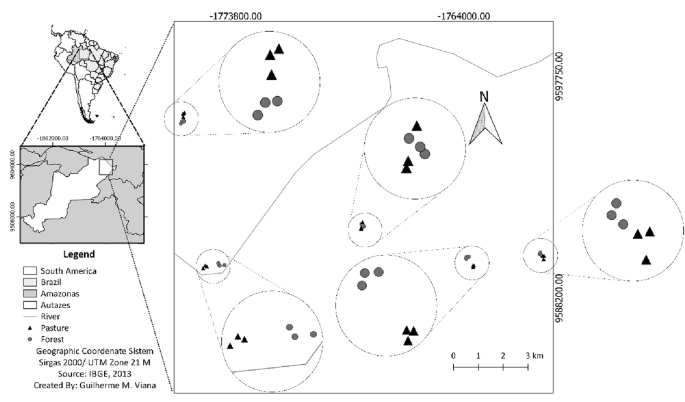
The fieldwork was carried out in the municipality of Autazes, 112 km from Manaus, Amazonas state, Brazil (Fig. 1). Autazes has an economic-based in buffalo and livestock farming, being among the ten largest producers of cattle of the state, and it also appears in the ranking of the 10 municipalities that more contributed to deforestation in 2008 and 2009 in the Amazonas state (Piontekowski et al. 2011). Between 2008 and 2019 the clearing rate at Autazes was 190.91 km2 and the municipality occupies the 111th position of accumulated deforestation increments in the Brazilian Legal Amazon (Assis et al. 2019; INPE 2020). According to Köppen’s classification, the climate is tropical humid with a mean annual temperature 26 °C and a mean annual precipitation of 2200 mm, which is distributed seasonally (Ribeiro 1976). Thus, the weather is similar to Manaus, where the precipitation varies seasonally, raining between November and May and the dry season is between June and October.
Map of the study area in Autazes, Amazonas, Brazil
The samplings were done between 6 and 21 September of 2013 in areas that had been flooded in the past (e.g., Galvão et al. 2011). We selected five areas for ant sampling for this study [Vista Alegre = VA; Soares (Comunidade) = SO; Soares (Seu Olavo) = OL; Soares (Tiririca) = TI; Juauri = JU] (Fig. 1; Appendix A01). The regional biome is Amazon rainforest. Secondary forests are characterized by a set of small forest fragments, poorly preserved, immersed in a highly fragmented landscape. These forests suffered from the loss of large trees, increased invasion of exotic species and the intensive hunting of wild animals (Chokkalingam and De Jong 2001). While pastures are characterized by open areas, where forests have been cleared and replaced by grasses to feed livestock, at least since the 1990s (Appendix A01).
Ant sampling
For each habitat, we selected three sites of native Amazon forest that have been replaced by pasture for livestock and three sites in adjacent secondary forests (total = 30 ground transects), distanced 200 m apart between pasture and forest transects (Fig. 1). In each site were placed 10 pitfall traps (Bestelmeyer et al. 2000) on the ground spaced to 20 m along a transect. Thus, a total of 150 traps were installed for the three sites of forests and for the three sites of pastures, in total 300 traps. The pitfall traps were composed of disposable plastic cups with 150 ml volume, 6.5 cm diameter and 7 cm in depth, filled with a solution of water with few drops of soap (to break the superficial tension of water) (Support information, Appendix A02). The pitfalls were exposed for 48 h. The ants collected were identified at the higher taxonomic level possible using of key from Baccaro et al. (2015) and by comparison with the reference collection of the “Laboratório de Mirmecologia, Centro de Pesquisas do Cacau” (CPDC collection, CEPEC/CEPLAC) where vouchers were deposited. The nomenclature follows AntWeb (2020).
Data analysis
First, we performed a Mantel test (Primer package) with a weighted Spearman rank correlation to address the effect of plot spatial location on levels of taxonomic similarity in PRIMER v6. Straight-line distances between plots were ln-transformed, as suggested by Condit et al. (2002). The Mantel test was carried out considering a group of 14 forest and 14 pasture areas, because two transects (one for forest and one for pasture) did not return any ant, so both were excluded both from the analysis. A Mantel test failed to uncover any spatial effects on the taxonomic similarity among plots (Rho = 0.063; p = 0.133).
Thus, in total, 14 forest plots and 14 pasture plots were analyzed. The occurrence of ant species per pitfall trap was used as a measure of the species' abundance. Differences in average species richness between the two habitat types were analyzed using t test using PAST (Hammer et al. 2001). To compare the overall ant species richness at habitat spatial scale we generated species-individual accumulation curves. Species accumulation curves permit comparing the diversity of ant assemblages at comparable levels of sampling effort. Species accumulation curves of the observed numbers of species (Sobs) were computed for the ant species in the two environments studied. Computing 95% confidence intervals (Colwell et al. 2004) allows for a statistical comparison of the species richness of the two datasets (Colwell et al. 2004). Species accumulation curves were computed with the analytical procedure in the EstimateS 9, using 500 randomizations and sampling without replacement (Colwell 2013).
To analyzed changes in the ant species composition we considered the patterns of beta diversity across the landscape. For this purpose, we calculated the average number of species present per site defined as β = γ – α, where γ is the number of species sampled in the entire landscape (gamma diversity) and α is the average number of species present at a given site (alpha diversity) (Veech et al. 2002) using EstimateS 9. This approach is used as a measure of additive partitioning of diversity and allows a direct comparison between alpha and beta diversities in terms of numbers (or percentage) of species.
Nonmetric Multidimensional Scaling (NMS) based on Sorensen’s distance were performed to whether there are community similarities between areas (Kruskal 1964; Mather 1976) using the PC-ORD software package (McCune and Mefford 1999). The data underwent the transformations and relativizations option in PC-ORD. NMS was constrained to two axes and the “slow-and-thorough” autopilot mode of NMS in PC-ORD used the best of 250 runs with a random starting configuration using the real data and 250 runs using randomized data for a Monte Carlo test of significance. Final stability was evaluated for each run by examining plots of stress (a measure of the dissimilarity between ordinations in the original p-dimensional space and the reduced dimensional space) versus the number of iterations. We overlaid regional categories on the final plot, and used joint plots, to examine how habitat types (forest and pastures) on to the ordination axes. The length and direction of a joint plot is based on the strength of the correlation between a variable and the ordination axes (McCune and Grace 2002). Variables with the strongest patterns of correlation with the ordination structure, based on Pearson R2 values > 0.20 with one or more of the axes. Finally, we performed an Indicator Value (IndVal) analysis (Dufrêne and Legendre 1997) performed for each species in relation to their distribution in both habitats in PC-ORD. We used randomizations to determine the statistical significance of IndVal (Monte Carlo test; p < 0.05), therefore, ant species with high specificity within a habitat type will have a high IndVal. The position of top indicator species was identified in rank abundance plots.
Results
A total of 46 ant species from 23 genera were recorded (Support information, Appendix A03). For secondary forest areas, 36 ant species from 20 genera were recorded, being 23 exclusives species. The richest genera were Pheidole (5 spp.), Solenopsis (4 spp.) and Ectatomma (4 spp.). Whereas in pasture, we recorded a total of 23 ant species from 13 genera, being 10 exclusive species. The richest genera were Pheidole (5 spp.), Solenopsis (3 spp.), and Camponotus (3 spp.). Forests and pastures shared 13 ant species (~ 28% of total species). Besides, the ant rarefaction curve in forest had 1.4-fold more species as compared to neighboring pastures (Fig. 2a). However, despite the apparent difference in absolute richness, the results showed that average species richness did not differ statistically between habitats (t = 0.13; df = 26; p = 0.89).

a Individual-based rarefaction curves for ground-dwelling ants in pasture and forest areas in the Amazon forest, north Brazil. Bars dotted indicate 95% confidence intervals. b Individual-based rarefaction curves for ground-dwelling ants in the Amazon forest, north Brazil. Showing an additive diversity form as β = γ – α
The gamma diversity can be expressed in an additive form as: 46 [γ] = 39.7[α] + 6.3[β] (Fig. 2b). Beta diversity contributed 13.9 and 13.5% of the total gamma diversity for forest areas and pasture areas, respectively. The NMS analyses based on species similarity resulted in two segregated clusters: one formed by forest, one by pasture (stress = 0.16). Joint plots indicated a correlation with the axis 2, suggesting that the habitat type was driving the separation taxonomic by region in the ordination (r = 0.66, p = 0.05, Fig. 3). Finally, an indicator species analysis underscored the occurrence of three species (Ectatomma lugens, Neoponera apicalis, and Pachycondyla crassinoda) that can be considered typical of forest areas, while a subset of four species (Camponotus blandus, C. melanoticus, Ectatomma brunneum, and Odontomachus haematodus) stands out from pasture areas (Table 1). The four indicator species with higher IndVal in pasture areas add 63% to all species distribution (Fig. 4a), indicating a dominance of species with high abundance. In contrast, the three indicator species in forest areas only add 34% to the whole distribution, indicating that the ant assemblages in this habitat have relatively a high richness of species with low abundance (Fig. 4b).

Nonmetric multidimensional (NMS) ordination of ground-dwelling ant community across pasture (white circles) and forest (black circles) areas based on the abundance data in the Amazon forest, North Brazil

Rank distribution by abundance of ground-dwelling ant species sampled using pitfall traps in a forest remnants (black circles) and b adjacent pastures (white circles) in the Amazon forest, north Brazil. The arrows show the identity and position of top indicator species within of species-rank curves (see Table 1)
Discussion
This study presented the effect of conversion from secondary forests to pastures on ground-dwelling ant communities in central Amazonia. Although the results have not shown a reduction in ant richness due to the land use change by livestock farming, our results showed that the taxonomic composition varies between habitat types. The substitution of native forest for pastures has been implemented in many regions of the Brazilian Amazon, with the aim of improving productivity of livestock (Vale et al. 2019). Changes in vegetation structure can directly influence the composition of the ant fauna, due to other variables, such as luminosity, temperature, humidity (Gibb et al. 2015), and aboveground biomass (Solar et al. 2016) that directly and indirectly affect the foraging, prey availability and nesting sites to the ant species. Similar results were also found by Vasconcelos (1999) that found a distinct ant species composition between pasture and mature forest.
The similarity of ant species richness between forest and pasture areas can be explained due to some forest areas can serve as sources of species for disturbed areas, corroborating the landscape species pool hypothesis (Tscharntke et al. 2012). We have to consider that a short distance between areas can facilitate these species flow. For instance, Frizzo and Vasconcelos (2013) shows that pasture areas in Brazil supports a diversity of species of growd-dwelling and arboreal ants similar to preserved areas of tropical savanna. Nevertheless, the ant species richness was low in both areas, although most studies have used pitfall traps associated with attractive baits (e.g., using sardine and honey), a different method of collection (see Vasconcelos 1999; Solar et al. 2016). This low overall ant richness can be useful to define the conservation status of secondary forest areas, in the Amazon or other ecosystems. On the other hand, we found a trend for forest areas to present higher species richness than disturbed ones, as well in other Amazonian forests (Vasconcelos 1999; Solar et al. 2016). For instance, Menezes and Schmidt (2020), in the southwestern Brazilian Amazon using five types of liquid food resources to sampling ants showed higher ant species richness in forest than in pasture areas. These authors, in total (considering both forest and pasture areas), found more than twice ant species compared with our results, but recorded almost a half of ant species in pastures areas. Overall, areas that have been used as pastures appear to be recovering more slowly than other disturbed areas (Vasconcelos 1999). Therefore, in addition to local environmental differences and the sampling methods used, these dichotomous responses confirm the limited value of species richness to access the effects of converting forest areas to pastures, while species composition may better fulfill this role (Barlow et al. 2007; Solar et al. 2016).
Ant community composition was different between secondary forests and pastures, which we can assume that 60% of the taxonomic composition was driven by the type of habitat. These results are consistent with previous studies in other areas of the Amazon forest (Vasconcelos 1999; Wilkie et al. 2009; Solar et al. 2016). Differences in species composition may reflect in the ecosystem services provided by them (Del Toro et al. 2012). For instance, two of three indicator species of secondary forests are specialist predators which are more sensitive to environmental disturbances (e.g., species of Pachycondyla, and Neoponera genera) (Leal et al. 2012; Brandão et al., 2015). Moreover, another indicator species, Ectatomma lugens, also is a specialist predator very abundant in pristine Amazon forests (Vasconcelos et al. 2000). As a result, areas of secondary forests, through specialist predator ants, can maintain more ecosystem services such as the top-down effects on control of small invertebrate populations and seed dispersal, for instance (Passos and Oliveira 2002; Leal et al. 2012). Therefore, even with low ant species richness and an intermediate level of degradation, secondary forest areas can provide important ecosystem services mediated by their ant community reinforcing the importance of these areas in the landscape.
In pasture areas, Camponotus species represented half of the indicator species. This genus consists of a high diversity of generalist ants common in open and disturbed habitats (Anjos et al. 2017; Alves-Silva et al. 2020). Despite the predatory habit, Ectatomma brunneum is also abundant in open fields or degraded areas (Gomes et al. 2009). An unexpected result was Odomomachus haematodus as an indicator species of pasture areas. Despite O. haematodus species belonging to a genus (Odontomachus) of predator species sometimes specialized (Brandão et al. 2015; Silva et al. 2015), this species seems to be very abundant in both forest and fragments of Amazonian forests. For instance, this species was one of the few commonly sampled in all 34 areas studied by Vasconcelos et al. (2006) in Amazon. Therefore, the occurrence of O. haematodus as an indicator species can be justified since the IndVal is strictly based on the relative abundance of the species (Dufrêne and Legendre 1997). Finally, beta diversity is reported to be low for ants in the Amazon (Vasconcelos and Vilhena 2006). Our study showed that the environment types share 63% of ant richness species. Previous studies also found low beta diversity and consequently a high percentage of shared species, being that 64% of ant species in less species-rich habitat (e.g., savanna) were also found in richer ones (e.g., forests) (Vasconcelos and Vilhena 2006), both habitats without anthropization, and 85% of the ant species found in fragments were also found in areas of continuous forest (Vasconcelos et al. 2006).
Conclusions
Overall, the results from our study support the alterations in ant diversity caused by livestock farming in the Amazon forest (Vasconcelos 1999; Solar et al. 2016). Despite the absence of changes in species richness, secondary forest areas and pastures showed a clear difference in assemblage composition. The next steps are to identify which factors explain the change in species composition between secondary forests and pastures.
References
ABIEC (2019) BeefReport Brazilian Livestock Profile. Brazilian Beef Exporters Association (ABIEC). http://www.brazilianbeef.org.br/download/sumarioingles2019.pdf
Alonso LE (2000) Ants as indicators of diversity. In: Agosti D, Majer JD, Alonso LE, Schultz TR (eds) Ants—standard methods for measuring and monitoring biodiversity. Smithsonian Institution Press, Washington, pp 80–88.
Alves-Silva E, Anjos D, Bächtold A, Lange D, Maruyama PK, Del-Claro K, Mody K (2020) To what extent is clearcutting vegetation detrimental to the interactions between ants and Bignoniaceae in a Brazilian savanna? J Insect Conserv 24:103–114. https://doi.org/10.1007/s10841-020-00216-4
Andersen AN (2018) Responses of ant communities to disturbance: five principles for understanding the disturbance dynamics of a globally dominant faunal group. J Anim Ecol 88:350–362. https://doi.org/10.1111/1365-2656.12907
Andersen AN, Hoffmann BD, Müller WJ, Griffiths AD (2002) Using ants as bioindicators in land management: Simplifying assessment of ant community responses. J Appl Ecol 39:8–17. https://doi.org/10.1046/j.1365-2664.2002.00704.x
Anjos D, Campos R, Campos R, Ribeiro S (2017) Monitoring effect of fire on ant assemblages in Brazilian Rupestrian grasslands: contrasting effects on ground and arboreal fauna. Insects 8:64. https://doi.org/10.3390/insects8030064
Anjos DV, Leal LC, Jordano P, Del-Claro K (2020) Ants as diaspore removers of non-myrmecochorous plants: a meta-analysis. Oikos 6:775–786. https://doi.org/10.1111/oik.06940
AntWeb (2020) Version 8.31. California Academy of Science. Accessed 18 May 2020. https://www.antweb.org
Assis LFFG, Ferreira KR, Vinhas L, Maurano L, Almeida C, Carvalho A, Rodrigues J, Maciel A, Camargo C (2019) TerraBrasilis: a spatial data analytics infrastructure for large-scale thematic mapping. ISPRS Int J Geo-Inform 8:513. https://doi.org/10.3390/ijgi8110513
Baccaro FB, Feitosa RM, Fernández F, Fernandes IO, Izzo TJ, Souza JLP, Solar RRC (2015) Guia para os gêneros de formigas do Brasil. Ed INPA, Manaus
Barlow J, Gardner TA, Araujo IS et al (2007) Quantifying the biodiversity value of tropical primary, secondary, and plantation forests. Proc Natl Acad Sci USA 104:18555–18560. https://doi.org/10.1073/pnas.0703333104
Barona E, Ramankutty N, Hyman G, Coomes OT (2010) The role of pasture and soybean in deforestation of the Brazilian Amazon. Environ Res Lett 5:024002. https://doi.org/10.1088/1748-9326/5/2/024002
Basset Y, Cizek L, Cuénoud P et al (2010) Arthropod distribution in a tropical rainforest: tackling a four dimensional puzzle. PLoS One 10:e0144110. https://doi.org/10.1371/journal.pone.0144110
Bestelmeyer BT, Agosti D, Alonso LE, Brandão CRF, Brown WL Jr, Delabie JHC, Silvestre R (2000) Field techniques for the study of ground-living ants: an overview, description, and evaluation. In: Agosti D, Majer JD, Alonso LT, Schultz T (eds) Ants: Standart methods for measuring and monitoring biodiversity. Smithsonian Institution, Washington, pp 122–144
Brandão CRF, Prado LP, Ulysséa MA, Probst RS, Alarcon V (2015) Grupos tróficos e guildas em formigas poneromorfas. In: Delabie JHC, Feitosa RM, Serrão JE, Mariano, CSF, Majer JD (Org) As formigas Poneromorfas do Brasil. Editus, Ilhéus, pp 163–179
Carvalho RL, Andersen AN, Anjos DV, Pacheco R, Chagas L, Vasconcelos HL (2020) Understanding what bioindicators are actually indicating: linking disturbance responses to ecological traits of dung beetles and ants. Ecol Indic 108:105764. https://doi.org/10.1016/j.ecolind.2019.105764
Ceballos G, Ehrlich PR, Dirzo R (2017) Biological annihilation via the ongoing sixth mass extinction signaled by vertebrate population losses and declines. Proc Natl Acad Sci USA 114:89–96. https://doi.org/10.1073/pnas.1704949114
Chokkalingam U, De Jong W (2001). Secondary forest: a working definition and typology. Int For Rev:19–26
Clarke KR, Gorley RN (2006) PRIMER v6: user manual/tutorial (plymouth routines in multivariate ecological research). PRIMER-E, Plymouth
Colwell RK (2013) ESTIMATES: Statistical estimation of species richness and shared species from samples, Version 9.1.0. Available at http://viceroy.colorado.edu/estimates/index.html
Colwell RK, Mao CX, Chang J (2004) Interpolating, extrapolating, and comparing incidence-based species accumulation curves. Ecology 85:2717–2727. https://doi.org/10.1890/03-0557
Condit R, Pitman N, Leigh EG, Chave J, Terborgh J, Foster RB, Núñez P, Aguilar S, Valencia R, Villa G, Muller-Landau HC, Losos E, Hubbell SP (2002) Beta-diversity in tropical forest trees. Science 295:666–669
Dufrêne M, Legendre P (1997) Species assemblages and indicator species: the need for a flexible asymmetrical approach. Ecol Monogr 67:345–366
Fearnside PM (2017) Deforestation of the Brazilian Amazon. In: Shugart H (ed) Oxford research encyclopedia of environmental science. Oxford University Press, New York, pp 1–53
Folgarait P (1998) Ant biodiversity and its relationship to ecosystem functioning: a review. Biodivers Conserv 7:1221–1244. https://doi.org/10.1023/A:1008891901953
Gallegos SC, Hensen I, Schleuning M (2014) Secondary dispersal by ants promotes forest regeneration after deforestation. J Ecol 3:659–666. https://doi.org/10.1111/1365-2745.12226
Galvão AKL, Silva JF, Albertino SMF, Monteiro GFP, Cavalcante DP (2011) Phytosociological assessment of pastures under flooded low land conditions in the state of Amazon, Brazil. Planta Daninha 29:69–75. https://doi.org/10.1590/S0100-83582011000100009
Gardner TA, Barlow J, Parry LW, Peres CA (2007) Predicting the uncertain future of tropical forest species in a data vacuum. Biotropica 39:25–30
Gerlach J, Samways M, Pryke J (2013) Terrestrial invertebrates as bioindicators: an overview of available taxonomic groups. J Insect Conserv 17:831–850. https://doi.org/10.1007/s10841-013-9565-9
Gibb H, Sanders NJ, Dunn RR et al (2015) Climate mediates the effects of disturbance on ant assemblage structure. Proc R Soc B 282:20150418. https://doi.org/10.1098/rspb.2015.0418
Gomes L, Desuó IC, Gomes G, Giannotti E (2009) Behavior of Ectatomma brunneum (Formicidae: Ectatomminae) preying on dipterans in field conditions. Sociobiology 53:913–926
Hammer Ø, Harper DAT, Ryan PD (2001) PAST: paleontological statistics software package for education and data analysis. Palaeontol Electron 4: 4. Available from URL: http://palaeo-electronica.org/2001_1/past/issue1_01.htm
Hansen MC, Potapov PV, Moore R, Hancher M, Turubanova SA, Tyukavina A, Thau D, Stehman SV, Goetz SJ, Loveland TR, Kommareddy A, Egorov A, Chini L, Justice CO, Townshend JRG (2013) High-resolution global maps of 21st-century forest cover change. Science 15:850–853. https://doi.org/10.1126/science.1244693
Hölldobler B, Wilson EO (2009) The superorganism: the beauty, elegance, and strangeness of insect societies. WW Norton & Company, New York
INPE (2020) INPE (Instituto Nacional de Pesquisas Espaciais). Projeto PRODES: Monitoramento da Floresta Amazônica Brasileira por Satélite (2019). Accessed 24 March 2020.http://www.obt.inpe.br/prodes/
Kruskal JB (1964) Nonmetric multidimensional scaling: a numerical method. Psychometrika 29:1–27
Kuate AF, Hanna R, Tindo M, Nanga S, Nagel P (2015) Ant diversity in dominant vegetation types of Southern Cameroon. Biotropica 47:94–100. https://doi.org/10.1111/btp.12182
Leal IR, Filgueiras BKC, Gomes JP, Iannuzzi L, Andersen AN (2012) Effects of habitat fragmentation on ant richness and functional composition in Brazilian Atlantic forest. Biodivers Conserv 21:1687–1701. https://doi.org/10.1007/s10531-012-0271-9
Lucey JM, Tawatao N, Senior MJ, Chey VK, Benedick S, Hamer KC, Woodcock P, Newton RJ, Bottrell SH, Hill JK (2014) Tropical forest fragments contribute to species richness in adjacent oil palm plantations. Biol Conser 169:268–276. https://doi.org/10.1016/j.biocon.2013.11.014
Mather PM (1976) Computational methods of multivariate analysis in physical geography. Wiley, London
McCune B, Grace JB (2002) Analysis of ecological communities. MjM Software Design, Gleneden Beach, Oregon
McCune B, Mefford MJ (1999) PC-ORD Multivariate analysis of ecological data. Version 4. MjM Software Design, Gleneden Beach, Oregon
Menezes ASO, Schmidt FA (2020) Mechanisms of species coexistence and functional diversity of ant assemblages in forest and pasture habitats in southwestern Brazilian Amazon. Sociobiology 67(1):33–40. https://doi.org/10.13102/sociobiology.v67i1.4552
Meyer PM, Rodrigues PHM (2014) Progress in the Brazilian cattle industry: an analysis of the Agricultural Censuses database. Anim Prod Sci 54:1338–1344. https://doi.org/10.1071/AN14280
Passos L, Oliveira PS (2002) Ants affect the distribution and performance of seedlings of Clusia criuva, a primarily bird-dispersed rain forest tree. J Ecol 90:517–528. https://doi.org/10.1046/j.1365-2745.2002.00687.x
Phillips HRP, Newbold T, Purvis A (2017) Land-use effects on local biodiversity in tropical forests vary between continents. Biodivers Conserv 26:251–2270. https://doi.org/10.1007/s10531-017-1356-2
Pimm SL, Jenkins CN, Abell R, Brooks TM, Gittleman JL, Joppa LN, Raven PH, Roberts CM, Sexton JO (2014) The biodiversity of species and their rates of extinction, distribution, and protection. Science 344:1246752. https://doi.org/10.1126/science.1246752
Ribas CR, Campos RBF, Schmidt FA, Solar RRC (2012) Ants as indicators in Brazil: a review with suggestions to improve the use of ants in environmental monitoring programs. Psyche 636749:1–23. https://doi.org/10.1155/2012/636749
Ribeiro MNG (1976) Aspectos climatologicos de Manaus. Acta Amazonica 6:229–233
Sala OE, Chapin FS, Armesto JJ et al (2000) Global biodiversity scenarios for the year 2100. Science 287:1770–1774. https://doi.org/10.1126/science.287.5459.1770
Silva RR, Silvestre R, Brandão CRF, Morini MSC, Delabie JHC (2015) Grupos tróficos e guildas em formigas poneromorfas. In: Delabie JHC, Feitosa RM, Serrão JE, Mariano, CSF, Majer JD (Org) As formigas Poneromorfas do Brasil. Editus, Ilhéus, pp 163–179
Solar RRC, Barlow J, Andersen AN, Schoereder JH, Berenguer E, Ferreira JN, Gardner TA (2016) Biodiversity consequences of land-use change and forest disturbance in the Amazon: a multi-scale assessment using ant communities. Biol Conserv 197:98–107. https://doi.org/10.1016/j.biocon.2016.03.005
Tscharntke T, Tylianakis JM, Rand TA et al (2012) Landscape moderation of biodiversity patterns and processes-eight hypotheses. Biol Rev 87:661–685. https://doi.org/10.1111/j.1469-185X.2011.00216.x
Vale P, Gibbs H, Vale R, Christie M, Florence E, Munger J, Sabaini D (2019) The expansion of intensive beef farming to the Brazilian Amazon. Global Environ Change 57:2–11
Vasconcelos HL (1999) Effects of forest disturbance on the structure of ground-foraging ant communities in central Amazonia. Biodiv Conserv 8:407–418. https://doi.org/10.1023/A:1008891710230
Vasconcelos HL, Vilhena JMS (2006) Species turnover and vertical partitioning of ant assemblages in the Brazilian Amazon: a comparison of forests and savannas. Biotropica 38:100–106. https://doi.org/10.1111/j.1744-7429.2006.00113.x
Vasconcelos HL, Vilhena JMS, Caliri GJA (2000) Responses of ants to selective logging of a central Amazonian forest. J Appl Ecol 37:508–514. https://doi.org/10.1046/j.1365-2664.2000.00512.x
Vasconcelos HL, Vilhena JMS, Magnusson WE, Albernaz ALKM (2006) Long-term effects of forest fragmentation on Amazonian ant communities. J Biogeogr 33:1348–1356. https://doi.org/10.1111/j.1365-2699.2006.01516.x
Vasconcelos HL, Vilhena JMS, Facure KG, Albernaz ALKM (2010) Patterns of ant species diversity and turnover across 2000 km of Amazonian floodplain forest. J Biogeogr 37:432–440. https://doi.org/10.1111/j.1365-2699.2009.02230.x
Veech JA, Summerville KS, Crist TO, Gering JC (2002) The additive partitioning of species diversity: recent revival of an old idea. Oikos 99:3–9. https://doi.org/10.1034/j.1600-0706.2002.990101.x
Walker NF, Patel SA, Kalif KAB (2013) From Amazon pasture to the high street: deforestation and the Brazilian cattle product supply chain. Trop Conserv Sci 6:446–467. https://doi.org/10.1177/194008291300600309
Wilkie KTR, Mertl AL, Traniello JF (2009) Diversity of ground-dwelling ants (Hymenoptera: Formicidae) in primary and secondary forests in Amazonian Ecuador. Myrmecol News 12:139–147
Yates M, Andrew NR (2011) Comparison of ant community composition across different land-use types: assessing morphological traits with more common methods. Aust J Entomol 50:118–124. https://doi.org/10.1111/j.1440-6055.2010.00795.x
Acknowledgements
We would like to thank the staff of the Laboratório de Ecologia-Evolução e Biodiversidade (UFS) for their field support and Potássio do Brasil Ltda and Golder Associates Brasil for the infrastructure support. JCS and JHCD acknowledges their research grants by CNPq (JCS grant process #312752/2018-0).
Author information
Authors and Affiliations
Corresponding author
Ethics declarations
Conflict of interest
The authors declare that they have no conflict of interest.
Supplementary Information
Below is the link to the electronic supplementary material.
Rights and permissions
About this article

Cite this article
Santos, J.C., Anjos, D.V., de Almeida, W.R. et al. Ground-dwelling ant diversity in Amazonian secondary forests and neighboring pastures. Trop Ecol 62, 279–287 (2021). https://doi.org/10.1007/s42965-021-00146-5
Received:
Revised:
Accepted:
Published:
Issue Date:
DOI: https://doi.org/10.1007/s42965-021-00146-5