
Abstract
The main objective of this study was to investigate the dynamic behavior of isolated structures with lead core rubber bearing (LCRB) and laminated rubber bearing (LRB) isolators under the influence of different earthquakes. First, a three-dimensional finite element model of the seismic isolator was created and analyzed using ABAQUS software based on a developed model. The hyper-viscoelastic properties were used for rubber layers in this modeling. Then, a 5-story base-isolated building on a laboratory scale was modeled on a well-verified isolator, which was once with core (LCRB) and then without the core (LRB). In this study, the isolation system was analyzed by dynamic explicit approach in ABAQUS and the behavior of the considered isolated building has been studied when subjected to Kobe, Northridge, and El Centro earthquakes. Finally, it was found that LCRB has a significant effect on reducing the amount of displacement and acceleration in the upper floors. However, it should be noted that the responses of the base-isolated building may unexpectedly appear reversely in some earthquakes and increase the responses.
Introduction
The topic of seismic isolators has come to the focus of attention in the seismic design of buildings in recent years. Most of the structures are subjected to many ground motions. As the damping of the structure itself is not enough to reduce the vibrations in structures that are subjected to strong motions, numerous numerical and experimental researches and studies have been carried out in order to reduce the effects of these type of earthquake by increasing damping in the structure (Martinesz-Romero 1993; Soong and Dargush 1997; Tehranizadeh 2001). Passive control can dissipate the energy applied to the structure in different ways and prevent it from damage (Martinesz-Romero 1993; Soong and Dargush 1997; Tehranizadeh 2001). The lead core rubber bearing (LCRB) was invented in 1970 and led to an increase in flexibility and damping (attenuation) in a single unit (Hwang and Chiou 1996). The rubber isolator system is the major system used to isolate the base, in which the rubber layers are reinforced with steel sheets. This type of isolator is capable of large lateral deformation and shows a lot of vibrations as a result of earthquake provocations (Naeim and Kelly 1999). Over the past three decades, a variety of isolator designs have been introduced and tested in real conditions, which have shown acceptable results under earthquake vibrations and also in preventing damage to the structures (Jangid and Datta 1995; Kelly 1986; Ounis et al. 2019). In this direction, Wu et al. conducted an experimental investigation on a 5-story steel structure in two types; one is isolated and another was fixed base subjected to various earthquake records (Wu and Samali 2002). They found that the use of seismic isolator reduced the acceleration and relative displacement of the roof by about 62% and 71%, respectively, and decreased the shear force by about 72%. Moreover, Shahin et al. carried out research on 3-, 6-, and 10-story base-isolated and fixed base structures, in 3D-BASIS software under dynamic analysis. (Alhan and Şahin 2011). They found that the base-isolated structures with higher ductility, significantly sustain larger accelerations than the structures with low ductility. They stated that ductility has a significant effect on the maximum acceleration rate of the floor. Using this method, the dynamic behavior of the structure occurs within the predicted range as much as possible and the amount of seismic damage to the structural and non-structural components would reduce.
Ahmadipour et al. performed some research on LCRB system under cyclic loadings (Ahmadipour and Alam 2017), using the numerical simulation, the hysteresis behavior of 81 samples were investigated with different parameters, they found that the diameter of the lead core has a great influence on reducing the amount of displacement and increasing the isolator damping rate.
In order to carry out this investigation, an isolator was first modeled in ABAQUS finite element software and was nonlinearly analyzed. It was then verified by the results found in Ahmadipour study (Ahmadipour and Alam 2017). Then, a three-dimensional 5-story steel structure on a small scale was modeled and mounted on the verified base isolation systems (LCRB and LRB). These structures were studied in the ABAQUS software under dynamic analysis with various records of well-known earthquakes. The results indicated a high effect of the lead core in reducing the displacement when compared with the LRB system. However, it should be noted that in some earthquakes, the behavior of the base isolation system will be reversed (Bagerzadeh Karimi and Genes 2019) and cause the displacements to be highly increased. Figure 1 illustrates the flowchart of the modeling steps in ABAQUS, briefly.

Process of modeling
Structural model
The specifications of the 5-story building
After the accuracy of the finite element modeling of isolator in ABAQUS, a small scale of 5-story structure mounted on the isolators (one on LCRB and then on LRB). Then, the structure subjected to various seismic excitations. The dimension of the structure is selected to be 1 m by 2 m, with the height of each floor, 0.6 m, and overall, the total height of the structure calculated to be 3 meters. The beam and column sections were 40 by 40 mm with 4 mm thickness. The steel used had an elastic modulus of 210 GPa and a Poisson ratio of 0.3. The total weight of the structure was evaluated to be 1289.61 kg.
Mechanical properties of the isolator system
The LCRB isolator device consists of a cylindrical lead core and several layers of rubber and steel plates. The rubber layers are sandwiched between steel layers. At the top and bottom of the isolator, the steel plate (end plates) has been used to control the isolator. The lead core rubber bearings are mostly made in hot method, so that when the rubber is semi-liquid, it is integrated between steel sheets and lead core, which results in the quality, longevity and performance improvement (Guideline for Design and Practice of Base Isolation System in Buildings. No.523), as well as steel layers cause vertical stability. Figure 2 shows a schematic view of the isolator components. The steel layers can move on to each other under the influence of external forces, but the lead core resists this displacement of steel layers and undergoes plastic deformation. As a result, the energy applied to the system is dissipated.

Schematic view of the isolator (LCRB)
The cylindrical core is contained within the layers of rubber and steel plates, between the steel sheets covered with the rubber layers. The eight rubber layers with a thickness of 5 mm are placed between the steel sheets. Two fixed steel plates have restrained the core on the top and bottom. Finally, the two base plates, which are the same as endplates, are in the same size as the isolator placed at the top and bottom of the isolation system. The steel used for the isolator has an elastic modulus of 210 GPa and the Poisson ratio of 0.3. In this study, the total height of the isolator, including the upper and lower plates, is measured to be about 156.10 mm. The LCRB has a force–displacement (hysteresis) loop as the hysteresis behavior of these isolators can be bilinear considering with an initial stiffness of about 9 to 16 times of the stiffness after yielding. As shown in Fig. 3, K1, K2, and Q are the hysteresis loop parameters, where the K1 is pre-yielding stiffness (initial stiffness), K2 is the post-yielding stiffness and Q is the characteristic strength where the loop intersects the y-axis. But since determining and measuring the pre-yielding stiffness (K1) is difficult. Thus, the post-yielding stiffness (K2) is used in the modeling. Q is the force that is generated after removing the load and reloading and returning to the zero displacements. According to the K2, Q, and D, the effective stiffness of the device can be obtained according to Eq. (1).

Hysteresis loop for LCRB
In Eq. (1), D is the maximum displacement leading to the yielding of lead. And the effective damping of \(\beta_{eff}\) is determined according to Eq. (2).
The properties of rubber and lead
Rubber has a high elastic deformation capability, which allows it to return to its original state after alternate and sequential loading and unloading. Rubber is mainly used for seismic protection of structures in the viscoelastic isolators and isolated bases (Naeim and Kelly 1999; Derham et al. 1985). In the isolation system investigated in this study, the rubber is placed between the steel layers, and the steel sheets can move together and provide the necessary resistance against lateral forces. The rubber used in this study has a shear coefficient of 0.78 MPa, a volume factor of 1.5 MPa, an elastic modulus of 2 MPa, and a Poisson ratio of υ = 0.278. The hysteresis diagram of the rubber used in the examined isolator is shown in Fig. 4. Figure 5 shows the shear stress–strain diagram of the rubber used in Ahmadipour investigation (Ahmadipour and Alam 2017) at the strain rate of 50%, which is equal to 20 mm. According to Eq. (3), the displacement of rubber ΔL is the product of shear–strain percentage, ε, and the total height of the rubbers, hr (Ahmadipour and Alam 2017).

Rubber hysteresis diagram (Ahmadipour and Alam 2017)

Stress–strain diagram of the lead (Ahmadipour & Alam, 2017)
The recrystallization feature is one of the important characteristics of lead, which creates a restoring force and returns the isolator to the first state (Parulekar et al. 2004). The lead core, yielding during vibration, increases the damping ratio of the critical damping in the isolator of about more than 10%. The lead core embedded in the device leads to the creation of the elastoplastic hysteresis loop (Naeim and Kelly 1999). In this way, the successive yields under lateral dynamic loads, such as ground motions, do not result in a fatigue phenomenon in the lead. Given that the lead core is heated constantly under the influence of cyclic forces and its property changes to a semi-solid state, thus, an alloy is needed that can maintain its position as soon as the applied forces are interrupted and quickly cool down and return to the solid-state (Ioannis et al. 2009). Under the shear force relatively at low tensions of about 8–10 N/mm2, the lead reaches the yield level and, thus, shows a stable hysteresis behavior and dissipates a significant amount of energy at the time of relatively large earthquakes (Ioannis et al. 2009). Moreover, by providing sufficient initial stiffness, the lead core makes the isolated structure resistant against weak lateral loads such as winds or mild earthquakes (2010).
The lead used in this study has a bilinear elastoplastic behavior. The examined lead also has a yield stress of 10.5 Mpa, an elasticity modulus of 18000 MPa, Poisson’s ratio of 0.43, and post-stiffness coefficient of α = 0.005.
Considered ground motions
In this study, the behavior of the considered base-isolated building has been studied under the three different ground motions, as illustrated in Table 1.
Finite element method
Finite element method is not a new technique, and this method was first introduced in the 1950s and has been developed continuously since then. Currently, this method is advanced using related software for solving many engineering problems and is widely used in the various branches of the industry (Fagan 1996). This method is used to analyze parts with different shapes, for example, for analysis of diagonal composite plates (Anish et al. 2019; Kumar et al. 2014, 2015; Kumar and Kumar 2018) simulation of the dynamic response of steel storage tanks under earthquake(Anumod et al. 2014) stability study of composite bridges (Alenius 2003), dampers (Hejazi et al. 2014), and etc. In recent years, ABAQUS software has been used as finite element (FE) problem-solving software, which is widely used in nowadays science engineering and technology.
Modeling in ABAQUS
Create model geometry
This section deals with the process of modeling lead core isolators and superstructure, it should be noted that all modeling steps for non-core isolators have been performed in the same way (ABAQUS CAE User’s Manual, V6.14). To model the isolator in ABAQUS software, first, the geometry of the model is created in the Part module. Then, for the modeling of the columns and beams of the steel superstructure, according to Fig. 6, the Wire element is selected. One of the benefits of assigning Wire mode to long sections is that it speeds up the analysis.

Definition of lead core specifications in the part module
Define material properties
At this stage, the properties of the model components, such as density, modulus of elasticity, Poisson’s coefficient, as well as the plastic properties of the model, including stress and strain, are defined and then assigned to them. The result of uniaxial and biaxial tension–compression tests which is performed by Yoshida for rubber modeling (Yoshida et al. 2004) has been used in this investigation. The rubber strain is defined as hyper-viscoelastic. Mooney–Rivlin model is being introduced as hyper-elastic characteristics of rubber and the Prony model is being known as the viscoelastic profile of the rubber in ABAQUS (Dezfuli and Alam 2013, 2014). The diagrams of uniaxial and biaxial tests of rubber are illustrated in Fig. 7.

As shown in Fig. 8, the uniaxial and biaxial characteristics of the rubber are considered in accordance with the data from Yoshida and Fujino (Yoshida et al. 2004). Figure 9 shows the settings for the rubber properties in the Edit Material window.

Introducing uniaxial and biaxial rubber tests

Introducing the properties of rubber in ABAQUS
Figure 10 also shows the introduced characteristics of the lead core. As shown in Fig. 10, the modulus of elasticity and the Poisson coefficient of the lead core are listed in the Data section. In addition, Fig. 11 depicts the characteristics of the steel used, such as the modulus of elasticity and the Poisson coefficient in the same window.

Introducing the properties of lead core in ABAQUS

Introducing the properties of steel in ABAQUS
Assembly of parts
In this stage, the model components are assembled and mounted together. Retain mode was used to merge according to Fig. 12. It should be noted that merging parts creates a connection between all components and the integrated performance of the model. As shown in Fig. 13, after the isolator mount, a five-story structure was placed on the isolators.

Settings for merge parts in ABAQUS

Schematic figure of 3D model in ABAQUS
Define the solution steps
In this study, the General method, which includes a variety of analyzes, was selected (Fig. 14). And Dynamic, Explicit Analysis, is considered.

Introducing solution steps in step module
Contact definition
The Interaction module is used to define contact behaviors such as friction or heat between components, binding degrees of freedom and connections. In this study, because the parts in the Assembly section are interconnected in a Merge mode, the Tie constraint is used only to attach the upper structure to the isolators. Figure 15 shows the definition of the type of constraint.

Introducing the type of connection in interaction module
Applying boundary conditions
At this stage, the boundary conditions and loading of the components are defined. The following boundary conditions are considered in this study, and Figs. 16 and 17 illustrate how boundary conditions are applied.

Select the boundary condition type in the boundary condition module

Define the type of boundary condition and select amplitude
- 1.
The bottom of the isolators is shown in Fig. 18. They are fixed along with the X and Z directions, and the displacement is only possible along the Y direction.
Fig. 18 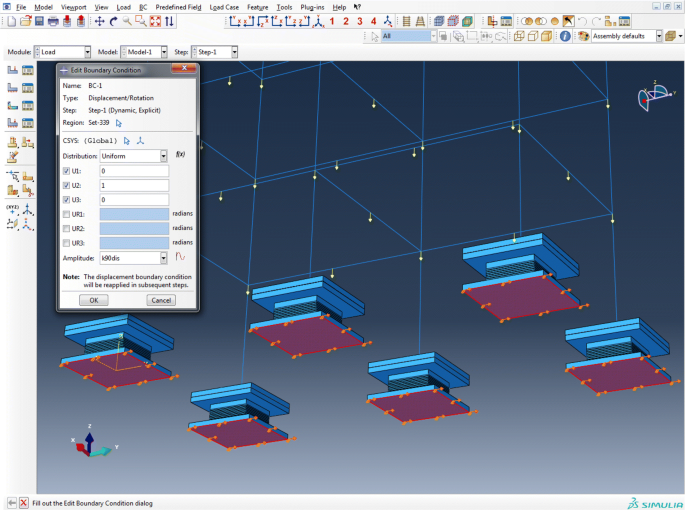
Schematic view of boundary conditions under the isolators in the load module
- 2.
The top of the isolators is free in all directions.
- 3.
Eccentricity has not been applied to the structure.
- 4.
A linear load of 30 kg/m is applied to the superstructure’s beams—the direction of the load as shown in Fig. 19, which is vertical to the Z-direction.
Fig. 19 
Apply linear load on beams in the load module


Meshing
In this section, the type and number of elements are specified and the model has meshed. In this study, the type of Tet, which in fact, consists of four-sided pyramid-shaped elements, is applied and the free configuration pattern is used, as shown in Fig. 20, is considered. C3D4 was used as 3D members, which is a member of four nodes. Finally, the model is shown in Fig. 21. Moreover, the mesh convergence curve has also been illustrated in Fig. 22 for each number of elements.

Select the type of meshing

Meshed shape of the model in mesh module

Mesh convergence curve
Validation result
In this section, the results of ABAQUS analysis were compared with the experimental results (Ahmadipour and Alam 2017). Figure 23 illustrates the cyclic shear force for a single isolator presented in the model (Ahmadipour and Alam 2017) and Fig. 24 shows the Misses stress distribution of the mists in accordance with the loading cycle presented in Fig. 23, at maximum displacement. As can be seen in Fig. 25, the software results cover the results in Ahmadipour study (Ahmadipour and Alam 2017).

Cycle loading of the model (Ahmadipour and Alam 2017)

Distribution of Mises stress in the isolator at maximum displacement

ABAQUS analysis results with the results in (Ahmadipour and Alam 2017)
Results and discussion
The isolated building modeled in ABAQUS subjected to Kobe, Northridge, and El Centro earthquakes (Fig. 26). The considered building was analyzed once with LCRB and then with LRB. Dynamic Explicit analysis has been implemented to analyze the 5-story base-isolated building. The 5-story base-isolated steel structure has different reactions under different records. According to Fig. 27, when the structure is subjected to Kobe earthquake, the amounts of displacement of the roof are initially close at the beginning period of the ground motion when the building isolated by LCRB and LRB are compared (up to initial 5 s). But after the fifth second, the reduction in the movement of the roof floor is observed. The lead core reduced the maximum roof displacement by about 33% under Kobe’s record. The previous case cannot be seen for the building subjected to Northridge earthquake. Displacement for the building isolated by LCRB is less than the building isolated by LRB at the initial time of the ground shaking. The displacement reduction subjected to Northridge record is about 64% (the results compared between the both LCRB isolated building and LRB isolated building). The same behavior can be seen for the base-isolated building subjected to El Centro earthquake and the amount of displacement reduction is about 51%. It should be noted that the difference in the displacement of two types of isolators in Northridge earthquake is more than the other records. Also, according to the diagrams shown in Fig. 27, the roof displacement for the Northridge and El Centro records in the non-core state has more vibrated than in the core state. Therefore, it can be concluded that the lead core has a significant effect to reduce structural vibrations. By examining the software outputs, it was found that the column stress in the core state was 53% higher than the non-core state. Also, the lead core reduces the vertical displacement of the upper plate by 10 times and reduces the isolator displacement by about more than 60%. The maximum amounts of displacement of the isolator, the maximum acceleration of the isolator, and the maximum displacement of the roof are also shown in Table 2.

Acceleration chart of the maps used in the software

The maximum roof displacement diagram under Kobe, Northridge, and El Centro earthquakes
Moreover, based on Fig. 28, it can be clearly seen that the amplitude of the bearing displacement is increased at the frequency of about 0.2 rad/s. And the amplitude of bearing is at the highest level for the case when LRB is used for El Centro ground motion which implies that the considered base-isolated building can be cached quasi-resonance easily when LRB system is used. In addition, by using LCRB system, it can be observed that the amplitude of bearing for the same ground motion (Elcntro) is highly reduced.

Amplitude of bearing displacement
Conclusion
In this study, the LCRB and LRB isolators were subjected to various earthquake records. Isolators are made up of several layers of steel and rubber and lead core. In this paper, the finite element model of isolators was analyzed for both static and dynamic states. Hyper-elastic properties modeling of viscoelastic materials and nonlinear behavior of lead core was proposed. This isolator was analyzed in ABAQUS software and then matched with the results in (Ahmadipour and Alam 2017). After ensuring the accuracy of the modeling, an experimental-scale five-floor steel structure was placed on the isolators. The system was then subjected by various seismic records. The most obvious findings to emerge from this study are as follows:
- 1.
According to the results of the analysis, the lead core can significantly improve the response of the structure.
- 2.
Lead core has a great influence on the reduction of roof displacement. This rate for the structure under Kobe, Northridge, and El Centro records was 33%, 64%, and 51%, respectively.
- 3.
In the design of seismic isolations, they may reduce displacement under one record but may have the opposite effect under another record. According to the results, the displacement value of the isolation system under the Kobe 90°, is lower for the non-core state than for the core state.
- 4.
Maximum acceleration of the LCRB isolation system is more than the LRB system.
- 5.
The considered base-isolated building can be caught quasi-resonance easily when LRB system is used.
References
ABAQUS CAE User’s Manual. (V6.14).
Ahmadipour, M., & Alam, M. (2017). Sensitivity analysis on mechanical characteristics of lead-core steel reinforced elastomeric bearings under cyclic loading. Engineering Structures,140, 39–50.
Alenius, M. (2003). Finite element modelling of composite bridge stability. Technical Reports from Royal Institute of Technology Department of Mechanics SE-100 44 Stockholm, Sweden.
Alhan, C., & Şahin, F. (2011). Protecting vibration-sensitive contents: An investigation of floor accelerations in seismically isolated buildings. Bulletin of Earthquake Engineering,9, 1203.
Amin, A., Lam, M., & Okui, Y. (2002). n improved hyperelasticity relation in the modeling of the viscoelastic response of natural and high damping gum in compression: experiments, parameter identification and numerical verification. Mechanics of Materials,34(2), 75–95.
Anish, A., Chaubey, A. K., Vishwakarma, S., & Kumar, A. (2019). Transient response of rhombic laminates. Structural Engineering and Mechanics, 70(5), 551–562.
Anumod, A., Harinarayanan, S., & Usha, S. (2014). Finite element analysis of steel storage tank under siesmic load. International Journal of Engineering Research and Applications (IJERA), 2248–9622.
Bagerzadeh Karimi, M. R., & Genes, M. C. (2019) “Probabilistic Behavior Assessment of Base-Isolated Buildings and Base Isolation Systems Subjected to Various Earthquakes with Different Components”. Arabian Journal for Science and Engineering, 44(10), 8265–8288.
Derham, C. J., Kelly, J. M., & Thomas, A. G. (1985). Nonlinear natural rubber bearings for seismic isolation. Nuclear Engineering and Design,84(3), 417–428.
Dezfuli, F. H., & Alam, M. S. (2013). Multi-criteria optimization and seismic performance evaluation of the carbon-based FRP-based elastomeric isolator. Engineering Structures,49, 525–540.
Dezfuli, F. H., & Alam, M. S. (2014). Sensitivity analysis of carbon fiber-reinforced elastomeric isolators based on experimental tests and finite element simulations. Bulletin of Earthquake Engineering,12(2), 1025–1043.
Fagan, M. J. (1996). Finite element analysis: Theory and practice. Prentice Hall, ISBN-13: 978-0582022478
Guideline for Design and Practice of Base Isolation System in Buildings, No 523. (2010). Islamic Republic of Iran, Society of Civil Engineers.
Hejazi, F., Zabihi, A., & Jaafar, M. (2014). Development of elasto-plastic viscous damper finite element model for reinforced concrete frames. Soil Dynamics and Earthquake Engineering,65, 284–293.
Hwang, J., & Chiou, J. (1996). An equivalent linear model of lead-rubber seismic isolation bearings. Engineering Structures, 18(7), 528–536.
Ioannis, V., Kalpakidis, M., & Constantinou, C. (2009). Effects of heating on the behavior of lead-rubber bearingsverification of theory. Journal of Structural Engineering,135(12), 1450–1461.
Jangid, R. S., & Datta, T. K. (1995). Seismic behavior of base-isolated buildings-a state-of-the-art review. Proceedings of the Institution of Civil Engineers - Structures and Buildings, 110(2), 186–203.
Kelly, J. M. (1986). Aseismic base isolation: review and bibliography. Soil Dynamics and Earthquake Engineering,5(4), 202–216.
Kumar, A., Chakrabarti, A., & Bhargava, P. (2014). Accurate dynamic response of laminated composites and sandwich cylindrical shells based on higher order zigzag theory. Thin-Walled Structures,77, 174–186.
Kumar, A., Chakrabarti, A., & Bhargava, P. (2015). Vibration analysis of laminated composite skew cylindrical shells using higher order shear deformation theory. Journal of Vibration and Control, 21(4), 725–735.
Kumar, A. C., & Kumar, A. (2018). Vibration of laminated composite shells with cutouts and concentrated mass. AIAA (American Institute of Aeronautics and Astronautics) Journal,56, 1662–1678.
Martinesz-Romero, E. (1993). Experiences on the use of supplemental energy dissipators on building structures. Earthquake Spectra,9(3), 581–624.
Naeim, F., & Kelly, M. J. (1999). Design of seismic isolated structures: from theory to practice. New York: Wiley.
Ounis, H. M., Ounis, A., & Djedoui, N. (2019). A new approach for base isolation design in building codes. Asian Journal of Civil Engineering,20(6), 901–909.
Parulekar, Y. M., Reddy, G. R., Vaze, K. K., & Kushwaha, H. S. (2004). Lead extrusion dampers for reducing seismic response of coolant channel assembly. Nuclear Engineering and Design,227(2), 175–183.
Soong, T. T., & Dargush, G. F. (1997). Passive energy dissipation systems in structural engineering. New York: Wiley.
Tehranizadeh, M. (2001). passive energy dissipation device for typical steel frame building in Iran. Engineering Structures,23(6), 643–655.
Wu, Y., & Samali, B. (2002). Shake table testing of a base isolated model. Engineering Structures,24, 1203–1215.
Yoshida, J., Abe, M., & Fujino, Y. (2004). Constitutive model of high-damping rubber. Journal of Engineering Mechanics,130(2), 129–141.
Author information
Authors and Affiliations
Corresponding author
Ethics declarations
Conflict of interest
On behalf of all authors, the corresponding author states that there is no conflict of interest.
Additional information
Publisher's Note
Springer Nature remains neutral with regard to jurisdictional claims in published maps and institutional affiliations.
Rights and permissions
About this article

Cite this article
Bagerzadeh Karimi, M.R., Aghabalaie Khordachi, M. Assessing the three-dimensional seismic behavior of the multi-degree-of-freedom (MDOF) structure with LCRB and LRB control systems. Asian J Civ Eng 21, 871–884 (2020). https://doi.org/10.1007/s42107-020-00246-y
Received:
Accepted:
Published:
Issue Date:
DOI: https://doi.org/10.1007/s42107-020-00246-y