
Abstract
This paper introduces a multimodal emotion recognition system based on two different modalities, i.e., affective speech and facial expression. For affective speech, the common low-level descriptors including prosodic and spectral audio features (i.e., energy, zero crossing rate, MFCC, LPC, PLP and temporal derivatives) are extracted, whereas a novel visual feature extraction method is proposed in the case of facial expression. This method exploits the displacement of specific landmarks across consecutive frames of an utterance for feature extraction. To this end, the time series of temporal variations for each landmark is analyzed individually for extracting primary visual features, and then, the extracted features of all landmarks are concatenated for constructing the final feature vector. The analysis of displacement signal of landmarks is performed by the discrete wavelet transform which is a widely used mathematical transform in signal processing applications. In order to reduce the complexity of derived models and improve the efficiency, a variety of dimensionality-reduction schemes are applied. Furthermore, to exploit the advantages of multimodal emotion recognition systems, the feature-level fusion of the audio and the proposed visual features is examined. Results of experiments conducted on three SAVEE, RML and eNTERFACE05 databases show the efficiency of proposed visual feature extraction method in terms of performance criteria.
1 Introduction
Intelligent machines are becoming an undeniable part of modern life. The importance of this issue has caused more attention to the human–machine interaction field in recent years. In this regard, improving the quality of the relationship between human and machine is desired, to be more realistic, friendly and interactive. One of the most important factors that increase the impact of relation is to recognize the human emotion by machine with the aim of making appropriate reactions. Speech is a common form of communication between human beings for conveying emotion. Albeit, the complexity of behavior, accent, etc., can challenge the recognition of emotion from speech. In addition to speech analysis, the study of facial expressions as well as the physiological states of the body, i.e., hands and feet can be also utilized to recognize the human emotions (Sebe et al. 2005; Jaimes and Sebe 2007). However, the human emotion is a complex and ambiguous phenomenon that depends on different factors such as gender, age, culture, language, nationality, etc., which makes it difficult for mathematical modeling. In order to overcome the challenges, the development of intelligent emotion recognition systems is taken into consideration in recent years due to the capabilities of computer systems in modeling and high-speed computing. Collaboration among groups of researchers in various fields such as computer, psychology and cognitive sciences has enabled computers to identify, interpret and express human emotions (Oatley and Johnson-Laird 1987; Caridakis et al. 2007). This capability makes the computers more efficient in such areas as e-learning, e-commerce, remote medicine and psychiatry and social networking.
The intelligent emotion recognition system is the process of human emotion classifying based on various modalities by using intelligent methods. In the first stage of this process, the appropriate features that have the highest correlation with the human emotion are extracted from the desired modality. Then, the emotion categorization is performed by using different classification methods. In particular, one of the key differences between proposed methods in the literature is the type of signal used for feature extraction. According to this, three main approaches can be distinguished: (1) audio-based approaches are based on extracting desired features from human speech signal, whereas (2) visual-based approaches obtain features by analyzing the human face. However, (3) multimodal methods (i.e., hybrid of the previous methods) have been of interest in recent years. By utilizing the various techniques of features fusion, these methods employ various modalities simultaneously for emotion recognition. An important issue in this field is to extract effective features and also utilize an appropriate classification model for deriving more accurate final models (Seng et al. 2016).
The main contribution of this study is to propose a new visual feature extraction method through the facial landmark analysis. To this end, the displacement of specific landmarks over time is exploited. In particular, this method considers the displacement of the landmarks across consecutive frames of utterance as a time series and analyzes the temporal variations of each landmark by one of the well-known mathematical transforms to extract desired features. The final feature vector is then constructed by concatenating extracted features from total landmarks. The displacement signal analysis of landmarks can be performed by a variety of mathematical transforms. In this study, the discrete wavelet transform (DWT) has been employed as a widely used transform in the signal processing. The DWT reveals hidden information of original signal by separating it into low- (approximation) and high-frequency (details) components, respectively. The information contents collected from sub-bands (coefficients) are then combined to construct final visual feature vector. After feature extraction phase, the effectiveness of proposed method has been studied using state-of-the-art classifiers. To this end, different experiments are conducted and results compared together. The proposed method has been applied on three datasets including SAVEE (Jackson and Haq 2014), RML (Wang and Guan 2008) and eNTERFACE05 (Martin et al. 2006), that includes different emotional utterances in six principal emotions. Results show improvements in the model accuracy with respect to the state-of-the-art alternatives with few exceptions. Furthermore, the common audio features including energy, zero crossing rate (ZCR), MFCC, LPC, RASTA-PLP and temporal derivations are also utilized to exploit the capabilities of audio-visual fusion for enhancing the final performance of model.
The rest of this paper is organized as follows: in Sect. 2, we review the latest works in audio-visual emotion recognition system. Section 3 describes the various components of common audio-visual emotion recognition system. In Sect. 4, the proposed visual feature extraction method as well as audio features is described. Section 5 includes simulation system setup and conducting different experiments on three common databases. Section 6 concludes the paper.
2 Related work
Researches in the field of intelligent human emotion recognition started some years ago. Many studies have been conducted by using various types of features, especially audio, visual and body gesture features. Nevertheless, in recent years more attention has been paid to multimodal approaches which fuse different kinds of features in the process of human emotion recognition. Feature fusion is the process of combining two or more feature vectors to construct a single feature vector. The major difference of the works often relates to the type of features and classifiers. In the following, we review the latest works in multimodal emotion recognition with emphasis on audio and visual modalities.
The authors in (Datcu and Rothkrantz 2014) introduce a novel technique for the recognition of emotions from audio and visual data. Depending on the presence or absence of speech, two types of models based on geometric face features for facial expression recognition are used in this work. In (Xie et al. 2015), a novel audio-visual emotion recognition solution using multimodal information fusion based on entropy estimation is introduced. This work proposes a dual-level fusion framework which consists of feature-level fusion module based on kernel entropy component analysis and score-level fusion module based on maximum correntropy criterion. In order to recognize facial expression and facial action units (AU) detection with considering dynamic of videos, a novel Variable-State Conditional Random Field model is proposed in (Walecki et al. 2015) that automatically selects the optimal latent states for the target image sequence based on the input data and underlying dynamics of the sequence. Also, two novel learning strategies and the posterior regularization of the latent states are proposed to derive a more robust model for the target tasks. The research presented in (Poria et al. 2016) describes a method to extract features from audio, visual and textual modalities using deep convolutional neural networks. The (Goyal et al. 2016) addresses the problem of continuous emotion prediction in movies from multimodal cues. To do this, a set of audio and video features including video compressibility and histogram of facial area is utilized. Also, a fusion model based on the mixture of experts is proposed in this work that fuses the information from the audio and video modalities for predicting the dynamic emotion. In (Haq et al. 2016), a comparative analysis of filter and wrapper approaches of feature selection has been presented for the audio, visual and audio-visual human emotion recognition. In filter approach, feature selection is performed using the MORE l-Take Away r algorithm. In wrapper method, features are selected based on their classification performance using support vector machine (SVM) classifier. The SVM classifier was then used for human emotion recognition. The authors in (Kaya and Salah 2016) propose extreme learning machines as an alternative for single-layer feedforward networks to model audio and video features for emotion recognition. In the paper (You et al. 2016), a cross-modality consistent regression model is proposed which utilizes both visual and textual sentiment analysis techniques. Seng et al. (2016) propose an audio-visual emotion recognition system that uses a mixture of rule-based and machine learning techniques to improve the recognition efficacy. In this system, the extracted visual features are passed into optimized RBF neural classifier. Also, the extracted audio features are passed into an audio feature-level fusion module that uses a set of rules to determine the most likely emotion contained in the audio signal. Mou et al. (2016) propose a novel framework for automatic emotion analysis of each individual in group settings along both arousal and valence dimensions. For facial expression analysis, a novel descriptor is introduced to encode spatiotemporal information. The paper then proposes a method to recognize the group membership of each individual by using their face and body behavioral cues. Authors in Hossain et al. (2016) propose a bimodal system of big data emotion recognition that combines the potential of emotion-aware big data and cloud technology toward 5G. Subramaniam et al. (2016) propose a novel approach for First Impressions Recognition in terms of the Big Five personality-traits from short videos. They train two bimodal end-to-end deep neural network architectures using temporally ordered audio and novel visual features from few frames. In Patwardhan and Knapp (2016), color- and depth-sensing device are used for facial feature extraction and tracking human body joints. The temporal features across multiple frames are then used for emotion recognition. Eventually, an event-driven decision-level fusion is used to combine the results from each individual modality. Chao et al. (2016) focus on two key problems for audio-visual emotion recognition in the video, i.e., audio and visual streams temporal alignment for feature-level fusion and locating and re-weighting the perception attentions in the whole audio-visual stream. Also, the long short-term memory NN is employed for classification. Gharavian et al. (2017) recognize the emotions from audio and visual information using fuzzy neural network along with PSO for the parameters optimization. Also, the fusion of audio and visual systems is conducted at both decision and feature levels. In Guo et al. (2017) a multimodality convolutional neural network (CNN) based on visual and geometrical information is proposed. In Kaya et al. (2017), a system for multimodal expression recognition in the wild is proposed wherein the CNN-based features are obtained via transfer learning. The approach fuses audio and visual features with least squares regression-based classifiers and weighted score-level fusion. Authors in Noroozi et al. (2017) present a multimodal emotion recognition system based on the analysis of audio and visual cues. For the visual part, facial landmarks’ geometric relations are computed. In this work, each emotional video is summarized into a reduced set of key frames by applying the CNN such that the confidence outputs of all the classifiers from various modalities are used to define a new feature space. The work by Tzirakis et al. (2017) proposes an emotion recognition system using auditory and visual modalities which also utilize a CNN to extract features from the speech and a deep residual network for the visual modality. This method employs long short-term memory networks as insensitive to outlier machine learning algorithm. For an extended review of multimodal emotion analysis, the interested readers are referred to (Poria et al. 2017; Soleymani et al. 2017) which review the progress made in the field from the past to the present.
As mentioned earlier, three different databases are employed in this work, namely Surrey Audio-Visual Expressed Emotion (SAVEE), RML and eNTERFACE05 to perform multimodal emotion recognition. All databases have a set of six principal emotions including happiness, sadness, anger, fear, surprise and disgust based on Ekman model (Ekman et al. 2013) which make them appropriate for conducting experiments. According to this, the characteristics of recent multimodal emotion recognition works using the above-mentioned databases have been studied and summarized in Table 1. As shown, various classifiers have been employed to recognize the emotion using audio and visual modalities. Besides the advantages, the weaknesses and limitations of the widely used classifiers in the field can be examined from different aspects. For instance, the SVM is a powerful and flexible classifier which operates based on the concept of decision planes by defining decision boundaries. The most serious problem with the SVM is the selection of the best kernel function and parameters. High algorithmic complexity, extensive memory requirements for large datasets, overfitting, difficulty of interpreting the final model and need to pairwise classifications in the multi-class case are other drawbacks of the SVM classifiers (Rifkin et al. 2003; Cawley and Talbot 2010; Cevikalp and Triggs 2013; Karamizadeh et al. 2014). As another commonly used supervised learning method we can refer to Hidden Markov Model (HMM) which provides a tool for representing probability distribution over sequence of observations. According to this, the observed data are modeled as a series of outputs generated by one of several hidden states (Ghahramani 2001). Though high speed and accuracy due to strong analytical basis are considered as the HMM specifications, this model suffers from different limitations such as the dependence of the model accuracy on the number of states and parameters. Also, this modeling approach is limited to applications satisfying the Markov property (Degirmenci 2014; Chakraborty and Talukdar 2016). Another well-known machine learning method in the field of emotion recognition system is Gaussian Mixture Model (GMM). The GMM is a parametric probability density function represented as a weighted sum (mixture) of Gaussian component densities (Reynolds 2015). Although this method benefits from the Gaussian distributions characteristics, several limitations can undermine the functionality of this model. In addition to computational complexity in the case of high dimensional problems, there is no specified algorithm to determine the number of mixture models (Yu and Deng 2016). This problem can be extended to the CNN method in which the reason of number of data and layers to obtain a certain performance is not specified. As other limitations of CNN, we can refer to the very time-consuming training process and need more powerful GPUs and large amounts of storage. Overfitting due to small dataset and also the complexity of hidden layers which makes it difficult to interpret the results, sensitivity to misclassification and over-classification are other challenges. Nevertheless, the CNN is able to detect important features at different levels from input data (image/video/audio) similar to a human brain and is also more computationally efficient, easier to train and has fewer parameters in comparison with conventional neural network (Goodfellow et al. 2016).
3 Audio-Visual emotion recognition system
Human beings communicate with each other more efficiently through the expression of emotions. The effect of emotion can be observed in facial movement, tone of voice changes, hand or body motion and also biological signals, e.g., heart and pulse rate. Due to the importance of this issue, the analysis of emotional state of a person that falls into the affective computing field is taken into consideration recently. Affective computing can be known as the study and development of systems which identify, interpret, process and simulate the human emotion in collaboration with other sciences such as computer science, psychology and cognitive science (Tao and Tan 2005).
One of the major challenges in the emotion recognition field is the lack of an agreement on a unified classification system. Emotional behavior of each person is a combination of the ambiguous and complex emotions, while the emotion itself depends on the personality characteristics and also the internal states of the person. Consequently, the emotion cannot be categorized based on a series of basic emotions in most cases. Psychologists have introduced different models for classifying emotion based on this theoretical question, i.e., emotion is a discrete class of behaviors or part of a larger continuum (Colombetti 2009). From the first viewpoint, emotion is a discrete phenomenon, and hence, it is distinguishable, measurable and separable (Colombetti 2009). Ekman, one of the most prominent people in this field, has conducted different researches about the similarities and differences of emotion across different cultures (Ekman et al. 2013). He introduced six principal emotions including fear, disgust, anger, surprise, joy and sadness in the universal human culture. In contrast, from a dimensional viewpoint, all emotions are characterized by two or three dimensions that are often valence and arousal in most models (Barrett 1998). As a well-known model, Robert Plutchik developed the “wheel of emotions” which arranges emotions in concentric circles where inner circles are more basic and outer circles more complex. The strength of each emotion can be measured by its distance from the center. According to this, the eight basic emotions are grouped on a positive or negative basis: joy versus sadness; anger versus fear; trust versus disgust; and surprise versus anticipation (Plutchik 1980). Accordingly, basic emotions could be combined in different ways to form the complex emotions related to full spectrum of human emotional experience. For example, anger and disgust may be combined to indicate contempt (Plutchik 1980).
The structure of the common multimodal emotion recognition is composed of five main parts as shown in Fig. 1. The first part is to create a proper dataset as the prerequisite of the system. Recording utterances in different human emotional states, marking the face and tracking and also the voice extraction from utterances are the different stages of this part. Then, the proper features that have the highest correlation with emotion are identified and extracted. These features include audio and visual features that are extracted from the utterances. The next step is fusion of audio and visual features which can play an important role in enhancing the efficiency of the model. Feature vector may include a number of irrelevant features that cause the complexity of the model. Applying dimensionality-reduction techniques can improve the efficiency and reduce the complexity of the final model. In the final stage of the mentioned process, emotion classification is performed. The important issue in this process is the selection of appropriate audio-visual features and also efficient classification model to derive more accurate model. In the following, different parts of the emotion recognition system are described in more detail.

Main parts of multimodal emotion recognition system
In order to study the efficiency of proposed method, the database SAVEE is used in this work that includes recorded utterances of four male actors aged between 27 and 31 years. A total of 480 native British English language utterances are produced in seven states consisting of six principal emotions (angry, disgust, fear, happiness, sadness, surprise) and one natural state. Each actor read 120 sentences totally including 15 sentences for each basic emotion and 30 sentences for natural state. The sampling rate for voice is 44.1 kHz, and the number of frames per second for video is 60 (Jackson and Haq 2014). Also, to validate the results of proposed method, two other emotional databases, namely RML and eNTERFACE05 are employed. The RML database includes 720 samples containing audio-visual emotional utterances. It includes 8 human subjects, speaking six different languages (English, Mandarin, Urdu, Punjabi, Persian and Italian). Different accents of English and Chinese are also included. The samples are recorded at a sampling rate of 22,050 Hz using a single-channel 16-bit digitization, and a frame rate of 30 fps. A total number of ten different sentences are provided for each emotional class. Each video clip has a length of about 3-6 s with one emotion being expressed (Wang and Guan 2008). The eNTERFACE05 database contains 1166 audio-visual clips in English created from 42 subjects from different nationalities. The frame rate and the audio sample rate are equal to 25 fps and 48,000 Hz, in an uncompressed stereo 16-bit format, respectively (Martin et al. 2006). Table 2 summarizes the characteristics of the utilized databases in this work.
Feature extraction is the most important part of the emotion recognition system. The features extracted in this study are divided into two different categories including audio and visual features. Audio features generally fall into three categories: time, spectral and perception domain. In this study, the prosodic and also spectral domain features which inspired the human hearing system are used. These are Energy, ZCR, MFCC, LPC, RASTA-PLP and also first and second temporal derivatives. Furthermore, visual features are extracted using new visual feature extraction approach which exploits the displacement of specific landmarks on the human face. For this, the discrete wavelet transform (DWT) is employed as a well-known transform in the field of signal processing. The proposed approach will be described in more detail in the following. After audio and visual feature extraction, the fusion of feature is conducted. Fusion can be performed at two different levels, i.e., feature level and decision level. In the feature level, the extracted feature vectors from speech and video are combined and are used to develop an intelligent emotion recognition model. While in the decision-level fusion, the individual models are derived by visual and audio features and then the combination of outputs is obtained in different ways such as majority voting. In this study, the feature-level fusion method which blends audio and proposed visual feature vectors constructs the final feature vector for deriving classification models. Feature vector may include a number of irrelevant and unhelpful features which on the one side increase the overall model complexity and on the other side reduce the accuracy. The dimensionality-reduction process can help to simplify the model and increase efficiency. According to this, the effect of reducing the feature vectors dimension on final model performance is examined by applying the various dimensionality-reduction techniques. The last step is classification which assigns the observation, i.e., features of a collection of data to a predefined category. In this study, various types of classification techniques are utilized in two general categories, namely individual and ensemble models. The ensemble learning methods operate based on this principle that combining the predictions of a group of classifiers is often better than individual models. Accordingly, a series of base learner is constructed and then combined in various ways, such as voting and weighted averaging with the aim of improving accuracy and reducing the error rate.
4 Proposed visual feature extraction method
Feature extraction process has a vital role in the emotion recognition system. The features extracted in this study are divided into two different modalities including audio and visual features. Figure 2 illustrates the different steps of audio and visual feature extraction path for constructing final feature vector as a main part of multimodal emotion recognition.

Proposed audio-visual feature extraction method for emotion recognition system
The facial features extraction methods can be grouped as (1) geometric features which study the sensitive region on the face such as the eyebrows, mouth and lips to detect emotion. Distances between facial landmarks, angles and the shape of specific region on the face are the examples of this category and (2) appearance-based features that represent the change in the texture of the expressive face such as wrinkles and furrows (Valstar et al. 2015). However, the main challenge in this case is robustness of proposed methods against environmental conditions and individual changes due to complexity of the face anatomy. In this study, a new approach for visual feature extraction is proposed which recognizes face emotion by analysis of displacement signal of the individual landmarks. Accordingly, the displacement of landmarks across consecutive frames of an utterance is utilized for visual feature extraction. The main reason is that the variations in position of the specific landmarks are different for various emotions. Consequently, the generated displacement time series will be different and can be used as raw data for feature extraction. Considering the movement variations of landmarks as a time series allows us to apply different signal transforms with the aim of feature extraction. For example, as a well-known tool in signal processing applications, the discrete wavelet transform (DWT) can be used. After explaining the main idea of proposed method, we describe various steps of proposed visual feature extraction method in the following as shown with red path in Fig. 2.
-
(a)
Facial landmark detection/marking and tracking
The proposed method is based on the displacement analysis of facial landmark analysis; hence, it is important to select appropriate landmarks for feature extraction. In the case of SAVEE dataset (Jackson and Haq 2014), the actors face was marked with 65 blue landmarks on forehead, eyebrows, cheeks, lips and jaw as shown in Fig. 3. In order to address the importance of each face region in proposed visual extraction method, the face is divided into three regions: (1) The upper region includes markers above the eyes in the forehead and eyebrow, (2) the middle region covers the cheek area and nose, and (3) the lower region of the face contains markers below the upper lip, including the lips, chin and jaw. This segmentation is slightly different from what is worked in (Haq et al. 2008).
Fig. 3 
Face marking process with various emotions (from left to right: angry, happiness, sadness and neutral)—SAVEE
To the best of our knowledge, the SAVEE database is the only free emotional database that uses facial markers. So, we utilize the OPENFACE (Baltrušaitis et al. 2016) as an open source facial behavior analysis toolkit to validate the results of our visual approach. It includes some state-of-arts algorithms including facial landmark detection, head pose tracking, eye gaze and facial action unit estimation. In this study, we utilize the output of OPENFACE landmark detection module to extract 68 landmarks as input of the proposed visual feature extraction model (Fig. 4).
Fig. 4 
Facial landmark markup
Figure 5 (original image and plotted version in neutral state) and Table 3 show the characteristics of each region including the subregions and the number of landmarks in the case of SAVEE database. It should be noted that the marker on the bridge of the nose (inside a black circle in Fig. 5) is used as the reference. As described in (Haq and Jackson 2010), after recording utterances, markers are manually labeled for the first frame of a sequence and then tracked for the remaining frames using a marker tracker. The details of marker tracker are described in (Haq and Jackson 2010; Jackson and Haq 2014).
Fig. 5 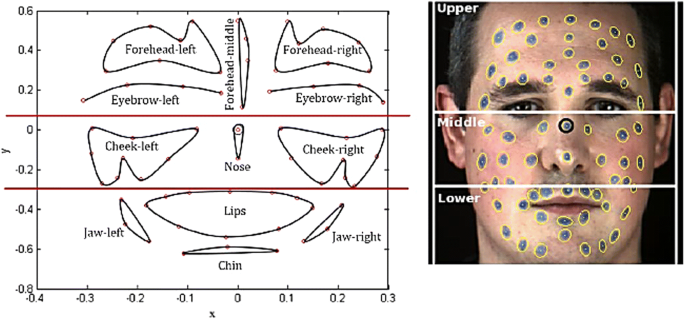
Characteristics of each region on the face—SAVEE
Table 3 Number of landmarks for each region—SAVEE -
(b)
Constructing the displacement signals of landmarks
The displacement signal of a landmark can be considered as raw data for the proposed visual extraction method. This signal is generated based on the variations of the landmark’s position across consecutive frames. Assuming that each landmark is defined as (x, y) in two-dimensional coordinates, and hence, two different signals are generated, one for the displacement of the landmark along the horizontal axis and the second along the vertical axis. Therefore, the total number of the signals will be 2 × np where np is the number of landmarks. Figure 6 illustrates the displacement signals for reference landmark on nose in six principal emotional states including anger, disgust, fear, happiness, sadness and surprise.
Fig. 6 
Displacement signals for reference landmark on the nose for a specific actor in six principal emotional states—SAVEE
-
(c)
Applying wavelet transform
Applying the mathematic signal transform reveals hidden information of original signal. In this study, the discrete wavelet transform (DWT) (Fugal 2009) is utilized to extract visual features. In this regard, the DWT coefficients, i.e., approximation and details are employed. These coefficients can be calculated by using fast wavelet transform algorithm which decomposes a signal into different sub-bands by a series of high and low pass filters with various cutoff frequencies. The output of each low pass filter is filtered again for further decomposition. Figure 7 depicts an example of the 3-level DWT sub-band output of a specific landmark for two different emotions (anger and disgust).
Fig. 7 
An example of the DWT sub-bands output of a specific landmark for two different emotions—SAVEE
-
(d)
Calculating statistical parameters
In this stage, the output of discrete wavelet transform including approximation and detail coefficients at different levels is utilized to form the final feature vector. However, due to the large number of the sub-band coefficients, statistical parameters such as mean and standard deviation are used instead of all coefficients.
-
(e)
Constructing the feature vector
In the final stage, the overall feature vector is constructed based on the mean and standard deviation values of the different sub-band coefficients. For this, all signals associated with landmarks of the face are used. Also, the mean and standard deviation of original signal are used in this study. If n and m are the number of landmarks on the face and output vectors of DWT for different levels, respectively, the size of the final feature vector will be α × [(n × P × m) + R] where the α and P parameters are the number of dimensions and the number of statistical parameters, respectively. Also, the R is the number of features extracted from the original signal.
In the case of audio modality (blue path in Fig. 2), in addition to the prosodic features, i.e., energy and ZCR, three spectral and cepstral feature types are also extracted, namely mel-frequency cepstrum coefficients (MFCC), perceptual linear predictive (PLP), linear prediction coding (LPC) and also first and second temporal derivatives of features. The MFCC approximates the frequency response of human auditory system and utilizes a nonlinear frequency scale, namely mel frequency to approximate the sensitivity of the human auditory system (Gupta et al. 2013). The PLP models the speech based on the three human psychophysics of hearing concepts which are the critical-band spectral resolution, equal loudness curve, and intensity loudness power law (Hermansky 1990). This method warps the spectrum based on the Bark scale unlike the MFCC. At last, the LPC approximates speech generation process as excitation source passing through a linear filter. It considers the vocal tract as an all-pole model due to the sensitivity of human auditory system to poles (Vaseghi 2008).


5 System setup and experimental results
This section explains the different experiments which are performed in the various conditions. More of simulation process includes the preparation of training and testing datasets, separating audio from utterance, audio-visual feature extraction and feature vectors fusion is performed by MATLAB. In order to apply different classification methods and also compare the performance of different models, Weka tool is used. It is a Java-based open source software which includes various implementations of machine learning algorithms. The performance of classification models is compared in two different conditions, before and after applying dimensionality-reduction methods, by some experiments. This is conducted after the fusion step.
The visual features are extracted using the proposed method in two stages. Assuming the number of marked 65-landmarks on the face, at first the number of 130 displacement signals for x-axis and y-axis is produced. Then by using 3-level discrete wavelet transform, sub-bands coefficients (cD1, cD2, cD3 and cA3) are extracted. The mean and standard deviation of DWT coefficients and also the original signal are used to form the final feature vectors. For each displacement signal, corresponding to a landmark, the number of 10 = 2 + 4 × 2 features is extracted. As a result, according to the total number of landmarks on the face, the size of final feature vector will be 1300 = 10 × 2 × 65. The original video database contains 480 different samples in different emotional states; hence, the original dataset will be 480 × 1301 with considering the class column. For model validation, tenfold cross-validation method is used. As mentioned earlier, the audio features vector includes three different types of LLDs consisting of energy (1), ZCR (1), MFCC (12), LPC (12), RASTA-PLP (13) as well as the first and second temporal derivatives. The length of each frame is 20 ms which is obtained thorough using Hamming window with an overlap of 25%. Finally, the audio feature vector has been achieved using mean and standard deviation coefficients of all speech frames. So, the final size of feature vector will be 2 + 2 + 24 + 24 + 3 * 26 = 130.
In the following, we describe the various experiments that have been performed on the basis of the proposed visual feature extraction method. The experiments were conducted in two general cases. In the first case, there is no fusion between visual and audio features and the performance of models is analyzed individually according to each category of features. In the second case, the effect of audio and visual features fusion is examined. It should be noted that all experiments are repeated twice by applying dimensionality-reduction algorithms to remove irrelevant features and reduce the complexity of derived models. Also, the model performance is measured based on the total accuracy, that is, the proportion of the number of samples correctly classified among the total number of samples.
In the first case, the audio and visual features have been used individually to develop models either with or without applying dimensionality-reduction techniques. In order to reduce feature vector dimension, five different techniques implemented in Weka tool (Hall et al. 2009) are used which are based on correlation subset selection method. These are best first (BF), genetic search (GS), linear forward selection (LFS) and particle swarm optimization (PSO). Also, the Naïve Bayes (NB), fuzzy rough neural network (FRNN), sequential minimal optimization (SMO), bagging (BG) and random forest (RF) are utilized as state-of-art classifiers to learn each feature vector. Table 4 depicts the results of applying dimension reduction techniques for audio and visual extracted features. As shown, the most reduction of feature size is related to LFS and BF with more than 90% reduction for both types of features. After feature reduction, the five classification methods which are also implemented in Weka are employed to develop final emotion recognition models. Tables 5 and 6 illustrate the performance of classification models in terms of accuracy for both modalities in two general cases, using primary and reduced version of feature vector.
By comparing results shown in Tables 5 and 6, it would be clear that the proposed visual features extraction method yields significantly higher accurate models comparing with audio features. In the case of audio features, the SMO method outperforms other methods. By applying the dimensionality-reduction algorithms, the performance of SMO method has been reduced. The results of RF method have not changed much but the performances of NB and bagging have improved in most cases. In the case of proposed visual features, the FRNN method is better than the other methods before and after applying dimensionality-reduction techniques. Among all reduction methods, the results of GS show the best performance. However, the results of LFS and BF algorithm are close to GS though they are less than the number of selected features. Albeit the BF and LFS algorithms reduce the size of the feature vector but do not have a negative effect on the overall accuracy of classifier models. Accordingly, it can be concluded that the most additional and irrelevant features (more than 90%) have been eliminated by the above-reduction techniques. Furthermore, as regards the effect of audio feature-level fusion on performance, we compare the emotion recognition rate of audio features in two overall cases: individually and fused features. As shown in Fig. 8, the fusion of audio features including MFCC, LPC and PLP increases the performance of the model in comparison with using each feature individually.

Comparison of emotion recognition rate of audio features: individually and fused version—SAVEE
In order to address this issue in more detail, in the following we explore the specifications of selected features by each reduction technique in more detail. As mentioned earlier, the proposed visual method is a wavelet-based method which employs the mean and standard deviation of original movement signal and also DWT sub-bands coefficients to form the feature vector. We aim to determine the most selected features, especially the important DWT sub-bands and consequently the most momentous landmarks on the face for proposed visual feature extraction method. Table 7 illustrates the number of each type of selected features with regard to the number of landmarks. In the following table, for example in the column of BF the “signal-std = 12” means that 12 out of 73 selected features are the standard deviation (std) of landmarks original displacement signal. Similarly, in the column of linear forward selection the “cD1-mean = 1” means that only 1 out of 51 of the selected features is the mean parameter of cD1 coefficients.
As shown in the above table, the features related to original movement signals including both mean and standard deviation of signal cover a significant percentage of total selected features in all dimensionality-reduction methods. Hence it can be concluded that the displacement signal of landmarks itself has a significant role in emotion recognition process. Regarding the sub-bands features, results show when we move down toward lower levels, the statistical parameters of coefficients, especially standard deviation, become more important. In this way, approximate coefficients are more valuable in comparison with details coefficients.
In the following, we investigate which landmarks have been selected by each dimensionality-reduction technique and which area the landmarks belong to. It is necessary to mention again that totally 20 features are extracted from each 2D landmark, 10 features for horizontal displacement (x-axis) and the same number for vertical displacement (y-axis). Table 8 depicts the number of selected landmarks for each area (upper, middle and lower) and also the percentage of selected landmarks in that area. In this way, two different strategies are specified. The OR strategy means that the criterion of selecting landmark is the presence of at least one feature of that landmark in the final feature vector, whereas for MORE strategy the condition for selecting landmark is the presence of more than one feature of the given landmark in the final feature vector. As shown in Table 8, a greater percentage of the upper area has been selected in both landmark selection strategies. Figure 9 depicts the graphical view of selected landmarks in both cases. In this figure, we connect the selected landmark according to face segmentation which is discussed in Sect. 4. Also, the details of selected landmarks with respect to each subregion are shown in Table 9. As it is clear from the figure, in the case of BF almost all of the landmarks related to lips, left cheek, eyebrows and also a considerable part of the right side of the forehead have been selected by OR strategy. Also, a significant number of landmarks of the eyebrows and the right side of the forehead are also selected via MORE strategy. As it is clear, the MORE strategy has a stricter manner in the selection of landmarks compared with OR strategy. Hence, it can be concluded that eyebrows and forehead are important areas in the emotion recognition process with regard to the proposed visual feature extraction method. For further investigation and verifying the obtained results, these experiments have been repeated in the case of applying LFS reduction method. Figure 9 shows the position of landmarks selected by two mentioned strategies. The obtained results in this case confirm the previous results despite the fact that in this case the number of selected features is less than before. For OR strategy, lips, eyebrows, cheek and forehead are the most important areas on the face in the case of BF with 80, 75, 67 percent coverage, respectively. For LFS case, these are chin, eyebrows and lips with 67, 63, 60 percent coverage, respectively.

Position of landmarks selected by two strategies (left OR strategy, right MORE strategy)—SAVEE
Assuming that the important landmarks are those that have more than two selected features in final feature vector, Tables 10 and 11 specify the important landmarks and the number of selected features for both reduction techniques. Also, Fig. 10 plots the position of these landmarks on the face (green circles). As shown, in the case of BF the most important landmarks are related to eyebrows, forehead and lips with 3, 2, 2 landmarks and eyebrows and forehead with 3, 2 landmarks for LFS, respectively.

Position of important landmarks on the face using OR strategy. a Best first. b Linear forward selection—SAVEE
In order to exploit the advantages of multimodal emotion recognition systems, the fusion takes place between the audio and visual features. As previously described, applying the feature dimension reduction techniques is accomplished after the fusion step. Table 12 illustrates the specifications of the dimensionality-reduction techniques output after fusion of features. The performance of models in this case has been shown in Table 13. The results show that the fusion of audio and visual features improves the efficiency of models in more than 90% of cases. The performance improvement is more noticeable for NB, SMO and BAG in comparison with FRNN and RF. Comparing to Tables 5 and 6, it can be concluded that the fusion of audio-visual features can lead to improving the models performance.
In order to validate the obtained results of proposed method, experiments have been conducted on two other databases, namely RML and eNTERFACE05. Both two databases as well as SAVEE have a set of six principal emotions including happiness, sadness, anger, fear, surprise and disgust which make them appropriate for conducting desired experiments. A set of sample images from the RML and eNTERFACE05 databases is shown in Fig. 11.

A set of sample facial expression images from the RML (top row) and eNTERFACE05 (bottom row)
In the following, we compare the best obtained results of proposed approach with some state-of-art approaches conducted on SAVEE, RML and eNTERFACE05 databases. It should be noted that similar to SAVEE database, the best results are also achieved using FRNN classifier for two other databases. The recognition accuracy of proposed method and also comparison with other works is depicted in Tables 14, 16 and 18. We also present detailed results of our experiments in the form of confusion matrices as presented in Tables 15, 17 and 19. We can see that our proposed approach yields higher accuracy (recognition rate of 98.33%) in comparison with all approaches conducted on the SAVEE. Less work has been reported based on RML database, nonetheless, the proposed approach outperforms two out of four studied works with recognition rate of 73.12%. As shown, our work performed only slightly higher than the method proposed in Noroozi et al. (2017). In the case of eNTERFACE05 database, the proposed approach results (recognition rate of 62.80%) are better than all other approaches with exception of Seng et al. (2016).
In order to study the effect of each face region on the total accuracy, we eliminate the landmarks of a specific region on the face in the following. Also, to study the effect of each region’s landmarks on emotional states, the results are presented in the form of confusion matrices. Figures 12 and 13 depict the confusion matrices for the six principal emotions performed on the video clips of the RML and eNTERFACE05 databases by eliminating the jaw and chin, eyebrow, nose, eyes and lips. In the Figures, (–) means the elimination of landmarks of specific region. For example, (–) jaw and chin bar illustrate the results of approach method due to disregarding jaw and chin landmarks. As it is shown, ignoring the eyebrows and also jaw and chin landmarks degrades the performance of model in terms of total accuracy in comparison with others near 2 and 5%, respectively, in the eNTERFACE05 as well as 3 and 3% in the RML database. Furthermore, results show that nose has negative effect on performance and removing it will increase the total accuracy (approximately 1% in both databases). Although ignoring the eyes and lips landmarks reduces the performance of model, the degradation recognition rate is not significant in both databases.

Confusion matrices for the principal emotions after specific region landmarks elimination—RML

Confusion matrices for the principal emotions after specific region landmarks elimination—eNTERFACE05
6 Conclusion
In this paper, a system for multimodal emotion recognition is introduced. Audio features included common low-level descriptors (LLDs) including energy, zero crossing rate, MFCC, LPC, RASTA-PLP and temporal derivatives. Furthermore, as a main part of a system, a novel visual feature extraction approach is proposed which exploits the time series of temporal variations of landmarks across consecutive frames for feature extraction. To do so, discrete wavelet transform (DWT) coefficients of displacement landmarks signal are utilized to construct final feature vector. Also, with the aim of reducing the complexity of derived model and also identifying the key features, various correlation-based feature selection techniques are applied. Experimental results were conducted on three common databases, namely SAVEE, RML and eNTERFACE05. In this way, the FRNN classifier yields the best performance over all the utilized databases. The total accuracy of experiments on the databases are 98.33%, 73.12% and 62.80%, respectively, which outperform most of previously published works on the same databases and modalities. Results clearly show that the features related to original displacement signals have a significant role in emotion recognition process and cover a significant percentage of total selected features. In terms of DWT sub-bands features, results show that the DWT coefficients become more important by moving down to lower levels. In this way, approximate coefficients are more valuable in comparison with details coefficients. Moreover, the fusion of the audio and the proposed visual features causes improved performance of derived models in most cases. However, this improvement is not noticeable; hence, for future works it is better to identify more compatible audio features with the proposed visual features. In contrast to the usual geometric and appearance features, the proposed visual feature extraction method is a landmark-based approach which relies on movement analysis of landmarks across consecutive frames of an utterance. Accordingly, selecting appropriate landmarks can lead to increase in the robustness of proposed method against face changes. For future work, it is better to look for a trade-off between ease of finding versus efficiency for emotion recognition. Also, to reduce the load of computation, it may be better to select appropriate landmarks before wavelet analysis. On the other hand, the efficiency of method is very dependent on the performance of face tracker. Tracker error in specifying the 2D coordinates of landmarks across consecutive frames yields different displacement signals which lead to DWT coefficients changes.
References
Baltrušaitis T et al (2016) Openface: an open source facial behavior analysis toolkit. In: IEEE winter conference on applications of computer vision (WACV), 2016. IEEE
Barrett LF (1998) Discrete emotions or dimensions? The role of valence focus and arousal focus. Cogn Emot 12(4):579–599
Caridakis G. et al (2007) Multimodal emotion recognition from expressive faces, body gestures and speech. In: Artificial intelligence and innovations 2007: From theory to applications, pp 375–388
Cawley GC, Talbot NL (2010) On over-fitting in model selection and subsequent selection bias in performance evaluation. J Mach Learn Res 11:2079–2107
Cevikalp H, Triggs B (2013) Hyperdisk based large margin classifier. Pattern Recognit 46(6):1523–1531
Chakraborty C, Talukdar P (2016) Issues and limitations of HMM in speech processing: a survey. Int J Comput Appl 141(7):13–17
Chao L et al (2016) Audio visual emotion recognition with temporal alignment and perception attention. arXiv preprint arXiv:1603.08321
Cid F et al (2015) A novel multimodal emotion recognition approach for affective human robot interaction’. In: Proceedings of FinE, pp 1–9
Colombetti G (2009) From affect programs to dynamical discrete emotions. Philos Psychol 22(4):407–425
Datcu D, Rothkrantz L (2009) Multimodal recognition of emotions in car environments. DCI&I 2009
Datcu D, Rothkrantz L (2014) Semantic audio-visual data fusion for automatic emotion recognition. In: Emotion recognition: a pattern analysis approach, pp 411–435
Degirmenci A (2014) Introduction to hidden Markov models. Harvard University. http://scholar.harvard.edu/files/adegirmenci/files/hmm_adegirmenci_2014.pdf. Accessed 10 Oct 2016
Dobrišek S et al (2013) Towards efficient multi-modal emotion recognition. Int J Adv Rob Syst 10(1):53
Ekman P et al (2013) Emotion in the human face: Guidelines for research and an integration of findings. Elsevier, New York
Fadil C et al (2015) Multimodal emotion recognition using deep networks. In: VI Latin American congress on biomedical engineering CLAIB 2014, Paraná, Argentina 29–31 October 2014. Springer, Berlin
Fugal DL (2009) Conceptual wavelets in digital signal processing: an in-depth, practical approach for the non-mathematician, Space & Signals Technical Pub
Gera A, Bhattacharya A (2014) Emotion recognition from audio and visual data using f-score based fusion. In: Proceedings of the 1st IKDD conference on data sciences, ACM
Ghahramani Z (2001) An introduction to hidden Markov models and Bayesian networks. Int J Pattern Recognit Artif Intell 15(01):9–42
Gharavian D et al (2017) Audio-visual emotion recognition using FCBF feature selection method and particle swarm optimization for fuzzy ARTMAP neural networks. Multimed Tools Appl 76(2):2331–2352
Goodfellow I et al (2016) Deep learning. MIT Press, Cambridge
Goyal A et al (2016) A multimodal mixture-of-experts model for dynamic emotion prediction in movies. In: IEEE international conference on acoustics, speech and signal processing (ICASSP), 2016. IEEE
Guo J et al (2017) Multi-modality network with visual and geometrical information for micro emotion recognition. In: 12th IEEE international conference on automatic face & gesture recognition (FG 2017), 2017, IEEE
Gupta S et al (2013) Feature extraction using MFCC. Signal Image Process 4(4):101
Hall M et al (2009) The WEKA data mining software: an update. ACM SIGKDD Explor Newsl 11(1):10–18
Haq S, Jackson PJ (2010) Multimodal emotion recognition. In: Machine audition: principles, algorithms and systems, pp 398–423
Haq S et al (2008) Audio-visual feature selection and reduction for emotion classification. In: Proceedings of the international conference on auditory-visual speech processing (AVSP’08), Tangalooma, Australia
Haq S et al (2015) Bimodal human emotion classification in the speaker-dependent scenario. Pakistan Academy of Sciences, Islamabad, p 27
Haq S et al (2016) Audio-visual emotion classification using filter and wrapper feature selection approaches. Sindh Univ Res J-SURJ (Sci Ser) 47(1):67–72
Hermansky H (1990) Perceptual linear predictive (PLP) analysis of speech. J Acoust Soc Am 87(4):1738–1752
Hossain MS et al (2016) Audio-visual emotion recognition using big data towards 5G. Mobile Netw Appl 21(5):753–763
Huang K-C et al (2013) Learning collaborative decision-making parameters for multimodal emotion recognition. IEEE international conference on multimedia and expo (ICME), 2013. IEEE
Jackson P, Haq S (2014) Surrey audio-visual expressed emotion(SAVEE) database. University of Surrey, Guildford
Jaimes A, Sebe N (2007) Multimodal human–computer interaction: a survey. Comput Vis Image Underst 108(1):116–134
Jiang D et al (2011) Audio visual emotion recognition based on triple-stream dynamic bayesian network models. In: International conference on affective computing and intelligent interaction. Springer, Berlin
Karamizadeh S et al (2014) Advantage and drawback of support vector machine functionality. In: International conference on computer, communications, and control technology (I4CT), 2014. IEEE
Kaya H, Salah AA (2016) Combining modality-specific extreme learning machines for emotion recognition in the wild. J Multimodal User Interfaces 10(2):139–149
Kaya H et al (2017) Video-based emotion recognition in the wild using deep transfer learning and score fusion. Image Vis Comput 65:66–75
Mansoorizadeh M, Charkari NM (2010) Multimodal information fusion application to human emotion recognition from face and speech. Multimed Tools Appl 49(2):277–297
Martin O et al (2006) The enterface’05 audio-visual emotion database. In: Proceedings of the 22nd international conference on data engineering workshops, 2006. IEEE
Mou W et al (2016) Automatic recognition of emotions and membership in group videos. In: Proceedings of the IEEE conference on computer vision and pattern recognition workshops
Noroozi F et al (2017) Audio-visual emotion recognition in video clips. IEEE Trans Affect Comput. https://doi.org/10.1109/TAFFC.2017.2713783
Oatley K, Johnson-Laird PN (1987) Towards a cognitive theory of emotions. Cogn Emot 1(1):29–50
Paleari M et al (2010) Towards multimodal emotion recognition: a new approach. In: Proceedings of the ACM international conference on image and video retrieval. ACM
Patwardhan A, Knapp G (2016) Multimodal Affect Recognition using Kinect. arXiv preprint arXiv:1607.02652
Plutchik R (1980) A general psychoevolutionary theory of emotion. Theor Emot 1(3–31):4
Poria S et al (2016) Convolutional MKL based multimodal emotion recognition and sentiment analysis. In: IEEE 16th International conference on data mining (ICDM), 2016. IEEE
Poria S et al (2017) A review of affective computing: from unimodal analysis to multimodal fusion. Inf Fus 37:98–125
Reynolds D (2015) Gaussian mixture models. In: Encyclopedia of biometrics, pp 827–832
Rifkin R et al (2003) Advances in learning theory: methods, models and applications, eds. suykens, horvath, basu, micchelli, and vandewalle, ser. In: NATO science series III: computer and systems sciences, vol 190. IOS Press, Amsterdam
Sebe N et al (2005) Multimodal emotion recognition. Handb Pattern Recognit Comput Vis 4:387–419
Seng K et al (2016) A combined rule-based and machine learning audio-visual emotion recognition approach. IEEE Trans Affect Comput 9(1):3–13
Soleymani M et al (2017) A survey of multimodal sentiment analysis. Image Vis Comput 65:3–14
Štruc V, Mihelic F (2010) Multi-modal emotion recognition using canonical correlations and acoustic features. In: 20th International conference on pattern recognition (ICPR), 2010. IEEE
Subramaniam A et al (2016) Bi-modal first impressions recognition using temporally ordered deep audio and stochastic visual features. In: Computer vision–ECCV 2016 workshops. Springer, Berlin
Tao J, Tan T (2005) Affective computing: a review. In: International conference on affective computing and intelligent interaction. Springer, Berlin
Tzirakis P et al (2017) End-to-end multimodal emotion recognition using deep neural networks. IEEE J Sel Top Signal Process 11(8):1301–1309
Valstar MF et al (2015) Fera 2015-second facial expression recognition and analysis challenge. In: 11th IEEE international conference and workshops on automatic face and gesture recognition (FG), 2015. IEEE
Vaseghi SV (2008) Advanced digital signal processing and noise reduction. Wiley, New York
Walecki R et al (2015) Variable-state latent conditional random fields for facial expression recognition and action unit detection. In: 11th IEEE International conference and workshops on automatic face and gesture recognition (FG), 2015. IEEE
Wang Y, Guan L (2008) Recognizing human emotional state from audiovisual signals. IEEE Trans Multimed 10(5):936–946
Wang Y et al (2012) Kernel cross-modal factor analysis for information fusion with application to bimodal emotion recognition. IEEE Trans Multimed 14(3):597–607
Xie Z et al (2015) A new audiovisual emotion recognition system using entropy-estimation-based multimodal information fusion. IEEE International symposium on circuits and systems (ISCAS), 2015. IEEE
You Q et al (2016) Cross-modality consistent regression for joint visual-textual sentiment analysis of social multimedia. In: Proceedings of the 9th ACM international conference on web search and data mining. ACM
Yu D, Deng L (2016) Automatic speech recognition. Springer, Berlin
Zhalehpour S et al (2014) Multimodal emotion recognition with automatic peak frame selection. In: Proceedings of the IEEE international symposium on innovations in intelligent systems and applications (INISTA), 2014. IEEE
Acknowledgment
The authors gratefully acknowledge the financial support provided by Institute of Science and High Technology and Environmental Sciences, Graduate University of Advanced Technology, Kerman, Iran, under Contract Number 3165.
Author information
Authors and Affiliations
Corresponding author
Rights and permissions
About this article

Cite this article
Rahdari, F., Rashedi, E. & Eftekhari, M. A Multimodal Emotion Recognition System Using Facial Landmark Analysis. Iran J Sci Technol Trans Electr Eng 43 (Suppl 1), 171–189 (2019). https://doi.org/10.1007/s40998-018-0142-9
Received:
Accepted:
Published:
Issue Date:
DOI: https://doi.org/10.1007/s40998-018-0142-9