
Abstract
This study developed a platform, entitled Parent–Teacher-Ark, to support parental engagement in their children’s education, and investigated parents’ online behaviors and perceptions in the platform. This platform consisted of the home–school communication bulletin, the parent–teacher forum, the online parental learning courses (OPC), and the multiple e-Portfolio (MeP) in order to explore the potential of digital technology for helping parents and teachers co-work more closely. This study was conducted in a digital school, in which more than 90% of parents prepared tablet PCs for their children. There were 653 parents of the first to third graders participating this study, which aimed to investigate parents’ using behaviors, perception and thoughts by system records, questionnaires, and interviews. The results indicated that the participations of the parents gradually increased and they had positive perceptions toward OPC, and MeP (in particular, learning traffic signals and visualized learning profile). The results suggested that most parents thought that the Parent–Teacher-Ark platform may help them increase their educational knowledge and understand children’s learning.
Introduction
Parent involving child’s education could be considered as great influence on the academic achievements of children (Hoover-Dempsey and Sandler 1997; Izzo et al. 1999; Fan and Chen 2001; Hughes et al. 2013). In recent years, policy makers, educators, and researchers gradually paid attention to the relationship between the families and schools. Previous research indicated that there is a strong positive relation between parental involvement and expectations on children’s education and children’s academic achievement, especially for the first-grade students at elementary schools (Fan and Chen 2001; Hughes et al. 2013).
Besides, the communication between parents and teachers may also affect students’ achievement. Specifically, four factors have been identified: the frequency of parent–teacher contact, the quality of the parent–teacher interactions, parents’ participation in educational activities at home, and parents’ participation in school activities (Izzo et al. 1999). For promoting parents to participate in school activities, the governments of many countries have been established several official agencies to build up the links among parents, teachers, and school administrators, such as Parent–Teacher Association in USA (http://www.pta.org/), Parent–Teacher Association in the United Kingdom (http://www.pta.org.uk/), and Parents and Citizens’ Associations in Australia (http://www.pandc.org.au/).
However, not every parent can totally participate in children’s learning because of the following four reasons (Hollingworth et al. 2009). (1) Time: parents usually do not have sufficient time to join all school activities; (2) education level: some parents lack literacy ability to teach children’s homework or to have educational communication with teachers; (3) sociocultural experience: most parents lack the experience of home education and the interaction between home and schools; (4) cynicism: some parents do not believe that they can assist children’s learning and think it is teachers’ responsibility.
Fortunately, digital technology has the potential to facilitate parent–teacher communication (Hollingworth et al. 2009). Furthermore, digital technology may strengthen not only the role of parents in school education, but also the relation between parents and children at home. Hence, many researchers have explored how to use digital technology to assist parents to join children’s learning. For example, to connect home, school, and community, a four-year study found that most schools adopted technology with the strategies of providing updated information and opening school visits (Hohlfeld et al. 2010). The study further indicated that increasing the participation of home members in school activities could help students learn better.
On the other hand, research also showed that parents hold positive view toward education platforms, which could support their participation in children’s education, because they wanted to understand children’s learning progress (Selwyn et al. 2011). In a sense, technology, providing instant access and interactive resources, may facilitate parents’ active participation (Lewin and Luckin 2010). However, previous studies still lack sufficient and effective connection between home and schools, perhaps because they overlook the integration of students’ learning performance, including quantitative and qualitative digital data from multiple learning activities. They also lack long-term practices supported by longitudinal and latitudinal research. In this vein, parents’ needs cannot be truly satisfied.
For these reasons, this study aims at establishing a digital learning system called Parent–Teacher-Ark for a digital school project, which has been conducted for three years. The project provides the curricula of technology-enhanced mathematics, reading and writing for a primary school in northern Taiwan (Chen et al. 2012; Liao et al. 2013, 2016; Chang et al. 2016; Chan et al. in press). In this project, which supported the notion of Bring Your Own Device (BYOD) (Maher and Twining 2016), more than 90% of the parents prepared Tablet PCs for their children so that they can learn seamlessly in the school and at home. By doing so, children’s learning data can be collected and analyzed for parents and teachers so that both of them can participate in children’s education through the system. It is also expected that the system can further improve the interaction and relationship between parents and children.
Parent–Teacher-Ark
For increasing parents’ active and sustainable participation in students’ learning, Parent–Teacher-Ark adopts two design strategies from Hoover-Dempsey et al. (2005), which originally aim at enhancing parents’ positive beliefs, confidence, and perceptions. Table 1 shows the adapted version of the strategies and corresponding functions in Parent–Teacher-Ark. The two strategies are bidirectional endeavors between school and parents, suggesting that both parents and teachers should collaborate and share the same concept about education. Besides, parents and teachers should also establish online communities for mutual understanding.
The first strategy is to increase schools’ capacities for inviting parental involvement. Therefore, this study develops home-school communication bulletin (HSCB) and parent–teacher forum (PTF) in Parent–Teacher-Ark. HSCB provides parents information about school activities, which parents can participate in with children, while PTF creates online communities to facilitate the interaction and understanding between parents and schools.
HSCB
Allows schools to announce forthcoming activities and invite parents to participate in school activities (Hollingworth et al. 2009). In a sense, the bulletin connects parents and schools in addition to conventional channels, such as communication books. By doing so, parents can more easily know what activities schools will plan for children’s benefits. In fact, these parent-centered activities are not only a part of school education, but also an extension of family education (Izzo et al. 1999). In this project, for example, the digital school has organized several academic speeches to enable parents to learn the latest educational knowledge and discussion meetings to communicate with parents face to face. By understanding parents’ concerns, schools can further provide them with appropriate assistance.
PTF
Establishes collaboration groups of parents, teachers, and school administrators so that they can build mutual understanding and share their educational experiences, such as teaching and parenting methods. The forum not only bridges schools, teachers, and parents, but also provides parents with a learning space for interaction and discussion. Since the project conducted a new form of education, parents might meet difficulties in practice. Through PTF, teachers and other parents can help them tackle the mutual problems. In a sense, parents and teachers form online communities, where members support one another. By doing so, schools are able to communicate with parents all the time.
The second strategy is to increase parents’ capacities for effective involvement in children’s education. Schools should not only arouse parents’ awareness in children’s education, but also enable them to access children’s learning data. For these reasons, the study developed online parental courses (OPC) and multiple e-portfolios (MeP). OPC provides learning materials about educational concepts that parents should know, while MeP allows parents to understand children’s formative and summative performance in their portfolios in digital schools.
OPC
Encourages parents to understand educational concepts, in particular, how their behaviors may affect children’s learning and how they use this system to help children. The courses, which adopted the design of massive open online courses (MOOCs; Daniel, 2012), comprise video clips, articles, and quizzes as learning materials. For every parent, OPC lists his/her enrolled courses and shows the completeness. Such design facilitates parents’ sense of commitment, so that they may attach importance to the courses. Furthermore, every online course is consisted of several mini-lessons (Fig. 1), and every mini-lesson provides a 5-min video clip and several quizzes. Besides, OPC also provides a reward and badge mechanism for facilitating their completion rates, so that parents can develop their sense of participation and achievement (Yuan and Powell 2013).

Online parental learning courses
MeP
Provides parents various indicators which present children’s summative and formative performance from their quantitative and qualitative data of all learning activities in digital schools. The information may facilitate parents’ understanding children’s learning progress, strength, and weakness. Furthermore, MeP includes four functions—learning traffic signals, visualization learning profiles, learning portfolio summaries, and learning work portfolios.
-
(1)
Learning traffic signals provide instant information about how children perform in every indicator currently. Furthermore, green, yellow, and red color each presented increased, stable, and decreased performance, respectively, compared with their individual past performance. More specifically, if students’ current performance is lower than 1σ (i.e., one standard derivation) of the average in the past, red signal is shown to inform parents to pay more attention to their children. If it is between 1σ and average, yellow signal is shown to suggest that the performance is stable. If it is higher than average of the past, green signal is shown to inform parents to encourage their children.
-
(2)
Visualization learning profiles provide children’s formative and longitudinal performance in every quantitative indicator (Fig. 2). Furthermore, the function shows monthly reports, in which the indicators are visualized in every week. By doing so, parents can clearly understand children’s actual performance, and easily find out the trends and dynamics of performance. If necessary, parents can help children adjust their weekly learning goals.
Fig. 2 
Visualization learning profiles
-
(3)
Learning work portfolios collects children’s electronic works and other qualitative data, such as their problem solving processes, the list of read books, writings, and drawing (Fig. 3). The portfolios can also be viewed as a form of formative data which helps parents further understand children’s learning in a way that statistics cannot provide. More importantly, it reveals children’s mind by interpreting the meaning of their works.
Fig. 3 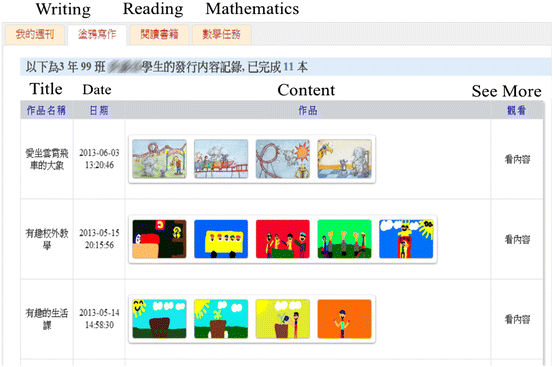
Learning work portfolios
-
(4)
Learning portfolio summaries include summative performance of every indicator with comments and suggestions according to the statistical model in the end of current semester, compared with normal distribution of the same graders. Depending on the type of each indicator, the performance can be shown as an average (e.g., the scores of mathematical homework) or accumulation (e.g., the number of read books). Unlike in traditional paper-based transcripts, children’s grades are not represented as single scores. Instead, parents can identify children’s strengths and weaknesses through statistics, comments, and suggestions about all indicators.


Method
Research questions
Although Parent–Teacher-Ark was designed based on the two strategies for active and sustainable participation of parents, it was still unclear how the parents in the project would react to the system behaviorally and psychologically. Hence, there were two research questions that needed to be answered in this study.
-
(1)
How often do the parents of different graders use the modules and functions of Parent–Teacher-Ark, especially during the first three months after the system implementing?
-
(2)
How do the parents perceive the modules of Parent–Teacher-Ark, particularly online parental courses and multiple e-portfolios?
Participants
Since this project had been conducted for three years, the parents of the first to third graders, from 24 classes in the digital school, participated in this study. All parents were from the same neighborhood region. Specifically, there were 217, 229, and 207 accounts for the parents of the first, second, and third graders, respectively (both parents shared an account). Over 90% parents’ ages ranged from 37 to 42; over 70% parents’ educational level was university. Besides, school region SES (social and economic status) showed by household average income were NT dollars 961,998; in the same year, Taiwan household average income were NT dollars 1,157,895. Furthermore, because the third graders had used technology-enhanced curricula for three years (the second graders for two years, and so on), the parents of the third graders had longer experience than the other two graders.
Procedure
Parent–Teacher-Ark was implemented in the second semester of the third year of the project. Before the parents started using the system, the researchers carried out four batches of seminars so that most parents could know why and how to use the system in advance. Besides, the parents of the third graders were allowed to use the system one month earlier than the other parents. Specifically, they started to use Parent–Teacher-Ark in April, while the other parents started in May. For the first research question, all parents’ online behaviors were automatically recorded in the system until the end of semester in June. For the second research question, a questionnaire and interviews were carried out in later June. The details of instruments are described in the next section.
Data collection and analysis
Parents’ online actions records
Parents’ online actions in Parent–Teacher-Ark were collected by combining two methods: Google Analytics and system logs. Furthermore, Google Analytics were adopted to analyze web traffic data for investigating parents’ process of usage, including frequency, time, and hit pages. However, due to the policy and limitation of Google Analytics, system logs were also used to discriminate the parents’ actions of different graders in all modules and functions. There were 22,736 actions collected from the Parent–Teacher-Ark. Furthermore, there were 409 actions from 55 parents of the third graders in April, 9376 actions from 195 parents in May, and 12951 actions from 243 parents in June. The data were analyzed with a χ 2 test for participation rates among of the three graders’ parents in the three months and the three grades, and one-way analysis of variance (ANOVA) for average frequencies among of these parents of in the three months and the three graders.
Parents’ system perception questionnaire (PSPQ)
The authors developed that the PSPQ was divided into five aspects to investigate parents’ perception on using OPC and the four functions of MeP (learning traffic signals, visualized learning profile, learning work portfolios, and learning portfolio summaries). Items of the PSPQ were developed from previous studies such as Hoover-Dempsey et al. (2005) and all items were rated on a 5-point Likert scale ranging from “totally disagree” to “totally agree.”
To assess the consistency of the PSPQ, the factor structure was analyzed by applying an exploratory factor analysis and principal component analysis. The reliability analysis was determined by measuring the internal consistency of each scale calculating the Cronbach’s alpha. The orthogonal (Varimax) method with Kaiser normalization was employed with rotation procedure. Through principal component analysis, two factors were extracted from the PSPQ explained about 57.76% of total variance: factor 1 MeP explained about 44.47% of variance (Cronbach’s alpha = 0.90); factor 2 OPC explained about 13.29% of variance (Cronbach’s alpha = 0.67). The rotated factor matrix is reported in Appendix 1. Results from exploratory factor analysis provided that all items filled the components significantly (criterion adopted: exclusion of absolute values < 0.45) and items were chosen considering their highest absolute values. These results indicate that PSPQ was considered fine along all the factors during the PTA activities. Besides, this study attempted to understand the parents’ perceptions of OPC and MeP, we accumulated each aspect (e.g., learning traffic signals from MeP) and get each composite score; then, the Kruskal–Wallis test was conducted to compare the parents’ perception from PSPQ. The level of significance was set at α = 0.05 for all comparisons. The assumptions of all statistical tests are not violated. The data obtained were analyzed using the SSPS program package.
Parent’s interview
To understand parents’ thoughts of using Parent–Teacher-Ark deeply, we finally interview 12 parents (denoted by P1–P12) who were chosen by two criterions: children’s grade and the frequency of system usage. For each grade, there were 4 parents who were invited and agreed to attend interviews. Among them, half parents were the users who frequently used the platform, and half were not. Each parent was interviewed 2 or 3 times and each time took 30–40 min. The authors developed a semi-open-ended protocol to facilitate the participants’ thinking without influencing what they said (Taylor and Bogdan 1998b). The questions in the interview were derived from the study of Hoover-Dempsey et al. (2005), and Hollingworth et al. (2009), see Appendix 2.
We conducted coding and analysis by verbatim which were typed with the records. During data analysis, statements or meaning units that emerged as possible commonalities from the protocol and notes were coded. We then refined these themes by removing overlaps and capturing the main thrust of each theme’s meaning (Taylor and Bogdan 1998a). General themes or patterns that emerged through this data coding process were synthesized, such as Online Courses, Multiple e-Portfolio, and so on.
Findings
Distribution of parents’ participations in Parent–Teacher-Ark
Figure 4a shows that the general trend of parents’ participation from 55 (25.34%) to 195 (29.86%) and 243 (37.21%) was stably increasing in terms of the number of participants and frequencies. In particular, there were 7.44, 48.08, and 53.30 actions per parent in April, May, and June, respectively. A χ 2 test was conducted to compare the participation rates among the three months. The result indicated significant statistical difference among months (\( \chi_{(2)}^{2} \) = 8.71, p < 0.5). Moreover, a one-way ANOVA showed significant statistical difference (F (2,393) = 9.23, p < .05, partial η 2 = 0.091) in the average frequencies among these parents of the three months. Post hoc analysis showed that the parents in May and June participated more often than those in April, but there was no significant difference between the May and June.

The distribution of parents’ participations and average frequencies in Parent–Teacher-Ark
Figure 4b shows that there were 396 parents who used the platform during the period, including 145 (66.82%), 133 (58.08%), and 118 (57.00%) parents from the first to third graders, respectively. A χ 2 test was conducted to compare the participation rates among the three grades. The result indicated no significant statistical difference among grades (χ 2 = 2.77, p = .250 > 0.5). Although the participation rates are similar, different behaviors might still occur. The average frequencies form first graders to third graders were 72.24, 57.37, and 39.27 actions. A one-way ANOVA showed significant statistical difference (F (2, 393) = 5.23, p < .05, partial η 2 = 0.053) in the average frequencies among these parents of the three graders. Post hoc analysis showed that the parents of the first graders participated more often than those of the third grader, but there was no significant difference between the other two groups. These findings showed that the parents used Parent–Teacher-Ark more and more (e.g., the parents of the first graders), suggesting that the platform may potentially support the engagement of parents in their children’s education.
Besides, this study further presents how the parents use the platforms during the three months in terms of the four modules and their functions. The result shows that although the parents seldom participate in HSCB (from 70, 856 to 988 actions) and PTF (from 15, 151 to 133 actions), they highly participated in OPC (from 153, 2619 to 4752 actions) and MeP (from 171, 5750 to 7078 actions). Thus, the parents are less involved the first two functions; the parents are more involved the last two functions. Moreover, this study also calculates the percentage of the parents’ actions about the OPC and MeP. In particular, regarding OPC, the parents were engaged in mini-lesson from 79 (19.32%), 1192 (12.71%) to 2034 (15.71%) and quizzes from 74 (18.09%), 1427 (15.22%) to 2718 (20.99%) in April, May, and June, respectively. Regarding MeP, the parents often examined their children’s learning traffic signals from 131 (32.03%), 1386 (14.78%) to 2696 (20.82%) and visualization learning profiles from 32 (7.82%), 3359 (35.83%) to 3109 (24.01%), while learning work portfolios (from 6 (1.47%), 825 (8.80%) to 1135 (8.76%) and learning portfolio summaries from 2 (0.49%), 180 (1.92%) to 138 (1.07%) were rarely used. The results suggested that these highly used modules and functions may meet parents’ needs, which may require further investigation. For understanding the parents’ perceptions and opinions in depth, we adopted questionnaire and interviews to further explore how the parents actually used and thought about Parent–Teacher-Ark, especially OPC and MeP. The results were described as 4.2 and 4.3.
Enhancing parents to participate actively in their children’s learning by online courses
Table 2 shows the parents’ perceptions of OPC and MeP. Regarding OPC, the parents of all three graders took positive perceptions. A Kruskal–Wallis test showed no significant statistical difference (\( \chi_{(2)}^{2} \) = 3.15, p = .207 > .05) in the perceptions of OPC among these three graders’ parents. The interview further revealed the parents’ experiences of using OPC. For example, a mother particularly mentioned the mechanism of virtual currency after the quizzes in OPC.
Didn’t you [the system] give us at that time, after we read some (books), didn’t (I) receive some virtual money? Well, my kid was so excited. We answered wrong; then the kid was nervous. I felt like we were playing a game together. I felt that the way to encourage (children) was novel. The kid said that ‘Mom, you had gone there [the system].’ He would check if we had gone there or not. (P1)
The mechanism was designed to encourage parents to learn more in OPC. Furthermore, they may earn money in OPC and then spend it on rewarding their children for good behaviors. Although the rewarding function may be not necessary for parents to use OPC, it did influence certain interaction behaviors between parents and children. The interview also suggested that when the reward mechanism was incorporated into MeP, the interaction between parents and children becomes closer and more intimate and their children become more positive. The reason may be that the mechanism integrated OPC and MeP. Among the parents who completed all courses, there were 27.78% parents using the reward function, and 33.33% parents using both the reward mechanism and MeP. Interestingly, the aforementioned mother also described the platform as a game and the interaction as playing. In other words, the design may not only provide parents with new educational concepts in OPC and related functions, but also potentially facilitate parents and children to work together and improve their interaction.
Helping parents understand the learning portfolio of children by multiple e-portfolio
Table 2 shows that the parents of the three graders had positive perceptions of learning traffic signals on MeP. Besides, a Kruskal–Wallis test showed no significant statistical difference (\( \chi_{(2)}^{2} \) = 2.09, p = .351 > .05) in the perceptions of learning traffic signals between these three graders’ parents. Furthermore, the interview also indicated how parents used the signals and interacted with their children. For example, a father said,
…The red signal, if (it) shows, it might enhance, I will ask him to come here, to see it ASAP. And he instead will happily, with me there, play mathematics (games). Like last night, I asked him how solve the question. He came here immediately… It seemed that he took it [practicing mathematics] as playing computers. I think it’s good. (P6)
It showed that when parents found their children’s performance had red signals, they paid more attentions on the indicator. Some parents may accompany their children to do exercises. With the supports of the platform, parents could not only know children’s learning statuses, but also face their learning problems.
Regarding visualization learning profiles, Table 2 shows that the parents had positive perceptions. Furthermore, a Kruskal–Wallis test showed no significant statistical difference (\( \chi_{(2)}^{2} \) = 1.71, p = .426 > .05) in the perceptions of visualization learning profiles among these parents of the three graders. Furthermore, the interview revealed how the visualization learning profiles help parents understand their children in detail. For example, a mother said
(The function) I used more often was to check the kid’s learning statuses…We parents were able to see where [what] his weakness was, then how his learning status was, whether (we) needed to help him. (P11)
Besides, another parent further elaborated that
I was going to see, and the statistical figures that you made I’d see, this kind of (figures) I’d see, to see at what time (his performance) was worse. And when he did learning tasks, especially mathematics, I would check whether his mathematics was okay or not. If his mathematics had high error rates, I would additionally, besides the homework in computers, I would additionally ask him why (they’re) wrong. If there were anything (he) didn’t understand …(P9)
These interviews suggested that the design of figures could help them understand their children about mathematics performance. In particular, they tended to find out the weaknesses in which indicators, and concerned when and why the children got a low performance.
Regarding learning work portfolios, Table 2 shows the parents of the three graders had positive perceptions. Besides, a Kruskal–Wallis test showed significant statistical difference (\( \chi_{(2)}^{2} \) = 5.76, p = .047 < .05) in the perceptions of learning work portfolios among these parents of the three graders. The Dunn analysis revealed that the parents of the first graders scored significantly higher than those in third grader; there was no significant difference between the other two groups. The results suggested that qualitative performance was valued more by the parents whose children were the first graders. We inferred two reasons why the parents of the third grader had lower perceptions for the learning work portfolios. Firstly, the third-grade students and parents were more familiar with the technology-enhanced curriculum than the other two graders and parents. Hence, while PTA was conducted, the parents of the third grader were less careful and more trusted PTA; secondly, the parents of the third grader were used to directly interact with their children and understand children’ performance, rather than assessing learning work portfolios on PTA.
Besides, the interview further showed that some parents check children’s learning work portfolios in their leisure time. If they were asked questions by their children or found their weaknesses, they would instruct them. For example, a father said,
When (the child was) doing homework, I would use the computer, and then check his Chinese Language, mostly check his products of drawing and writing, to see, to browse, and then check. …(P6)
In a sense, when children were doing their homework, parents were also doing their homework—to care about children. When a child finishes the homework, a parent then give advice. The asynchronous way provided parents more time to look at children’s learning statuses quickly, even if they could communicate with children. Although the interview showed that Parent–Teacher-Ark could assist parents to understand their children faster and more clearly, it was parents that cared about children’s learning. After all, the platform was just a tool.
Regarding learning portfolio summaries, Table 2 shows that the parents had positive perceptions. Besides, a Kruskal–Wallis test showed no significant statistical difference (\( \chi_{(2)}^{2} \) = 4.79, p = .091 > .05) in the perceptions of learning portfolio summaries among grades. The interview further revealed how the parents concerned students’ learning behaviors currently, compared to the previous time without the platform.
Usually previously we weren’t able to see. We wouldn’t use the kids’ their computers. At present, how is the usage? Because he had his own username and password, (I) thought, that was his personal ones. Now, (I) have a username and password of parents, (I) can go, can also enter to understand …(P8)
More specifically, before this project, although the parents wanted to know what and how their children did online, they could merely use children’s accounts to login the platform. However, as the project conducted, their doubts were clarified. In a sense, Parent–Teacher-Ark allowed parents to care about children and respect children’s right to use.
In another example, a parent had a first-grade girl within this project and a fourth-grade boy without this project. The elder brother could not learn with the support of Parent–Teacher-Ark. For this reason, this parent felt a little regretted and said,
Her learning status we wouldn’t say like her brother. He might usually have the scores or a single, it’s a single, a single test or learning, and then we just could see the single one. Then she then the sister was, besides they were repeating practices, we could also know, oh, realize which parts she…which was weak, or which parts needed improvement…(P4)
This father compared the two situations about understanding children’s performance. Compared with the elder brother, whose performance could only be acquired through paper-based summative assessments, the sister’s actual performance could be understood through both formative and summative assessments in the platform anytime. Because multiple indicators in MeP could provide clearer statistics than paper-based assessment, parents could better know the strengths and weaknesses of the children.
Discussions and implications
Enabling parents to understand
The results show that multiple e-portfolios and online parental courses are the two most frequently used modules in Parent–Teacher-Ark, suggesting that the parents need to get better understanding of children’s learning. The results about MeP show that parents value children’s learning processes, which is consistent with the finding of Selwyn et al. (2011). Among the four sub-functions, the parents used learning traffic signals and visualization learning profiles the most. The reason perhaps is that both are formative and quantitative evaluation. Furthermore, the former draw parents’ attentions to whether each indicator of their children is stable, while the latter allows parents to check and monitor each indicator longitudinally. Most importantly, both are designed to compare children’ performance with their past selves instead of peers, which may facilitate parents to concentrate on understanding the strengths and weaknesses of their children.
Besides understanding children’s learning, the results about OPC suggest that the parents are also willing to improve their understanding of the learning activities not only in the digital school but also at home. To some extent, OPC may potentially overcome parents’ difficulties that Hollingworth et al. (2009) identified, in particular, cynicism. Furthermore, with online courses, parents are able to learn new educational knowledge and strategies for their children. By doing so, their confidence in helping children in such a digital era can be strengthened. More importantly, their mindset of examination-driven learning can likely be upgraded and shifted to that of personalized learning, so that the power of digital schools can be realized in a positive way. In the end, parents may become lifelong learners just like their children, who do the same way in digital schools.
Empowering parents to participate
The interview shows that Parent–Teacher-Ark has the potential for changing parents’ roles of caring about their children. Specifically, some parents and their children may talk about not only how well they learn but also what they want to learn and how they learn. In such a new scenario, parents seem to interact more with their children, probably because multiple e-portfolios shape their belief that formative performance is much more important than summative one. In other words, parents are no longer a passive role; instead, they are empowered to take appropriate actions such as encouraging or assisting in children’s learning just in time. The result implies that providing multi-dimensional learning statuses may positively change parents’ behaviors, so that they can really help their children in the age of digital learning.
Besides the interaction with children, it is also expected that parents could have more collaboration with teachers. Although the bulletin and forum are originally designed to increase schools’ capacities for inviting parents’ participation, these two modules are used relatively few. The reason perhaps is that the two modules are not parents-centered design. However, if parents could build an online community with teachers, they may share mutual purpose and adopt consistent tutoring strategies. For this reason, it is urgent to find parents’ needs, explore feasible strategies and design new modules to improve parents’ engagement. For example, E-Homebook System incorporated several agents for facilitating communication among teachers, parents, and students (Chen et al. 2007). There are more and more educational applications considering the needs of parents (e.g., Edmodo). We shall take advantage of educational technology to engage parents to children’s learning.
Limitations
There are several limitations in this study. First of all, the participants of this study only include the parents of the first three graders in one school in Taiwan. Second, this study only focuses on the perspectives of parents without taking teachers and students into account. Third, the relationship between parents’ participation and students’ achievement is not considered as well. Although the experience from the longitudinal project is still valuable in the adoption of educational technology, these limitations may constrain the generalization and application of the findings to other contexts.
Conclusions
This study demonstrates the adoption and practice of educational technology from a new angle: parents. For facilitating parents’ engagement in children’s learning, this study established a Parent–Teacher-Ark platform and conducted a three-phase project. With the platform, parents may understand children’s learning portfolios and increase interaction with them. This study discovered parents’ high participations and positive perception toward OPC and MeP, suggesting that most parents thought the two modules may increase their educational knowledge and further understanding of children’s learning. Furthermore, these modules may help parents locate children’s strengths and weaknesses in the learning process and, more importantly, carry out appropriate tutoring.
Parents’ perspectives are usually absent in previous research on technology-enhanced learning. This study launched a longitudinal project, in which parents could participate in children’s learning. This study can also initiate a series of future research on technology-enhanced parenting. For example, as the age of lifelong learning portfolios is coming, parents need more accurate and comprehensive learning diagnosis or early warning functions by learning analytics and data mining techniques. Besides, parents also need more channels for better communicating with teachers, such as mobile applications. Additionally, parents may need more incentive mechanisms to motivate and sustain their learning in online parental courses. By taking advantages of educational technology, it is expected that parents can actively and sustainably participate in children’s learning.
References
Chan, T. W., Liao, C. C. Y., Cheng, H. N. H., Chang, W. C., & Chien, T. C. (in press). The practice and prospect of digital school. Journal of Research in Education Science (in Chinese).
Chang, W. C., Liao, C. C. Y., & Chan, T. W. (2016). Explore the effect of “Tomorrow’s Creating” activity on elementary school students: The experience from BYOD school to practical school. International Journal on Digital Learning Technology, 8(1), 25–49 (in Chinese).
Chen, H. M., Yu, C., & Chang, C. S. (2007). E-homebook system: A web-based interactive education interface. Computers & Education, 49(2), 160–175.
Chen, Z. H., Liao, C. C. Y., Cheng, H. N. H., Yeh, C. Y. C., & Chan, T. W. (2012). Influence of game quests on pupils’ enjoyment and goal-pursuing in math learning. Educational Technology & Society, 15(2), 317–327.
Daniel, J. (2012). Making sense of MOOCs: Musings in a maze of myth, paradox and possibility. Journal of Interactive Media in Education, 3, 4–24.
Fan, X., & Chen, M. (2001). Parental involvement and students’ academic achievement: A meta-analysis. Educational Psychology Review, 13(1), 1–22. doi:10.1023/A:1009048817385.
Hohlfeld, T. N., Ritzhaupt, A. D., & Barron, A. E. (2010). Connecting schools, community, and family with ICT: Four-year trends related to school level and SES of public schools in Florida. Computers & Education, 55(1), 391–405. doi:10.1016/j.compedu.2010.02.004.
Hollingworth, S., Allen, K., Kuyok, K.A., Mansaray, A. & Page A. (2009) An exploration of parents’ engagement with their children’s learning involving technologies and the impact of this in their family learning experiences. Becta, Coventry. Retrieved January 21, 2014, from http://research.becta.org.uk/index.php?section=rh&catcode=_re_mr_02&rid=17152.
Hoover-Dempsey, K. V., & Sandler, H. M. (1997). Why do parents become involved in their children’s education? Review of Educational Research, 67(1), 3–42. doi:10.3102/00346543067001003.
Hoover-Dempsey, K. V., Walker, J. M. T., Sandler, H. M., Whetsel, D., Green, C. L., Wilkins, A. S., et al. (2005). Why do parents become involved? Research findings and implications. The Elementary School Journal, 106(2), 105–130. doi:10.1086/499194.
Hughes, J. N., Kwok, O.-M., & Im, M. H. (2013). Effect of retention in first grade on parents’ educational expectations and children’s academic outcomes. American Educational Research Journal, 50(6), 1336–1359. doi:10.3102/0002831213490784.
Izzo, C. V., Weissberg, R. P., Kasprow, W. J., & Fendrich, M. (1999). A longitudinal assessment of teacher perceptions of parent involvement in children’s education and school performance. American Journal of Community Psychology, 27(6), 817–839. doi:10.1023/A:1022262625984.
Liao, C. C. Y., Chang, W. C., Chen, B. C., & Chan, T. W. (2016). Development and evaluation of interest-driven theme-based enquiry reading model. Education Journal, 44(2), 1–25 (in Chinese).
Liao, C. C. Y., Lee, Y. C., & Chan, T. W. (2013). Building a self-generated drawing environment to improve children’s performance in writing and storytelling. Research and Practice in Technology Enhanced Learning, 8(3), 449–464.
Lewin, C., & Luckin, R. (2010). Technology to support parental engagement in elementary education: Lessons learned from the UK. Computers & Education, 54(3), 749–758. doi:10.1016/j.compedu.2009.08.010.
Maher, D., & Twining, P. (2016). Bring your own device—A snapshot of two Australian primary schools. Educational Research, 4, 1–16.
Selwyn, N., Banaji, S., Hadjithoma-Garstka, C., & Clark, W. (2011). Providing a platform for parents? Exploring the nature of parental engagement with school learning platforms. Journal of Computer Assisted Learning, 27(4), 314–323. doi:10.1111/j.1365-2729.2011.00428.x.
Taylor, S. J. & Bogdan R. (1998b) In-depth interviewing. In Introduction to qualitative research methods (3th ed., pp. 87–116). New York: Wiley.
Taylor, S. J. & Bogdan R. (1998a) Working with data: data analysis in qualitative research. In Introduction to qualitative research methods (3th ed., pp. 134–164). New York: Wiley.
Yuan, L., & Powell, S. (2013). MOOCs and open education: Implications for higher education. Cetis White Paper.
Acknowledgements
The authors would like to thank the Ministry of Science and Technology of the Republic of China, Taiwan, for financial support (101-2511-S-008 -016 -MY3; 102-2811-S-008 -009), and Research Center for Science and Technology for Learning, National Central University, Taiwan.
Author information
Authors and Affiliations
Corresponding author
Appendices
Appendix 1
Rotated factor matrix for the Extraction method: principal components analysis. Rotation method: Varimax with Kaiser normalization criterion
Item | Factors | ||
|---|---|---|---|
MeP | OPC | ||
LTS1 | When I see the learning traffic signal was red, I know I need to notice my children’s learning status | .747 | |
LTS2 | I could quickly grasp my children’s learning status by the color of learning traffic signal | .781 | |
LTS3 | Through the color of the learning traffic signals, I could pay more attention on my children’s learning | .762 | |
VLP1 | It is difficult for me to judge my children’s learning performance by using charts and graphs to present their learning performancea | .642 | |
VLP2 | Using charts and graphs in visualized learning profile to present children’s learning performance is easy to understand | .665 | |
VLP3 | Using charts and graphs to present children’s learning performance could help me to understand children’s learning status more easily | .760 | |
LWP1 | It is meaningful for me to understand what children learn every day through Parent–Teacher-Ark, such what they read, what they math exercise | .730 | |
LWP2 | It is meaningful for me to watch my children’s productions, such as writing and drawing | .683 | |
LWP3 | It is important for me to free check my children’s specific learning process by Parent–Teacher-Ark | .762 | |
LPS1 | The learning portfolio summaries than the traditional paper-based transcripts, let me know more about children’s learning situation and results | .696 | |
LPS2 | It is meaningful for me to watch children’s learning performance from multiple indicator of learning portfolio summaries rather than only grade | .752 | |
LPS3 | I could more clearly know my children’s learning status from different indicators in learning portfolio summaries | .803 | |
OPC1 | Online parental learning courses could help me to understand Parent–Teacher-Ark | .791 | |
OPC2 | It didn’t take me much time to watch online parental learning courses | .545 | |
OPC3 | The content of online parental learning courses is boringa | .762 | |
Appendix 2
Parent’s interview:
-
(1)
What kind of new perspectives may the online parental courses bring you?
-
(2)
What factors may facilitate you to complete the online parental courses?
-
(3)
How did the PTA affect your interaction with your children?
-
(4)
Which modules and how they may help you understand your children’s learning status?
-
(5)
Which modules and how they may engage you in your children’s education?
-
(6)
What modules are the most important and why?
-
(7)
What modules need to be improved and why?
Rights and permissions
About this article

Cite this article
Liao, C.C.Y., Cheng, H.N.H., Chang, WC. et al. Supporting parental engagement in a BYOD (bring your own device) school. J. Comput. Educ. 4, 107–125 (2017). https://doi.org/10.1007/s40692-017-0085-6
Received:
Revised:
Accepted:
Published:
Issue Date:
DOI: https://doi.org/10.1007/s40692-017-0085-6