
Abstract
Recent studies of snow climatology show a mix of trends but a preponderance of evidence suggest an overall tendency toward decreases in several metrics of snow extremes. The analysis performed herein on maximum seasonal snow depth points to a robust negative trend in this variable for the period of winter 1960/1961–winter 2014/2015. This conclusion is applicable to North America. Maximum snow depth is also mostly decreasing for those European stations analyzed. Research studies show generally negative trends in snow cover extent and snow water equivalent across both North America and Eurasia. These results are mostly, but not fully, consistent with simple hypotheses for the effects of global warming on snow characteristics.
Introduction
Snowfall is a normal part of the cold season climate in middle and high latitudes. However, unusual amounts of snowfall have the potential to create pronounced impacts on societal function because of the unique physical properties of snow. Extreme single snowfall events or large seasonal accumulations create widespread transportation disruptions with associated impacts on economic and social activity. These can be life-threatening by creating traffic accidents and stranding travelers in harsh conditions, by roof collapses, and by avalanches.
Snowfall also has substantial benefits. The runoff from large accumulations can have substantial positive impacts in recharging reservoirs, although flooding from rapid snowmelt can pose a significant threat. Many arid areas rely on rivers flowing through them fed by snowmelt in distant mountains for water resources. The usual gradual snowmelt at mountain elevations extends the life of the snowpack well into the summer and provides a natural storage mechanism, reducing the capacity requirements for built reservoirs.
Temperature is obviously a prime determinant between the occurrence of precipitation as rain or snow at the surface, while recognizing that the properties of the atmosphere through which precipitation passes also affect the phase at the surface [1]. Variations and long-term trends in temperature can affect the nature of the local snowfall climatology and associated trends. Anthropogenically forced changes in temperature and atmospheric water vapor have the potential to have major impacts on snowfall climatology. Extreme snowfall events tend to occur just below the freezing point [2] while seasonal metrics may be affected in complex ways by temperature characteristics and weather system features. We can formulate several hypotheses that may accompany such warming [3]:
-
a.
The equatorward-margins and lower elevation limits (in mountainous terrain) of where snow is now a normal part of the cold season climate will shift poleward and upward as a result of warming temperatures and more precipitation falling as rain.
-
b.
Higher-latitude and higher-elevation locations in the interior of the continents where snow accumulation is limited by moisture availability will experience increases in both extreme and total snowfall.
It is not our intent to formally test these hypotheses, but these will form a backdrop to our discussion of recent studies.
An evaluation of the state of knowledge regarding adequacy of data for detection and attribution of causes for snow extremes [4] indicated a medium level of knowledge for both, relative to other types of extremes. Because of the small land mass in mid to high latitudes and sparse data, the Southern Hemisphere is not included in this discussion.
We first describe several major types of snow data and the sources for those data. Then, a review of recent studies is presented, organized by data type, in the following order: snow cover extent, snow depth and snow water equivalent, and snowfall. These include a few original analyses developed for this overview. Most studies do not specifically address occurrences of extremes in these variables, whether individual events or seasonal or multi-seasonal anomalies. Where possible, this information is extracted from the results in the studies.
Snow Data
Several metrics are typically used to describe the occurrence and presence of snow. From the perspective of observations at an individual station, there are three common metrics unique to snow that are typically used: snowfall (SNOW) since last observation, depth of snow on the ground (SNWD), and the melted water equivalent of the snow on the ground (SWE). These observations, typically taken at daily or sub-daily frequency, are used to develop other metrics, particularly accumulated snowfall over longer periods such as single storms, weeks, months, or seasons. The measurement of snow depth, while not trivial, is comparatively reliable although long-term trends are affected by changes in site characteristics and observational practices [5, 6]. Another common metric of snow from a regional or global perspective is the snow cover extent (SCE), determined from station observations and remote sensing data. We focus particularly on high and low extremes of snow cover extent, snowfall, and maximum seasonal snow depth.
Data for SNOW and SNWD in the studies cited and the original analyses included herein are in the Global Historical Climatology Network Daily (GHCND) data set, which incorporates observations from many national networks. For our original analyses, the criterion for choice of stations was at least 90 % available snow depth data for November 1–April 30 for 1961–2015. In addition, each year included had to have 90 % available data for November 1–April 30 of that year. Finally, stations that recorded no snow for more than 10 % of the years were excluded.
Analysis of SCE has relied on the compilation of satellite and in situ data [7, 8]. The Northern Hemisphere Snow Cover Extent Climate Data Record (NHSCE CDR) is a well-developed and commonly used data set. It is based on weekly snow cover maps produced by the U.S. National Oceanic and Atmospheric Administration (NOAA) from visible satellite imagery, including the Advanced High Resolution Radiometer (AVHRR) series and other geostationary and polar orbiting platforms, and in situ data. Its records extend back to 1966 and are used in the analyses presented herein. The great advantage of satellite platform data is that it provides global coverage and is not subject to the observational challenges of in situ records noted above [5, 6].
Some stations in GHCND record SWE measurements. In the USA, the Snowpack Telemetry (SNOTEL) network has used automated stations to collect SWE data since about 1980 for the western USA. (http://www.wcc.nrcs.usda.gov/factpub/sntlfct1.html). Manual measurements of SWE (snow surveys) are another important worldwide high elevation source with data extending back to the first half of the twentieth century in many cases (http://www.wcc.nrcs.usda.gov/centennial.html).
The spatial variability of snow metrics can be quite high in certain situations, such as in mountainous regions and in areas of geographic boundaries (e.g., land-water). Analysis of long-term trends in SNWD and SWE necessarily requires the use of in situ records but the representativeness of such observations may be uncertain in such situations. In the case of mountainous terrain, analysis of SNOTEL and snow survey data are very useful to complement studies of data taken at standard, lower elevation, stations. In this paper, the review of multiple studies and examination of changes over large areas is used to provide confidence in conclusions about climate system changes.
Recent Studies and Analysis
-
(a)
Snow cover extent (SCE)
Regional changes in SCE have been the focus of two recent studies. Shi et al [9] found that late spring/early summer snow cover extent decreased over the Arctic over the period of 1972–2006 based on the NOAA weekly snow cover maps. The highest SCE values for May and June all occurred in the first half of the record. They also found that surface net radiation (SNR) is the primary source of energy for the snow cover changes while sensible heat flux makes a secondary contribution. These surface energy changes in turn are driven by changes in albedo, increased air temperature and increased water vapor pressure. Husler et al [10] developed a snow cover data set for the European Alps from 1985–2011 using AVHRR data. They found a trend toward shorter snow cover duration at lower elevations in the southwest and southeast of their region of study, with no overall trend elsewhere in monthly mean snow cover duration.
The above two studies, limited to regions and different time periods, may not reflect hemispheric trends. We provide a hemispheric perspective on extreme SCE years based on satellite observations for 1967–2015 (Figs. 1 and 2). There has been an overall negative trend in Northern Hemisphere SCE, as illustrated in Fig. 1 which shows the difference in April SCE between the first (1967–1991) and second (1992–2015) halves of the period. A large majority of the grid cells have experienced less snow cover in the second half of the period, particularly over Eurasia and western North America. Extreme SCE years reflect this general tendency. Figure 2 shows the year of occurrence of the five highest and five lowest SCE values by month from October through June, a total of 45 highest and 45 lowest values. There is a concentration of the 45 highest SCE values in the early part of the record with 32 occurring prior to 1990 and only 13 from 1990 onward. The distribution of lowest values is more even with 19 occurring before, and 26 after, 1990. There is a seasonal dependence to the distribution. For the “spring” period of March–June, only one of the highest values occurred after 1990 and only three of the lowest values occurred before 1990. By contrast, for the “fall” period of October–December, only two of the lowest values occurred after 1990 while the highest values are evenly distributed before and after 1990. These tendencies are highlighted in the last 6 years of the observations. From 2010 onward, 7 of the 45 highest SCE values occurred, all in the early part of the cold season, while 9 of the 10 lowest May and June values occurred. This reflects the trend toward earlier spring snowmelt, particularly at high latitudes, while little trend is noted in extreme fall SCE.
Figure 1 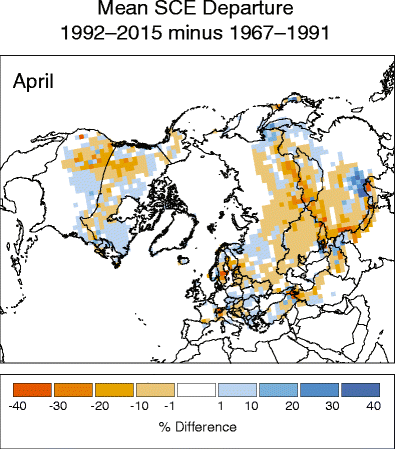
Comparison of April snow cover extent over Northern Hemisphere lands between the first (1967–1991) and second (1992–2015) half of the satellite data record. Locations where snow cover is less extensive in the second half of the period are shown in brown shades, and where the second half had more extensive cover in blue shades. SCE is from the NOAA satellite series and based on analyses of the climate data record product generated at Rutgers University
Figure 2 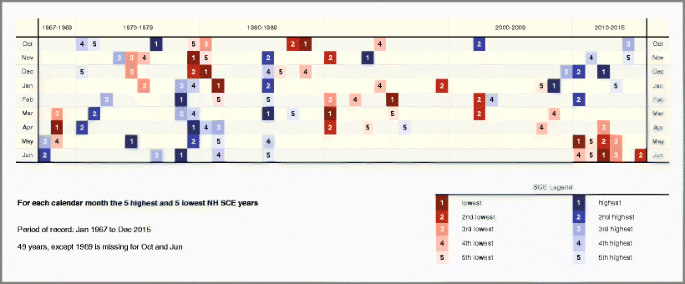
The 5 years with the most and least extensive snow cover extent over Northern Hemisphere lands are depicted for each month of the year (except for July–September). Data coverage is from 1967–2015. SCE is from the NOAA satellite series, with values based on analyses of the climate data record product generated at Rutgers University
The absolute extreme extent of snow cover for the period 1967–2015 is displayed in Fig. 3 for January and March. These maps define the limits where snow cover was present in no months or 100 % of the months in the period of record. In January (Fig. 3, top panel), snow cover has been present in all months in most of Canada except for the extreme southwest and southern Ontario. In the USA, snow cover has been present in some, but not all, months almost everywhere except for the far southwest and along the Gulf Coast and Florida peninsula. In Eurasia, snow cover has been present in all months from Scandinavia across most of Russia, the southern extent following roughly the southern Russia border, except for extreme southwest Russia where snow cover is variable. The southern extent of snow cover includes almost all of Europe, northern portions of the Middle East, and most of China except for far southeast China. The area of episodic snow cover (between 1 and 99 %) covers a large area.
Figure 3 
Extreme snow extents for the satellite period of record for January (top panel) and March (bottom panel). Areas in dark blue had 100 % snow cover in the respective month for the full period. Those in light blue had average cover ranging from 1-99 %, while lands depicted in white did not have a single instance where a NOAA weekly snow map reported snow cover (assumed as a given cell being less than 50 % covered)
In March (Fig. 3, bottom panel), the southern extent of snow cover present in all months and the northern extent of snow cover present in no months are shifted northward compared to January, as expected. These shifts are most noticeable along the USA-Canadian border, in southern Russia, and in southeast China. But, the shifts are relatively small compared to the area of episodic snow cover.
Snow cover can be an important driver of the climate system due to the large difference in albedo between snow-covered and bare surfaces. The large area of episodic snow cover shown in Fig. 3, covering a sizeable percentage of Northern Hemisphere land mass, suggests that land-surface feedback effects are potentially large. This is particularly so in March, where not only are the year-to-year differences in SCE among the most pronounced of any month, but also due to the high solar angle in the spring as compared to fall and winter.
-
(b)
Snow on ground (snow depth-SNWD and snow water equivalent-SWE)
There are several recent studies examining snow on the ground, SNWD and SWE, at the local and regional scale, mainly over the USA and Europe.
-
USA
Pederson et al [11] analyzed April 1 snow water equivalent (SWE) in the western USA. They found that since 1980 changes in the northern and southern Rocky Mountains have been synchronous and generally declining associated with springtime warming. Prior to 1980, snowpack generally exhibited a dipole behavior with opposite anomalies in the north and south. Fassnacht and Hultstrand [12] examined trends in snow depth and SWE from three long-term snow course stations in northern Colorado for 1936 to 2014. They found negative trends at two of the stations. At the third station, a positive trend was found for the first half of the record and a decrease over the second half.
Lute and Abatzoglou [13] examined the contribution of individual extreme snowfall events in contributing to seasonal SWE in the western USA. They defined snowfall events as cumulative SWE accumulation over 3-day periods. They found that the top decile of events explained 69 % of the interannual variability in snowfall water equivalent. Harpold et al [14] analyzed SNOTEL SWE for the central and southern Rocky Mts for the period 1984-2009. They found widespread decreases in maximum SWE and duration of snow cover.
The ongoing drought in the western USA is highlighted by the extremely dry 2014–2015 winter that followed 3 previous dry winters. For example, at Donner Summit, CA (approximate elevation of 2100 m) in the Sierra Nevada Mountains, end of season SWE on April 1, 2015 was the lowest on record, based on survey measurements back to 1910 (Fig. 4), at only 1.3 cm, or less than 2 % of the long-term average. This followed the previous record low in 2014. The back-to-back lowest SWE values on record are an indicator of the severity of the current drought, which has caused major impacts on water resources in California. Belmecheri et al. [15] estimate that the return period of this drought is at least 500 years based on paleoclimatic reconstructions.
Figure 4 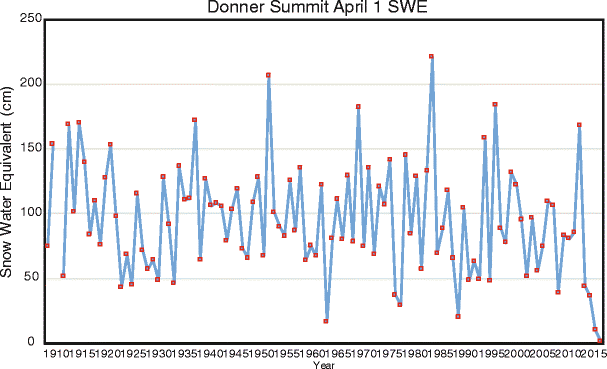
Time series of snow survey measurements of SWE (cm) around April 1 at Donner Summit, California, USA
Gan et al [16] analyzed trends in SWE estimate from satellite measurements of surface brightness temperature. They detected an overall negative trend over North America for the period of 1979–2007. The most extreme low April SWE occurred in 2005. They attributed the overall decrease to rising temperatures.
These studies as a whole are consistent in indicating a decrease in snow on the ground with the some of the most extreme low values occurring in the last 10–15 years. This is consistent with our expectation for the direct effect of warming temperatures.
-
Eurasia
Pielmeier et al [17] studied the occurrence of wet snow and full-depth glide avalanches in the Swiss Alps over the period of 1952 to 2013. They found a positive trend in such activity during the mid-winter which they attributed to the positive trend in air temperature. Terzago et al [18], in a study of six sites in the Italian Alps for the period of 1926–2010, found negative trends in snow depth, although with considerable decadal-scale variability. The absolute lowest values of snow depth occurred in the early 1990s with somewhat higher values since then.
Lehtonen [19] provided a climatic perspective on the recent occurrence of four consecutive snowy winters in Helsinki. While maximum snow depths were well above average and higher than winters of the previous three decades, these winters were not unusual when compared to winters of the early and middle 20th Century when comparable or greater snow depths occurred on a somewhat regular basis. Yadav and Bhutiyani [20] used tree-ring chronologies to develop a 500+ -year time series of SWE for the western Himalaya Mountains. These chronologies indicated that recent droughts in the 2000s are of similar magnitude to the worst droughts in this period, which include severe droughts in the 1780s and early 1800s.
This set of studies represents a small percentage of the land mass for Eurasia and thus general conclusions should not be drawn. They do illustrate the considerable spatial and temporal variability associated with snow metrics.
-
Global analysis
To provide a broader perspective on this set of regional studies, an analysis of data available in GHCND was performed. Annual maximum snow depth was first determined for individual GHCND stations meeting the requirements outlined in Section 2. Then, these values were averaged for all available stations in the grid box to create an annual resolution grid box time series. Grid box size was variable, with 4° × 4° used for the coterminous USA and Europe (where density of stations is higher) and 10° × 10° for the rest of North America.
Figure 5 shows trends in annual maximum snow depth for 1961–2015. A key point is that there are large areas of Eurasia that are not well represented in GHCND. Thus, our analysis is mostly a North America (NA) view. For NA, most grid boxes exhibit negative trends. This is also the case for the small area of Europe with available data in GHCND. While most of the trends for the coterminous United States are not statistically significant, many of the Canadian-centered and European grid box trends are statistically significant. Vincent et al [21] also found decreases in annual maximum snow depth at Canadian stations over a slightly longer period of 1948-2012.
Figure 5 
Grid box trends (%/decade) in annual maximum snow depth for cold season periods of 1960/1961–2014/2015. a Numbers indicate number of stations available in that grid box. b Boxes with “x” indicate statistically significant trends at the p < 0.05 level of significance
The grid box time series of Fig. 5 was converted into standardized anomalies and then averaged (with area weighting) to create a hemispheric time series. This is displayed in Fig. 6. As might be expected from Fig. 5, there is pronounced negative trend, of about 0.1 standard anomalies per decade. There is also a negative trend (not shown) in the number of stations experiencing their largest snow depth on record. The lowest value in Fig. 6 is the 2014/2015 cold season. While there was much press attention to the large snowfall totals in the northeast USA and far eastern Canada in that year, this was the only area (represented in Fig. 5) with large positive anomalies. Almost every other grid box had negative anomalies. Also shown is a time series of the day of occurrence of maximum snow depth (expressed as anomalies); there is a negative trend of about 1.4 days per decade.
Figure 6 
Time series of the area-weighted average of the Northern Hemisphere land grid box time series shown in Fig. 5 expressed as standardized anomalies (blue solid line) and of the day of occurrence of maximum snow depth expressed as anomalies (black dashed line). Maximum snow depth trend (blue; −0.11 standard anomalies per decade) and day of occurrence trend (black; −1.37 days per decade) are statistically significant at p < 0.05
A simple application of our hypotheses would lead to an expectation for increases in maximum snow depth for northern interior North America (Canada and northern USA). The reasons for the overall negative trend are not obvious. An analysis of cold season precipitation and total snowfall (not shown) indicate that most areas exhibit near-zero trends. Knowles [22] found that during the snow cover season in the USA, minimum temperatures have warmed and the fraction of time with temperatures above freezing has increased. The Vincent et al study [21] for Canada found large increases in winter temperature, decreases (increases) in winter precipitation in southern (northern) Canada, decreases in the ratio of snowfall to total precipitation, and a shift to earlier dates of the maximum snow depth. Thus, increased within-season melting of the snowpack and more precipitation falling as rain could be contributors to the negative trend in maximum snow depth. The shift toward earlier occurrence of the maximum snow depth suggests a shorter season for snowpack accumulation.
-
-
(c)
Snowfall
Snowfall data are usually collected at the same stations as snow depth and data availability is similar. There can be quality issues with snowfall data, as pointed out by Kunkel et al [7]. Kunkel et al [8] developed a quality-controlled snowfall data set by identifying stations of high temporal homogeneity.
Lawrimore et al [23] identified the top 100 severe snowstorms in each of six regions of the eastern and central USA over the period of 1901–2013. Severe snowstorms were defined by the areal coverage of snowfall exceeding region-specific threshold snowfall amounts related to significant impacts. The largest of these storms can deposit impactful snow amounts over areas exceeding 2 × 10⁶ km2 and very heavy snow amounts (exceeding a threshold for 25-year recurrence interval) over areas of greater than 3 × 10⁵ km2. They found that the median date of occurrence of late season (after Feb. 1) storms is trending toward earlier dates in the southern regions where air temperature plays a dominant role in modulating the occurrence of such storms. This corresponds with general warming spring temperatures in the USA. This relationship to temperature, an obvious one, has been related to snow cover extent [24]. Kluver and Leathers [25] used the quality-controlled snowfall data set developed by Kunkel et al [8] to develop a regionalization of snowfall patterns. They find a decrease in the frequency of large snowfall years in the southern USA and the US Pacific Northwest and an increase in the frequency of large snowfall years in the northern USA.
Scherrer et al [26] analyzed snow data from nine stations in the Swiss Alps, all with at least 100 years of data. They find no long-term trend in maximum daily snowfall. However, since 2000, there has been a notable absence of very large snowfall accumulations exceeding 60 cm. They attribute this to natural decadal variability. Serquet et al [27] found a negative trend in the ratio of snowfall days to total precipitation days from 1961–2008 across Switzerland in all of the cold season months, indicating more frequent liquid precipitation. The lowest values of this ratio occurred predominantly in the early 1990s.
Mir et al [28] studied snowfall in a small region of the Himalaya Mts. They found negative trends for most stations for 1976–2008, but these were not statistically significant. An examination of their time series does not suggest any definitive trend in the occurrence of extreme snowfall years. Wang et al [29] evaluated time series of annual maximum 1-day snowfall amounts for 18 stations in far northwest China. They found statistically significant positive trends at several stations and no stations with statistically significant negative trends.
These studies on snowfall are mixed, with different regional results for the direction of trends. The USA and northwest China results are supportive of our hypotheses although the results for the Swiss Alps [26] are not necessarily as one might expect an increase in extreme daily snowfall at high mountain locations in response to increasing water vapor concentrations. But natural variability will cause regional variations.


Discussion and Conclusions
Evaluation of overall trends in snowfall extremes is a challenge because most studies are regional in nature and the ready availability of station data is quite limited for Eurasia and at high latitudes over North America. This means that the hypotheses raised in the introduction are difficult to evaluate. Given the data challenges, the NH SCE CDR is a particularly valuable resource that is not dependent on the vagaries of incorporation of station data from many nations into the GHCND.
The results from the recent studies are somewhat mixed but a preponderance of evidence suggests downward trends in a number of snow characteristics. The analysis performed herein on maximum seasonal snow depth points to a robust trend in this variable. This conclusion is applicable to North America. Maximum snow depth is also decreasing for those European stations analyzed but due to limited data coverage, this particular analysis does not examine all of Eurasia, or even all of Europe. Other studies by the authors and other investigators show generally negative trends in snow cover extent and snow water equivalent across both North America and Eurasia. The few studies available point to a positive trend in the number of extreme snowfall events, but there is regional variability in this finding.
Most of these results are consistent with the hypotheses presented in the Introduction, recognizing that modes of variability in the climate system are likely to lead to regional variations. One exception to this is the general negative trend in maximum snow depth over most areas. A simple application of our hypotheses would lead to an expectation for positive trends in northern interior locations, rather than the observed negative trends, and negative trends on the southern margins of snow areas, which are observed.
Rupp et al [30] examined climate model simulations of Northern Hemisphere spring snow cover extent and compared with observed trends. With natural forcings alone, the models were unable to reproduce observed trends. With the combination of natural and anthropogenic forcings, the models simulated the observed downward trend, although the magnitude was underestimated.
Snow cover is an important driver of the climate system due to the large difference in albedo between snow-covered and bare surfaces. Fassnacht et al [31] found statistically significant trends in winter albedo modeled from snow cover for 1951–2010 at a number of locations in the northern Great Plains of the USA but large regional variations in the direction of the trends and no overall trend for the region as a whole. A full understanding of the historical variations and its overall effect on albedo is hampered by lack of full spatial coverage of important data sets, such as SNWD and SWE. Continued efforts (data archaeology) need to be undertaken to gather data sets and analyze them in a coherent fashion for large areas.
References
Harder P, Pomeroy J. Estimating precipitation phase using a psychrometric energy balance method. Hydrol Process. 2013;27:1901–14. doi:10.1002/hyp.9799.
O’Gorman PA. Precipitation extremes under climate change. Curr Clim Change Rep. 2015;1:49–59. doi:10.1007/s40641-015-0009-3.
Collins M, Knutti R, Arblaster J, Dufresne JL, Fichefet T, Friedlingstein P, et al. Long-term climate change: projections, commitments and irreversibility. In: Stocker TF, Qin D, Plattner GK, Tignor M, Allen SK, Boschung J, Nauels A, Xia Y, Bex V, Midgley PM, editors. Climate change 2013: the physical science basis. Contribution of Working Group I to the Fifth Assessment Report of the Intergovernmental Panel on Climate Change. Cambridge, United Kingdom and New York, NY, USA: Cambridge University Press; 2013.
Kunkel KE, Karl TR, Brooks H, Kossin J, Lawrimore J, Arndt D, et al. Monitoring and understanding changes in extreme storms: state of knowledge. Bull Am Meteorol Soc. 2013;94:499–514. http://dx.doi.org/10.1175/BAMS-D-12-00066.1.
Kunkel KE, Palecki M, Hubbard KG, Robinson D, Redmond K, Easterling D. Trend identification in 20th century U.S. snowfall: the challenges. J Atmos Oceanic Technol. 2007;24:64–73.
Kunkel KE, Palecki M, Ensor L, Hubbard KG, Robinson D, Redmond K, et al. Trends in 20th century U.S. snowfall using a quality-controlled data set. J Atmos Oceanic Technol. 2009;26:33–44.
Robinson DA. Hemispheric snow cover from satellites. Ann Glaciology. 1993;17:367–71.
Estilow TW, Young AH, Robinson DA. A long-term Northern Hemisphere snow cover extent data record for climate studies and monitoring. Earth Syst Sci Data. 2015;7:137–42. doi:10.5194/essd-7-137-2015.
Shi X, Déry SJ, Groisman PY, Lettenmaier DP. Relationships between recent Pan‐Arctic snow cover and hydroclimate trends. J Climate. 2013;26:2048–64. http://dx.doi.org/10.1175/JCLI‐D‐12‐00044.1.
Hüsler F, Jonas T, Riffler M, Musial JP, Wunderle S. A satellite‐based snow cover climatology (1985–2011) for the European Alps derived from AVHRR data. The Cryosphere. 2014;8:73–90.
Pederson GT, Betancourt JL, McCabe GT. Regional patterns and proximal causes of the recent snowpack decline in the Rocky Mountains, U.S. Geophys Res Lett. 2013;40:1811–6. doi:10.1002/grl.50424.
Fassnacht SR, Hultstrand M. Snowpack variability and trends at long‐term stations in northern Colorado, USA. Proc IAHS. 2015;371:131–6. doi:10.5194/piahs‐371‐131‐2015.
Lute AC, Abatzoglou JT. Role of extreme snowfall events in interannual variability of snowfall accumulation in the western United States. Water Resour Res. 2014;50:2874–88.
Harpold A, Brooks P, Rajagopal S, Heidbuchel I, Jardine A, Stielstra C. Changes in snowpack accumulation and ablation in the intermountain west. Water Resour Res. 2012;48:W11501. doi:10.1029/2012WR011949.
Belmecheri S, Babst F, Wahl ER, Stahle DW, Trouet V. Multi-century evaluation of Sierra Nevada snowpack. Nature Climate Change. 2016;6:2–3. doi:10.1038/nclimate2809.
Gan TY, Barry RG, Gizaw M, Gobena A, Balaji R. Changes in North American snowpacks for 1979–2007 detected from the snow water equivalent data of SMMR and SSM/I passive microwave and related climatic factors. J Geophys Res Atmos. 2013;118:7682–97. doi:10.1002/jgrd.50507.
Pielmeier C, Techel F, Marty C, Stucki T (2013) Wet snow avalanche activity in the Swiss Alps—trend analysis for mid‐winter season. Proceedings International Snow Science Workshop Grenoble – Chamonix Mont-Blanc – 2013. Link: http://www.researchgate.net/profile/Frank_Techel/publication/261672453_Wet_snow_avalanche_activity_in_the_Swiss_Alps__trend_analysis_for_midwinter_season/links/0f317534f632ddd627000000.pdf
Terzago S, Fratianni S, Cremonini R. Winter precipitation in Western Italian Alps (1926–2010). Meteor Atmos Phys. 2013;119:125–36. doi:10.1007/s00703-012-0231-7.
Lehtonen I. Four consecutive snowrich winters in Southern Finland: 2009/2010–2012/2013. Weather. 2015;70:3–8. doi:10.1002/wea.2360.
Yadav RR, Bhutiyani MR. Tree‐ring‐based snowfall record for cold arid western Himalaya, India since A.D. 1460. J Geophys Res Atmos. 2013;118:7516–22. doi:10.1002/jgrd.50583.
Vincent LA, Zhang X, Brown RD, Feng Y, Mekis E, Milewska EJ, et al. Observed trends in Canada’s climate and influence of low-frequency variability modes. J Climate. 2015;28:4545–60. doi:10.1175/JCLI-D-14-00697.1.
Knowles N. Trends in snow cover and related quantities at weather stations in the conterminous United States. J Climate. 2015;28:7518–28. doi:10.1175/JCLI-D-15-0015.1.
Lawrimore J, Karl TR, Squires M, Robinson DA, Kunkel KE. Trends and variability in severe snowstorms east of the Rocky Mountains. J Hydrometeor. 2014;15:1762–77. http://dx.doi.org/10.1175/JHM‐D‐13‐068.1.
Leathers DJ, Robinson DA. The association between extremes in North American snow cover extent and United States temperatures. J Climate. 1993;6:1345–55. http://dx.doi.org/10.1175/1520-0442(1993)006<1345:TABEIN>2.0.CO;2.
Kluver D, Leathers D. Regionalization of snowfall frequency and trends over the contiguous United States. Int J Climatol. 2015;35:4348–58. doi:10.1002/joc.4292.
Scherrer SC, Wüthrich C, Croci‐Maspoli M, Weingartner R, Appenzeller C. Snow variability in the Swiss Alps 1864–2009. Int J Climatol. 2013;33:3162–73. doi:10.1002/joc.3653.
Serquet G, Marty C, Rebetez M. Monthly trends and the corresponding altitudinal shift in the snowfall/precipitation day ratio. Theor Appl Climatol. 2013;114:437–44. doi:10.1007/s00704-013-0847-7.
Mir RA, Jain SJ, Saraf AK, Goswami A. Decline in snowfall in response to temperature in Satluj basin, western Himalaya. J Earth Syst Sci. 2015;124:365–82. doi:10.1007/s12040-015-0539-z.
Wang SP, Jiang FQ, Hu RJ, Zhang YW. Temporal and spatial variability of extreme snowfall indices over northern Xinjiang from 1959/1960 to 2008/2009. Nat Hazards Earth Syst Sci Discuss. 2013;1:7059–92. doi:10.5194/nhessd‐1‐7059‐2013.
Rupp DE, Mote PW, Bindoff NL, Stott PA, Robinson DA. Detection and attribution of observed changes in Northern Hemisphere spring snow cover. J Climate. 2013;26:6904–14. http://dx.doi.org/10.1175/JCLI‐D‐12‐00563.1.
Fassnacht SR, Cherry ML, Venable NBH, Saavedra F. Snow and albedo climate change impacts across the United States Northern Great Plains. The Cryosphere. 2016;10:329–39. doi:10.5194/tc-10-329-2016.
Acknowledgements
This work was partially supported by NOAA through the Cooperative Institute for Climate and Satellites—North Carolina under Cooperative Agreement NA14NES432003. On behalf of all authors, the corresponding author states that there is no conflict of interest.
Author information
Authors and Affiliations
Corresponding author
Additional information
This article is part of the Topical Collection on Extreme Events
Rights and permissions
About this article

Cite this article
Kunkel, K.E., Robinson, D.A., Champion, S. et al. Trends and Extremes in Northern Hemisphere Snow Characteristics. Curr Clim Change Rep 2, 65–73 (2016). https://doi.org/10.1007/s40641-016-0036-8
Published:
Issue Date:
DOI: https://doi.org/10.1007/s40641-016-0036-8