
Abstract
Carbon nanotube mixed grinding wheel is used in the grinding process to analyze the surface characteristics of AISI D2 tool steel material. Till now no work has been carried out using carbon nanotube based grinding wheel. Carbon nanotube based grinding wheel has excellent thermal conductivity and good mechanical properties which are used to improve the surface finish of the workpiece. In the present study, the multi response optimization of process parameters like surface roughness and metal removal rate of grinding process of single wall carbon nanotube (CNT) in mixed cutting fluids is undertaken using orthogonal array with grey relational analysis. Experiments are performed with designated grinding conditions obtained using the L9 orthogonal array. Based on the results of the grey relational analysis, a set of optimum grinding parameters is obtained. Using the analysis of variance approach the significant machining parameters are found. Empirical model for the prediction of output parameters has been developed using regression analysis and the results are compared empirically, for conditions of with and without CNT grinding wheel in grinding process.
Introduction
CNTs have created great interest in the field of nanotechnology, both from a fundamental point of view and for future applications. The most eye-catching features of these structures are their superior mechanical, optical and chemical characteristics, which introduce a new method of machining application. CNTs have tremendously high surface area and good electrical conductivity. The CNT used in the current research study is 100 times stronger than steel [1] and its weight is 1/6th the weight of steel. Due to this high strength to weight ratio it is extensively used in aerospace industries. Young’s modulus of CNT is over 1 TPa versus 70 GPa for aluminum, steel 200 and 700 GPa for C-fibre. The strength to weight ratio is 500 times greater than aluminum and maximum strain is 10 % higher than any material. Thermal conductivity of CNT is 3320 W/mK in the axial direction with smaller values in the radial direction. Electrical conductivity of CNT is 109 A/cm2 and for copper it is 106 A/cm2. Such high current carrying capacities are excellent field emitters and can have high aspect ratio.
Previous Work
Mamalis et al. [1] presented a consolidated view of the synthesis, the properties and applications of carbon nanotubes, with the aim of drawing attention to useful available information and to enhance the interest of the researcher and the manufacturing engineer in this new, highly advanced technological field. Rahman et al. [2] introduced recent achievements in some important areas of tool-based micromachining. Electrolytic in-process dressing (ELID), grinding and ultra precision machining using single point diamond tool are two most widely applied techniques to produce nanosurface finish on hard and brittle materials. Recently, these techniques are also being applied for nanosurface generation on silicon wafers and it is hoped that this process will soon be able to replace the current technique of chemical mechanical polishing process. Inasaki [3], noted that silicon is widely used as a substrate material in fabricating microelectronic devices. The ELID grinding process has been found to be an efficient process for machining silicon to generate superior surface qualities. There have been, however, very few studies on understanding the basic mechanism of the ELID process and to the authors’ knowledge no detailed studies for observing changes of wheel surface condition and their corresponding performance in machining silicon wafers have been reported. Therefore, a wide variety of experiments have been conducted to study the generated grinding wheel surface, the consequent grinding performance and ground surface qualities. Under all experimental conditions, the ELID grinding process exhibited better performance compared to the conventional grinding process. The ELID grinding process, especially at intermediate range of experimental conditions showed significantly improved dressing and grinding performance with superior ground wafer surface and subsurface qualities.
Lim et al. [4] stated that demand for high quality surface finish, dimensional and form accuracy are required for optical surfaces and it is very difficult to achieve these using conventional grinding methods. ELID grinding is a new and efficient method that uses a metal-bonded diamond grinding wheel in order to achieve a mirror surface finish, especially on hard and brittle materials. However, studies reported so far have not explained the fundamental mechanism of ELID grinding. Hence it has been studied here, by conducting experiments to establish optimal grinding parameters to obtain better surface finish under various in-process dressing conditions. In this research the results show that the cutting forces are unstable throughout the grinding process due to the breakage of an insulating layer formed on the surface of the grinding wheel; however, a smoother surface can be obtained using high dressing current duty ratio at the cost of high tool wear. The fundamental mechanism of ELID grinding as explained by You et al. [5] is studied in detail here by conducting experiments to establish optimal grinding parameters to obtain better surface finish under various in-process dressing conditions. Nanostructures are directly used to fully utilize the needed mechanical and thermal properties for nano machining. CNTs were directly used as cutting grains. These CNT grains, used epoxy as one of the bonding materials and a series of CNT grinding wheels were fabricated to demonstrate the effectiveness of the proposed new type abrasive tool [6].
Al-Refaie et al. [7] proposed an approach for optimizing multiple responses in the Taguchi method using regression models and grey relational analysis. In this approach, each response is transformed into signal-to-noise (S/N) ratio. The S/N ratios are then utilized to model each response with process factors and complete the responses for all factor level combinations. The grey relational analysis is then used to combine the quality response of each experiment into a single grey grade. Typically, the larger grey grade indicates better performance. Thus, the factor level with the largest level grade is identified as the optimal level for that factor. In this paper carbon nanotube mixed grinding wheel is used in the grinding process to analyze surface characteristics like surface roughness and metal removal rate using grey relational analysis techniques. Omori et al. [8] by his study of finish grinding techniques succeeded in developing a new grinding technique that yielded mirror quality finished surfaces. This new technique uses electrolytic in-process dressing with micro-grain cast Iron fiber bonded wheels. This enables stable mirror finish surfaces to be ground on conventional grinding or cutting machines. The technique has started to substitute the place of lapping and polishing. This paper describes the vital characteristics of this new grinding technique, with its features and also the various advantages in applied mirror finish surface grinding of hard silicon wafers. Chakradhar and Venugopal [9] investigated the effect and parametric optimization process parameters for Electrochemical machining of EN-31 steel using Grey relation analysis. The process parameters considered were electrolyte concentration, feed rate and applied voltage which were optimized with considerations of multiple performance characteristics including material removal rate, overcut, cylindricity error and surface roughness. Analyses of variance were performed to get the contribution of each parameter to the performance characteristics and it was observed that feed rate was the significant process parameter that affected the ECM robustness.
Narender Singh et al. [10] stated that optimization of process parameters was the key step in the Taguchi methods to achieve high quality without cost inflation. Optimization of multiple response characteristics was more complex compared to optimization of single performance characteristics. The multi-response optimization of the process parameters on electric discharge machining (EDM) of metal matrix composites using orthogonal array with grey relational analysis was reported. Kao et al. [11] reported that grey relational analysis was useful for multi-input, discrete data and uncertain experimental study. The application of the grey relational analysis for optimizing the electro polishing of 316L stainless steel with multiple performance characteristics is developed in this paper. The processing parameters are optimized by considering the various multiple performance characteristics. The conducted experiments and their results fully confirmed the effectiveness of the grey relational analysis. Tzeng et al. [12] investigated the optimization of CNC turning operation parameters for SKD11 using the grey relational analysis method. Nine experimental runs based on an orthogonal array of Taguchi method were described with the surface properties of roughness average and roughness maximum as well as the roundness selected as the quality targets. An optimal parameter combination of the turning operations was obtained via grey relational analysis. By analyzing the grey relational grade matrix, the degree of influence for each controllable process factor onto individual quality targets could be found.
Lu et al. [13] investigated optimal design of the cutting parameters for rough cutting processes in high-speed end milling on SKD61 tool steel. In their study, the process was done intrinsically with multiple performance indexes so that grey relational analysis that used grey relational grade as performance index was specially adopted to determine the optimal combination of cutting parameters. Itoh et al. [14] investigated the effect of finish ELID grinding on the flexural strength of silicon nitride specimens. Prabhu and Vinayagam [15] stated that carbon nanotube has better mechanical and electrical properties specifically high electrical conductivity; using these properties the Single Wall Carbon Nanotube was mixed with cutting fluid. Water-soluble oil was used as cutting fluid in electrolytic in-process dressing (ELID) technique; the grinding process for analysis of surface characteristics like surface roughness, morphology and micro crack of the workpiece by AFM measurements at nano level. Pan et al. [16], demonstrated the effectiveness of optimizing multiple quality characteristics of Nd: YAG laser welded titanium alloy plates via Taguchi method-based Grey analysis. The modified algorithm adopted was successfully used for both detraining the optimum settings of machine parameters and for combining multiple quality characteristics into one integrated numerical value called grey relational grade or rank. The optimized machine parameter settings clearly improved the quality characteristics of welded plates compared to quality levels achieved from conventional machine parameter settings.
Natrajan and Arunachalam [17] presented the optimization of multiple performance characteristics in micro electrical discharge machining using Taguchi method and grey relational analysis. Based on ANOVA, pulse on time was found to be the most significant factor, which affected the micro-EDM process. Siddiquee et al. [18] investigated optimization design of an in-feed centreless cylindrical grinding process performed on EN52 austenitic valve steel. Since the process was with multiple-performance characteristics, the grey relational analysis that used grey relational grade as performance index was specially adopted to determine the optimal combination of centreless cylindrical grinding parameters.
Grey Relational Analysis
Grey relational analysis (GRA) is a normalization evaluation technique extended to solve complicated multi-performance characteristics optimization effectively. The lower-the-better performance for one factor may affect the performance because another factor may demand higher-the-better characteristics. In grey relational analysis, the complex multiple response optimizations can be simplified into the optimization of a single response grey relational grade. Here, Grinding machining with (results of) surface roughness and Metal removal rate process parameter values are converted into a single grey relational grade. The optimization of the process was performed in the following steps:
-
1.
Generate reference data series x0.
$$x_{0} = \left( {d_{01} ,d_{02} , \ldots d_{0m} } \right)$$(1)where, m is the number of respondents. In general, the x 0 reference data series consists of m values representing the most favoured responses.
-
2.
Generate comparison data series x i
$$x_{i} = (d_{i1} ,d_{i2} , \ldots d_{im} )$$(2)where, i = 1,…, k. k is the number of scale items. So there will be k comparison data series and each comparison data series contains m values.
-
3.
Compute the difference data series Δi.
$$\varDelta i = (\left| {d_{01} } \right. - \left. {d_{i1} } \right|,\left| {d_{02} } \right. - \left. {d_{i2} } \right|, \ldots \left| {d_{0m} } \right. - \left. {d_{im} } \right|$$(3) -
4.
Find the global maximum value Δmax and minimum value Δmin in the difference data series.
$$\varDelta \hbox{max} = \hbox{max} \forall i (\max\Delta {\text{i}})$$(4)$$\varDelta \hbox{min} = \hbox{min} \forall i (\min\Delta {\text{i}})$$(5) -
5.
Transform each data point in each difference data series to grey relational coefficient. Let γi (j) represent the grey relational coefficient of the jth data point in the ith difference data series, then
$$\gamma_{i} = (\varDelta \hbox{min} + \varepsilon \varDelta \hbox{max} )/\left( {\varDelta i\left( j \right) + \varepsilon \varDelta \hbox{max} } \right)$$(6)where Δi(j) is the jth value in Δi difference data series. ɛ is a value between 0 and 1. The coefficient ɛ is used to compensate the effect of Δmax and it should be an extreme value in the data series. In general, the value of ɛ can be set as 0.5.
-
6.
Compute grey relational grade for each difference data series. Let Γi represent the grey relational grade for the ith scale item and assume that data points in the series are of the same weights 1, then
$$\Gamma _{i} = \frac{1}{m} \mathop \sum \limits_{j = 1}^{m} \gamma i\left( j \right)$$(7)The magnitude of \(\Gamma _{i}\) reflects the overall degree of standardized deviance of the ith original data series from the reference data series. In general, a scale item with a high value of Γ indicates that the respondents, as a whole, have a high degree of favored consensus on the particular item.
-
7.
Sort \(\Gamma _{i}\) values into either descending or ascending order to facilitate the managerial interpretation of the results. The procedures of the process parameter optimization with multiple quality characteristics are shown in Fig. 1.
Fig. 1 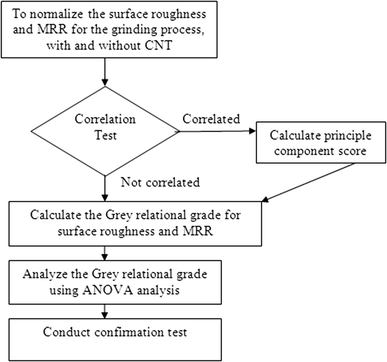
Optimization procedure for grinding parameters with multiple quality characteristics

Carbon nanotubes are related to graphite. In conventional graphite, the sheets of carbon are stacked on top of one another, allowing them to easily slide over each other. That is why graphite is not hard, but it feels greasy, and can be used as a lubricant. When graphene sheets are rolled into a cylinder and their edges joined, they form MWCNTs as shown in Fig. 2; the specifications of CNTs are given in Table 1. The Carbon nanotubes are procured from Cheap Tubes Inc., USA.

TEM image of MWNTs 95 wt% < 10 nm outer diameter
AISI D2 tool steel is air hardened, high carbon and high chromium steel possessing extremely high wear resistance which also contains molybdenum and vanadium in it. Owing to its superior quality and hardness it finds application in various fields. Table 2 lists the chemical composition (wt%) of the AISI D2 tool steel material, while Table 3 lists the mechanical properties of the AISI D2 tool steel that was tested in Mettex Lab, Chennai according to OES-CML/WP/35 and IS 1586-2000 standards.
Proposed Methodology
Grinding with super abrasive wheels is an excellent way to produce ultra precision surface finish. However, super abrasive diamond grits need higher bonding strength while grinding, which metal-bonded grinding wheels can offer. The specimen is made of D2 Tool steel, which is widely used in the mold and dies industry. The hardness of the specimen was 57 HRC. The uniform mixture of carbon nanotube with aluminium oxide abrasive is obtained by stir casting techniques. MSG 41 CNC surface grinding machine is used with CNT grinding wheel to machine the AISI D2 tool steel work piece material. Taguchi design of experiments technique is applied to carry out the modeling and analysis of the influence of process variables (design factors) on the response variables. In the present study, the depth of cut (d, mm), spindle speed (N, rpm) and feed rate (f, mm/min) have been selected as design factors while other parameters have been assumed to be constant over the experimental domain. The process variables (design factors) with their values on different levels are listed in Table 4. The selection of the values of the variables is limited by the capacity of the machine used in the experimentation as well as the recommended specifications for AISI D2 tool steel work piece and CNT grinding wheel combinations. After machining, the surface roughness of AISI D2 tool steel material is measured by surface roughness tester (Hommel Tester TR500). The experiments are carried out by using L9 orthogonal array. The regression analyses are used to predict the error between actual measurements with regression model values. The experimental values along with design matrix are shown in Table 5.
Results and Discussions
The abrasive grain particles are mixed with multi-wall carbon nanotube to make the CNT grinding wheel as shown in Fig. 3 (Kent Abra Tools, Chennai, India). The maximum operating speed of the grinding wheel is tested and determined to be 3640 rpm. The size of the grinding wheel used is 180 × 13 × 31.75 mm (diameter × width × thickness respectively). The composition of the CNT grinding wheel is WA 60 K 5 VK 35. The letter A denotes that the type of abrasive is aluminum oxide. The number 60 specifies the average grit size in inch mesh. The letter K denotes the hardness of the wheel, which means the amount of force required to pull out a single bonded abrasive grit by bond fracture. The number 5 denotes the structure or porosity of the wheel. The letter code V means that the bond material used is vitrified. The number 35 is the wheel manufacturer’s identity code.

Abrasive grinding wheel without CNT (left) and abrasive grinding wheel with CNT (right)
To determine the effect of the carbon nanotube on the metal removal rate of the AISI D2 tool steel, the weights before and after machining are measured and the difference of weight is divided by the time taken for machining; the result is reported with accuracy up to three decimal places.
CNT grinding wheel microstructure is analyzed using Scanning electron microscope at the Nanotechnology Research Center, SRM University, Chennai. SEM analysis yields information about morphology and micro-cracks of the grinding wheel using CNT in CNC grinding process. By using CNT in the grinding wheel the surface gets smoother with reduced micro-cracks of the wheel because of CNT thermal property of filling the voids structure of Al2O3 abrasive parent materials. Without CNT in the grinding wheel more number of cracks occurs; hills and valleys are more when compared with CNT grinding wheel process. CNT uniformly distributed with aluminium oxide grinding wheel is shown in Fig. 4.

SEM image, without CNT grinding wheel (left) and With CNT grinding wheel (right)
The hardness test is performed for both without and with CNT grinding wheel using RAB250 hardness tester model. In this process, 100 kg load is applied through 1/16 in. diameter ball indenter, which is used to obtain the hardness of the grinding wheel. Without CNT grinding wheel the hardness value obtained is 64 HRC and for similar operation with CNT grinding wheel it is 80 HRC. From hardness testing it is noted that the surface hardness of the material increases with an increase in the amount of carbon nanotube in the composite grinding wheel as the carbon nanotube absorbs this impact thus increasing the machinability which is observed from the analysis of surface roughness by Taguchi method. The experimental observations are shown in Table 6. Further, the computations of grey relational coefficient is shown in Table 7.
For lower-the-better quality characteristics of surface roughness, data preprocessing is calculated by using the formula:
Δi can be calculated by using Eq. (3).
In the grey relational analysis, the grey relational grade (Table 8) is used to show the relationship between the series. Let (X, Γ) be a grey relational space, X stands for the collection of grey relational factors, let xi be the compared series and x0 be the reference series:
The higher value of the grey relational grade represents the stronger relational degree of the reference sequence (k).
Since the experimental design is orthogonal, it is then possible to separate the effects of each process parameter at different levels. The mean of grey relational grade for the cutting speed, feed and depth of cut at level 1, 2 and 3 can be calculated by taking the average of the grey relational grade for the experiments 1–3, 4–6 and 7–9, respectively. The mean of the grey relational grade for each level of other machining parameters can be computed in a similar manner. Grey relational coefficient of each performance for with and without CNT is shown in Table 8 and the mean of the relational grade for each level of the combining parameters is summarized in the multi-response performance which is shown in Table 9.
The purpose of analysis of variance is to find the significant factors affecting the machining process to improve the surface characteristics of AISI D2 tool steel material in the grinding process. ANOVA Table clearly depicts clearly how the process parameters affect the response and the level of significance of the factor considered. The ANOVA table for grey relational grade of different process parameters is calculated. In the ANOVA Table 10, the effects of grey relational analysis with control parameters are statistically significant at 95 % confidence level. Value of R2 is 0.9314, which signifies that the model can reasonably explain 93.14 % of the variability in grey relational grade. The adjusted R squared (R2 adj) for the model is 0.7254, which is very close to the value of ordinary R squared (R2), i.e. 0.9314. Thus, it can be stated that no non-significant terms are included during empirical model building for grey relational analysis. Degree of contribution, as stated in Table 10 developed by using ANOVA reveals that cutting speed, feed and depth of cut have 6.62, 44.28 and 42.30 % contribution, respectively in grey relational grade. Larger FAo value 6.44 indicates that the variation of the process parameter has a big effect on the grey relational grade.
Once the optimal level of the cutting parameters is identified in Fig. 5, the next step is to verify the improvement of the performance characteristics using this optimal combination. The comparison between the experimental results using the initial combination of the machining parameters with the optimal one A1B1C1 is shown in Table 11.

Factor effect diagram for grey relational grade with process parameters
As observed in Table 11, surface roughness increased from 0.111 to 0.14 µm without CNT and 0.079–0.10 µm with CNT machining. Metal removal rate increased from 0.018 to 0.027 mm3/s without CNT and from 0.82 to 0.089 mm3/s using CNT based machining. Based on the above results, it is clearly observed that quality characteristics can be greatly improved through this developed approach.
Confirmation Test
The estimated grey relational grade α using the optimal level of the machining parameters can be calculated as:
where αm is the total mean of the grey relational grade, αi is the mean of the grey relational grade at the optimal level and n is the number of the machining parameters that significantly affects the multiple response characteristics. Based on Eq. (4), the estimated grey relational grade using the optimal grinding parameters can be found out even for the setting not available in the orthogonal array. The confirmation experiment is the final step in the first iteration of the design of experiment process. The purpose of the confirmation experiment is to validate the conclusions drawn during the analysis phase. The confirmation experiments were conducted by setting the process parameters at optimum level. Cutting speed 2800 rpm, feed 300 mm/min and depth of cut 0.15 mm are set as optimum parameters and the optimal surface roughness obtained without CNT is 0.14 µm compared to 0.10 µm with CNT.
Regression Modeling
Regression model is applied to determine the relationship between independent variables and dependent variables. Here cutting speed, feed and depth of cut are used as independent variables and surface roughness and MRR are used as dependent variables. Empirical expressions have been developed to evaluate the relationship between input and output parameters. The average output values of surface roughness have been used to construct the empirical expressions. The empirical model is developed based on the relationship between experimental values with cutting speed, feed and depth of cut in grinding process.
The empirical model was
Y, grey relational grade; A, coefficient; X1, speed (rpm); X2, feed (mm/min); X3, depth of cut (mm).
The developed empirical model for with and without CNT based grinding process parameters:
Results of regression analysis are compared with experiments in Table 5 for nine check sets. The comparison results are depicted in Table 12. The error between experimental values with regression values are calculated by using the equation
The maximum test error using regression model without CNT is 12.263 %. The model generation of regression model took just a couple of seconds. From the results, it is seen that error of measurements that occur with CNT based grinding process is 10.93 %. Figure 6 represents errors showing actual surface roughness with predicted regression model used in the grinding process.

Error showing experimental versus regression model for surface roughness with and without carbon nanotubes based grinding
Conclusion
The grey relational analysis based on Taguchi design and current experiment techniques are a good way of optimizing the grinding machining for AISI D2 tool steel with CNT as cutting grains. The mixture of abrasive grinding wheel with single wall carbon nanotubes shows clear increases in hardness after the addition of nanoparticles. The analytical results are summarized as follows:
-
1.
From the response table of the average grey relational grade, it is found that the largest value of the grey relational grade is for the cutting speed 2800 rpm, feed 300 mm/min and depth of cut 0.15 mm. These are the recommended levels of the controllable parameters of the grinding machining as the minimization of the surface roughness and maximization of MRR are simultaneously considered.
-
2.
The optimal combination of the ELID grinding parameters obtained from the proposed method is the set with A3, B1 and C3. The confirmation experiments are conducted by setting the process parameters at optimum level and the optimal surface roughness obtained without CNT is 0.140 µm compared to with CNT as cutting grains are 0.110 µm. The order of the importance of the controllable factors to the roughness and MRR, in sequence are, the feed, depth of cut and cutting speed.
-
3.
In the regression analysis the maximum test errors for surface roughness without using CNT are 12.26 % and with using CNT are 10.93 %. From the results, it is seen that errors of measurement that occur in surface roughness with carbon nanotubes are less than without carbon nanotubes. This method is suitable for estimating surface roughness within acceptable error ranges.
-
4.
ANOVA reveals that cutting speed, feed and depth of cut have 6.62, 44.28 and 42.30 % contribution, respectively in grey relational grade. Larger FAo value of 6.44 indicates that the variation of the process parameter makes a big change to has a big effect on the grey relational grade.
References
A.G. Mamalis, L.O.G. Vogtlander, A. Markopoulos, Nanotechnology and nanostructured materials: trends in carbon nanotubes. Precis. Eng. 28, 16–30 (2004)
M. Rahman, H.S. Lim, K.S. Neo, A. Senthil Kumar, Y.S. Wong, X.P. Li, Tool-based nanofinishing and micromachining. J. Mater. Process. Technol. 185(1–3), 2–16 (2006)
I. Inasaki, Grinding of hard and brittle materials. CIRP Ann. Manuf. Technol. 36(2), 463–471 (1987)
H.S. Lim, K. Fathima, K.A. Senthil, M. Rahman, A fundamental study on the mechanism of electrolytic in-process dressing (ELID) grinding. Int. J. Mach. Tools Manuf. 42(8), 935–943 (2002)
J. You, Y. Gao, A study of carbon nanotubes as cutting grains for nano machining. Adv. Mater. Res. 76–78, 502–507 (2009)
R. Saidur, K.Y. Leong, H.A. Mohammad, A review on applications and challenges of nanofluids. Renew. Sustain. Energy Rev. 15, 1646–1668 (2011)
A. Al-Refaie, L. Al-Durgham, N. Bata, Optimal parameter design by regression technique and grey relational analysis, in Proceedings of the world congress on engineering, 2010, vol. III (WCE 2010, London)
H. Omori, T. Nakagawa, Mirror surface grinding of silicon wafers with electrolytic in-process dressing. CIRP Ann. 39(1), 329–333 (1990)
D. Chakradhar, A. Venu Gopal, Multi-objective optimization of electrochemical machining of EN31 steel by grey relational analysis. Int. J. Model. Optim. 1(2), 113–117 (2011)
P. Narender Singh, K. Raghukandan, B.C. Pai, Optimization by grey relational analysis of EDM parameters on machining Al–10 % SiCP composites. J. Mater. Process. Technol. 155–156, 1658–1661 (2004)
P.S. Kao, H. Hocheng, Optimization of electrochemical polishing of stainless steel by grey relational analysis. J. Mater. Process. Technol. 140, 255–259 (2003)
C.-J. Tzeng, Y.-H. Lin, Y.-K. Yang, M.-C. Jeng, Optimization of turning operations with multiple performance characteristics using the Taguchi method and grey relational analysis. J. Mater. Process. Technol. 209, 2753–2759 (2009)
H.S. Lu, C.K. Changb, N.C. Hwanga, C.T. Chung, Grey relational analysis coupled with principal component analysis for optimization design of the cutting parameters in high-speed end milling. J. Mater. Process. Technol. 209, 3808–3817 (2009)
N. Itoh, H. Ohmori, T. Kasai, T. Karaki Doy, Finishing characteristics of brittle materials by ELID lap grinding and metal-resin bonded wheels. Int. J. Mach. Tools Manuf. 38, 747–762 (1998)
S. Prabhu, B.K. Vinayagam, AFM investigation in grinding process with nanofluids using Taguchi analysis. Int. J. Adv. Manuf. Technol. 60, 149–160 (2012)
L.K. Pan, C.C. Wang, S.L. Wei, H.F. Sher, Optimizing multiple quality characteristics via Taguchi method-based grey analysis. J. Mater. Process. Technol. 182, 107–116 (2007)
N. Natarajan, R.M. Arunachalam, Optimization of micro EDM with multiple performance characteristics using Taguchi method and grey relational analysis. J. Sci. Ind. Res. 70, 500–505 (2011)
A.N. Siddiquee, Z.A. Khan, Z. Mallick, Grey relational analysis coupled with principal component analysis for optimization design of the process parameters in in-feed centreless cylindrical grinding. Int. J. Adv. Manuf. Technol. 46, 983–992 (2010)
Author information
Authors and Affiliations
Corresponding author
Rights and permissions
About this article

Cite this article
Sethuramalingam, P., Vinayagam, B.K. Multi Objective Optimization of Multi Wall Carbon Nanotube Based Nanogrinding Wheel Using Grey Relational and Regression Analysis. J. Inst. Eng. India Ser. C 97, 407–416 (2016). https://doi.org/10.1007/s40032-016-0238-9
Received:
Accepted:
Published:
Issue Date:
DOI: https://doi.org/10.1007/s40032-016-0238-9