This study investigated how fifth-grade children’s concept images of the unit fractions represented by the symbols \( \frac{1}{2} \), \( \frac{1}{3} \), and \( \frac{1}{4} \) changed as a result of their participation in an instructional intervention based on multiple embodiments of fraction concepts. The participants’ concept images were examined through pre- and post-teaching written questions and pre- and post-teaching one-to-one verbal interview questions. Results showed that at the pre-teaching stage, the student concept images of unit fractions were very narrow and mainly linked to area models. However, after the instructional intervention, the fifth graders were able to select and apply a variety of models in response to unit fraction tasks, and their concept images of unit fractions were enriched and linked to capacity, perimeter, linear and discrete models, as well as to area models. Their performances on tests had improved, and their conceptual understandings of unit fractions had developed.
Many schoolchildren experience difficulty in learning fractions (Bright et al. 1988; Carpenter et al. 1976; Conference Board of the Mathematical Sciences 2001; Gould 2005, 2008; Mack 1995; United States Department of Education [USDE] 2008). The “difficulty with the learning of fractions is pervasive,” and that becomes “an obstacle to further progress in mathematics and other domains dependent on mathematics” (USDE 2008, p. 28). To help children overcome the difficulty and master fraction concepts, emphasis has been placed, in some parts of the world, on an area-model approach to the teaching and learning of fraction concepts. With such an approach, school children initially learn to think of the concept of one-third, for example, as one of three 120° congruent sectors into which a circular region has been divided. Often, one 120° sector is shaded.
In the USA, the National Council of Teachers of Mathematics (NCTM) (2000) claimed that by “using an area model in which part of a region is shaded, students can see how fractions are related to a unit whole, compare fractional parts of a whole, and find equivalent fractions” (p. 150). Given the influence of NCTM’s (1989) Standards documents and more recently the Common Core Standards (Hirsch et al. 2012), it is hardly surprising that area-model approaches have been, and continue to be, emphasized in sections on fractions in textbooks used by elementary and middle school students in the USA (see, e.g., Altieri et al. 2009; Bell et al. 2002). This was not something new, however, for the use of area models in the teaching and learning of fraction concepts, which could be found in most textbooks written for mathematics teacher-education students during the twentieth century (see, e.g., Ashlock 1972; Kennedy and Tipps 1994; Lamon 2005; Robold et al. 2001).
However, for many years, some researchers (e.g., Clements and Del Campo 1987) have questioned the virtue of emphasizing predominantly one form of representation of fractions. Moss and Case (1999) argued that an overemphasis on area models has increased the difficulties experienced by many children attempting to learn fractions. Samsiah (2002) reported that although the sixth graders in her study could answer fraction questions related to area models, they could not transfer that knowledge to real-life situations which did not involve the shading of regions. Gould (2008) proposed that children were likely to develop very narrow concept images if they had been taught fractions by almost exclusively area-model approaches and argued that such an approach could hinder, rather than help, them in their future conceptual development.
Fractions can be interpreted as part-whole, quotient, operator, measure, and ratio number (Behr et al. 1992), and a mature understanding of fraction concepts involves an understanding and synthesis of the subconcepts which, until reification is achieved (Sfard 1991), can seem to be unrelated. When dealing with the range of the subconcepts associated with fractions, students, in most cases, call a concept image, and not a concept definition, to mind (Vinner and Hershkowitz 1980). Ever since its introduction into the mathematics education literature, the term concept image has been intended to describe “all the cognitive structure in the individual’s mind that is associated with a given concept”, including “all the mental pictures and associated properties and processes” (Tall and Vinner 1981, pp. 151–152). The “mental pictures” could be for any type of representation—picture, diagram, graph, symbolic form, etc. (Vinner and Dreyfus 1989). An individual’s concept image of a concept is the result of that individual’s “experience with examples and non-examples of the concept” (Vinner and Dreyfus 1989, p. 356). A concept definition has been defined as “a form of words used to specify that concept” (Tall and Vinner 1981, p. 152).
In the process of developing a mathematical concept, students often develop a concept image of that concept before they are able to make sense of an appropriate concept definition (Vinner and Hershkowitz 1980). A student’s concept image of some concept may not be congruent with, or even consistent with, the formal concept definition for that concept. For instance, Vinner and Hershkowitz (1980) tested student knowledge of the right angle and found “76 % of the students have a concept image for this notion that contains a right triangle with a vertical side and a horizontal side” (p. 182). Many of them did not consider an isosceles right triangle whose hypotenuse is “horizontal” as a right triangle. When a student’s concept image conflicts with the formal concept definition accepted by the mathematical community at large, he/she may consider the formal theory to be “inoperative and superfluous,” which can seriously hinder that student’s understanding of the concept (Tall and Vinner 1981, p. 154).
Therefore, it could be argued that it is important for teachers to allow students to gain experiences through a systematically organized set of tasks, with each task clearly related to the defining characteristics of the concept that the students are expected to learn. Engaging in such a set of tasks should place the students in a good position, ultimately, to reify the concept by gaining an appropriate concept definition consistent with concept images which incorporate key aspects of that definition (Clements and Del Campo 1987; Vinner and Hershkowitz 1980).
Unit fraction concepts represented by symbols like \( \frac{1}{2} \), \( \frac{1}{3} \), and \( \frac{1}{4} \) are traditionally first introduced to children attempting to learn fractions. They are expected to develop a conceptual understanding of and facility in implementing arithmetic operations with unit fractions and then other more complex fractions (NCTM 2000, 2006). This study was intended to investigate the concept images of \( \frac{1}{2} \), \( \frac{1}{3} \), and \( \frac{1}{4} \) of 40 end-of-fifth-grade students, and then to enrich and broaden their concept images of the unit fractions and therefore strengthen their conceptual understandings of the unit fractions.
Although there has been much research into the concept images of young learners with respect to fractions (e.g., Clements and Lean 1988, 1994; Gould 2008), the research in this paper differs from earlier research. The researchers consciously sought to map the concept images, with respect to unit fractions, of students who had been exposed to fraction concepts mainly through an area-model approach. Afterwards, a teaching intervention took place which deliberately sought to modify inadequate concept images so that students would be able to develop images consistent with holistic, mathematical definitions of unit fractions. The concept images with respect to unit fractions of each participating student were once again mapped, and the revised concept images were compared with the pre-intervention concept images.
Methodology
Research design
A paper-and-pencil test, developed by the researchers, was first administered to 40 fifth graders attending a public elementary school in the Midwest of the USA. These students had been randomly assigned (using a random-number generator) to two equal-sized groups (hereafter denoted as group 1 and group 2). The participants were allowed 60 min to complete the test—which, for all students, was ample.
Immediately after taking the test, each of the 20 students in group 1 participated in one-to-one interviews, each interview lasting between 20 and 45 min. The interviews were conducted by the three researchers based on a protocol developed by them. To enhance standardization of the interview procedures, one researcher quietly observed at least two interviews conducted by the other two researchers. During interviews, special materials like pencils, strings, markers, and paper were provided and made freely available to interviewees.
After the interviews with group 1 students, five 45-min lessons on unit fractions were taught to group 1 by the students’ normal mathematics teacher, Mr. X. The lesson plans were developed by the researchers in consultation with Mr. X—who had taught the mathematics classes for all of the participating students during their fifth-grade year.
Once the five lessons to group 1 had been completed, all participants in group 1 and group 2 took a parallel form of the original paper-and-pencil test, and then all 40 students were interviewed, using the same interview protocol employed at the pre-teaching stage for the group 1 students. Group 2 students had so far acted as no-treatment controls in order to examine the effect of the teaching intervention. This set of interviews served as post-teaching interviews for group 1 students and pre-teaching interviews for group 2 students.
Subsequent to the interviews, group 2 students participated in a set of five lessons similar to those given to group 1. Mr. X was, once again, the teacher. Group 2 students were then re-tested, using a parallel form of the original paper-and-pencil test, and re-interviewed by the researchers. The same semistructured interview protocol was employed once again.
More than 3 months after the post-teaching test was taken—the students had been on vacation and had not had any formal lessons on fractions—38 of the 40 participating students (two students, one from each group, had left the school)—took the parallel form of the paper-and-pencil test again as a retention test. A representation of the research design is shown in Table 1.
Table 1 Summary of the research design—timing and events
The intervention comprised five fraction lessons, involving six activities, which were aimed at enriching students’ concept images and fostering their understandings of fraction concepts. The design of the teaching intervention was grounded in Dienes’ (1960, 2007) dynamic principle. According to this principle, there are six temporally ordered stages involved in the formation of a new concept: the play stage, the games stage, the dictionary stage, the representation stage, the symbolization stage, and the formalization stage. In this study, we did not pay much attention to the play and formalization stages, given that the participating students were fifth graders and the length of the teaching intervention was limited.
The six activities for this study were carefully developed and trialed. Each was designed so that it would incorporate the unit fraction concept. Although the activities may have looked quite different, they incorporated the same conceptual structure. It was expected that as the students played the games and represented what they found in the activities, they would begin to discern “the common elements in many different embodiments of the same mathematics” (Dienes 2007, p. 8) and would become “aware of the essential sameness of the structure” despite the different outward appearances (Dienes 1960, p. 42). Summaries of the six activities are now given.
Activity 1: playing fractions baseball
Students were requested to form an equilateral triangle or a square on the floor, using a long piece of rope. Afterwards, they were invited to walk around the sides of the shape, from a nominated vertex in a nominated direction, a distance which should correspond to a fraction name (e.g., “one-third” or “two-fourths”) called by the teacher. The students were expected to explain how they associated the fraction names which were called out with the sides of the shape—the idea being to identify the fraction “whole” as the total distance around the triangle (or square). The activity was aimed at establishing, in the students’ concept images of unit fractions, the names of fractions like \( \frac{1}{2} \), \( \frac{1}{3} \), and \( \frac{1}{4} \) with positions around the perimeters of an equilateral triangle and a square.
Activity 2: pouring water
Working with their groups, students were requested to pour a full glass of water evenly into identical clear glasses with vertical sides and, by pouring, to figure out fractional amounts (like \( \frac{1}{2} \), \( \frac{1}{3} \), or \( \frac{1}{4} \)) of a full glass of water. Then, groups created stories involving pouring or sharing lemonade that corresponded to some given operations and comparisons of fractions (e.g., \( \frac{1}{3}+\frac{1}{3}+\frac{1}{3} \) = ___). This “capacity model” activity was intended to assist students to link fractions with the amount of fluid in a clear glass drinking container.
Activities 3 and 4: folding paper strips and a piece of rope
For activity 3, students needed to fold three narrow paper strips, which had the same length but different colors, separately into two, three, and four equal parts. Then, they utilized the folded paper strips to locate positions for fractions like \( \frac{1}{2} \), \( \frac{1}{3} \), and \( \frac{1}{4} \) on a number line drawn on a sheet of paper. During the fourth activity, two students who worked together were given a piece of rope (exactly 1 yard long) and three different-colored markers. They were asked to fold the piece of rope and, by folding, indicated exactly fractional amounts like \( \frac{1}{2} \), \( \frac{1}{3} \), or \( \frac{1}{4} \) of the piece of rope using the markers. These two linear model, number-line activities were expected to facilitate students’ understanding of fractions as measures of distances on a line.
Activity 5: developing a human number line
For the fifth activity, 13 students were evenly spaced in a straight line across the classroom, with one student (named “Mr Zero” or “Ms Zero”) remaining standing throughout the activity. The other 12 participating students, who had been denoted “\( \frac{1}{12} \),” “\( \frac{2}{12} \),” …, “\( \frac{11}{12} \),” and “\( \frac{12}{12} \),” were asked to crouch down. Afterwards, some of the students had to stand up, as appropriate fraction words (e.g., “five-twelfths”) were called out by the teacher or by an observing student. The other students (those not among the 13 “participating” students) in the class needed to check whether the “right” number of the 12 students (other than “Mr Zero” or “Ms Zero”) stood up when fraction names like “one-twelfth,” “five-twelfths,” and “nine-twelfths” were called.
For this activity, the “whole” was regarded as the distance from Mr Zero (or Ms Zero) to the student representing \( \frac{12}{12} \). Students were invited to state other “suitable” names for fractions like \( \frac{3}{12} \), \( \frac{6}{12} \), \( \frac{1}{6} \), \( \frac{12}{12} \), etc. Thus, for example, “\( \frac{6}{12} \)” might be named “\( \frac{1}{2} \)” or “\( \frac{3}{6} \),” and “\( \frac{9}{12} \)” might be named “\( \frac{3}{4} \).” Through this activity, students’ understanding of fractions as measures of distances on a line could also be strengthened.
Activity 6: sharing discrete blocks
Students were given 12 discrete identical blocks and were asked to share the blocks equally among two, three, and then four friends. Then they were also asked to place the blocks in a 4 by 3 array and to use “visual language” (e.g., “one row is like one-fourth”) when identifying \( \frac{1}{2} \), \( \frac{1}{3} \), and \( \frac{1}{4} \) of the 12 blocks. This activity was designed to help students associate the names of unit fractions with discrete numbers of objects, taking advantage of possible visual arrangements of the objects. The idea that the “whole” for this activity corresponded to the total set of 12 blocks was stressed.
Written tests and interview protocol
Some of the questions in the paper-and-pencil tests and in the semistructured interview protocol of this study were adapted from those used by Clements and Del Campo (1987) and Clements and Lean (1988, 1994). Each version of the test comprised 30 questions. The first nine questions were related to operations and comparison of fractions. In questions 10 through 28, students were asked to identify unit fractions that might be associated with (a) parts of the boundaries (perimeters) of regular polygons; (b) capacities relating to a cup of liquid; (c) lengths of ribbons; (d) number lines; (e) sets of discrete objects (apples, marbles, or blocks); and (e) areas of circles or rectangles. In the last two questions, students were asked to create stories of unit fractions. The Cronbach alpha reliabilities of the paper-and-pencil instruments were all between 0.85 and 0.90, and these were regarded as acceptable.
There were 12 questions included in the interview protocol: (a) The first question was intended to investigate students’ concept images of unit fractions; (b) questions 2 through 11 were used to assess students’ understandings of unit fractions represented by linear, perimeter, discrete, capacity, and area models; and (c) the last question was designed for the purpose of exploring students’ conceptual and procedural knowledge of operations of fractions.
The concept images of unit fractions of the fifth graders in this study were investigated by analyzing student responses to the first interview question and to seven questions on the pre- and post-teaching tests. For the first interview question, each student was requested to “say something, or draw something, or do something” in response to the word “one-third.” For the seven content questions, students needed either to provide explanations for their answers or to create stories related to unit fractions. Their explanations or stories, together with comments on the first interview question, especially those for which visual images were described, could be thought of as pointing to the students’ concept images of unit fractions.
Seven questions, from the first pre-teaching test, which generated data with respect to student concept images of unit fractions can be seen in Table 2. The first three tasks (questions 7, 8, 9) were context-free questions involving addition or subtraction of fractions. For the next two tasks (questions 19, 25), the capacity of a cup of water and a discrete set of apples were associated with fractions. The final two tasks (questions 29, 30) were open-ended, with students being invited to create and write stories concerned with \( \frac{1}{4} \) and \( \frac{1}{6} \), respectively. On the parallel post-teaching and retention forms of the test, those questions were numbered differently and the unit fraction in question 29 was changed from \( \frac{1}{4} \) to \( \frac{1}{3} \).
Table 2 Questions which generated data with respect to student concept images of unit fractions
The data collected were analyzed both quantitatively and qualitatively. The quantitative analyses involved running a series of t tests to examine null hypotheses and calculating Cohen’s (1988) standardized difference (Cohen’s d) effect sizes to determine the treatment effect on student performances on parallel paper-and-pencil tests. The use of t tests was legitimate given the random allocation to groups and the distributions of scores on the pre-teaching tests. Due to space limitations, precise statements of the null and research hypotheses, and a complete statement of the results of the quantitative analyses, are not reported in this paper—they can be seen in Zhang (2012). However, Fig. 1 summarizes mean scores of group 1 and group 2 students on the paper-and-pencil tests administered at different times.
Fig. 1
Group 1 and group 2 mean scores on pre-teaching, post-teaching, and retention tests
Figure 1 offers a striking pictorial confirmation of the effectiveness of the intervention lessons. Group 1’s mean performance improved in an educationally significant way immediately after the intervention, and most of what the students learned was retained. Although the average score of group 2 on the second pre-teaching test was slightly higher than its mean score on the first pre-teaching test—that could partly be attributed to a special needs student, whose test scores increased by 7 points, “unofficially” attending part of a few lessons designed for group 1 before taking the second pre-teaching test—most of group 2’s gain in mean performance occurred after the intervention, which was also retained.
At the pre-teaching stage, both groups had almost identical mean performance scores (which was expected, given the random allocation to treatment groups). At the retention stage, both groups once again had almost identical mean performance scores. Despite the small post-teaching/retention loss, the retention mean scores were clearly higher than the pre-teaching mean scores.
The design of the study, featuring random allocation to treatment and control groups, and the same teacher (“Mr X”) teaching all the lessons to both groups, enabled us to be confident that the improvement by group 1 and group 2 students on the post-teaching test had been caused by Mr X’s lessons. Each mean pre-teaching/post-teaching gain score or mean pre-teaching/retention gain score was statistically significant (from t test analyses) at the 0.05 level.
If the pre-teaching test mean scores were compared to post-teaching test mean scores, and then to retention test mean scores, the corresponding Cohen’s d effect sizes for group 1 were 1.16 and 0.76, and for group 2, (a) 0.77 and 0.64 if the first pre-teaching test mean score was involved, or (b) 0.58 and 0.44 if the second pre-teaching test mean score was utilized in the calculations.
An accepted criterion for deciding the magnitude of an effect size has been stipulated by Cohen (1988): An effect size of d = 0.20 corresponds to a small effect; d = 0.50, to a medium effect; and d = 0.80, to a large effect. Group 1’s effect sizes of 1.16 and 0.76 point to the effect of the intervention on group 1 post-teaching and retention tests having been large and between medium and large, respectively. Group 2’s effect sizes of 0.77, 0.58, and 0.64 point to the effect of the intervention on group 2 having been between medium and large. The effect size of 0.44 means that the effect of the intervention on group 2 retention test was between small and medium, where group 2’s second pre-teaching test mean score was used in the calculation of the effect size. These effects are impressive, especially considering that the students’ knowledge of fractions was very likely to decline over a summer vacation of more than 3 months.
Analyses of qualitative data
Qualitative data analyses were carried out on students’ written responses on tests and interviews, and questions in the students’ textbook. In order to investigate the students’ concept images of unit fractions, we analyzed their responses to questions 7, 8, 9, 19, 25, 29, and 30 on written tests and to the first interview question. If a student made comments mainly about how a pizza, or a pie, or a cake, or a circle, or a rectangle, or a square had been divided and shared (or shaded), it might reasonably be concluded that the student’s concept image of unit fractions was connected with an area model. If students drew a picture which could be identified as a non-area model such as a piece of rope, a cylindrical cup, a set of discrete objects, or a baseball diamond, to justify their answers or illustrate their stories, it would seem to be plausible to conclude that their concept images of unit fractions were linked with linear, capacity, discrete, or perimeter models. If terminology such as “number line” or “running around a baseball diamond” was employed in a student’s explanation or story, it could reasonably be concluded that a linear model or a perimeter model was part of the student’s concept image of a unit fraction.
In addition, the researchers analyzed sections on fractions in the mathematics textbook that the fifth graders in this study had used during their fifth-grade year. This text was Illinois Math Connects 5 (Altieri et al. 2009). Analysis focused on the goals laid down by the textbook authors that were to be achieved when a teacher teaches fraction concepts to grade 5 students, the specific fraction topics that grade 5 students were expected to learn, and the methods used for teaching fractions.
Results
Results of the qualitative analyses of textbook data
The publishers, Macmillan/McGraw-Hill, claimed that the textbook, Illinois Math Connects 5 (Altieri et al. 2009), offered a research-based curriculum developed by researchers and educators in mathematics education. The textbook was designed to meet Illinois Learning Standards for later elementary grades and was organized around NCTM’s (2006) Focal Points with the aim of preparing fifth-grade students for the Illinois Standards Achievement Test (ISAT). A description of the goals set in the textbook regarding student learning of fractions, the content of fractions covered, and the models or pictorial representations used in the book will now be presented.
The fractions objectives and content
Sections on fractions in Illinois Math Connects 5 were aimed at making fifth graders proficient in those fraction concepts and skills that NCTM (2000) identified as appropriate for learners in grades 3–5. The specific objectives set out in the textbook indicated that students at grade 5 should develop understandings of fraction concepts and learn to interpret fractions as parts of wholes, parts of sets, distances on a number line, and quotients of two whole numbers. They should grasp the concepts of mixed numbers and improper fractions. Students were also expected to compare and order fractions and add and subtract fractions by means of manipulatives, pictures, and symbolic representations.
There were three chapters on fractions in Illinois Math Connects 5: one was aimed at developing fraction concepts; the second one was concerned with comparing the sizes of fractions; and the third was about addition and subtraction of fractions. Each chapter set out individual lessons on a theme. Each lesson had a short introduction and then one to three model examples were presented; then followed a set of exercises related to the concepts or skills just presented and questions designed to provide practice for ISAT tests.
The externally set ISAT test was usually administered in March each year, near the end of the school year. Questions in the test for each grade are expected to be consistent with the Illinois Learning Standards. In order to be ready for the ISAT test, the participating fifth graders had already been taught the fractions content in the textbook before the time when the data collection for this research started. From the list of fraction topics in Altieri et al. (2009), it is noticeable that what the participating students had been expected to learn about fractions was much more extensive and difficult than the content involved in the written tests used for this research. Some of the questions extracted from the textbook by Altieri et al. (2009) which were marked as at fifth-grade level were listed below:
1.
Compare \( \frac{5}{6} \) and \( \frac{7}{9} \). (p. 405)
2.
A class survey showed that \( \frac{7}{15} \) of the class liked soccer, \( \frac{3}{10} \) liked tennis, and \( \frac{2}{5} \) liked baseball. Which sport was liked the least? (p. 406)
It might have been expected that most of the participating students would have already mastered mixed numbers, addition and subtraction of mixed numbers, and comparison among three fractions with unlike denominators. Given that most of the questions on the pre-teaching tests of this research involved unit fractions like \( \frac{1}{2} \), \( \frac{1}{3} \), and \( \frac{1}{4} \), one might also have expected that the participating students would have been able to answer all of them correctly.
Implied teaching approaches to fractions in the students’ textbook
The special role of visual models or representations in solidifying students’ learning of fraction concepts in grades 3–5 was emphasized in NCTM’s (2000) Standards. That document indicated that in third, fourth, and fifth grades, instructional time should be devoted to building up students’ conceptual understanding of fractions, and that this could be achieved through taking advantage of “a variety of models or representations” (p. 155). According to NCTM (2000):
1.
Representing numbers with various physical materials should be a major part of mathematics instruction in the elementary school grades. … Students’ understanding and ability to reason will grow as they represent fractions and decimals with physical materials and on number lines. (p. 33)
2.
Students can develop a deep understanding of rational numbers through experiences with a variety of models. … These models offer students concrete representations of abstract ideas and support students’ meaningful use of representations and their flexible movement among them to solve problems. (pp. 215–216)
Working from NCTM’s (1989) premises, the Illinois Learning Standards for Mathematics accepted the significance of concrete materials and pictorial representations in helping students learn fractions. Consequently, it was not surprising that models, pictures, and manipulatives or materials were extensively utilized in Illinois Math Connects 5. However, most of the pictures or manipulatives adopted in the textbook represented only one model, namely the area model.
Invariably, if such words as pizza, pie, cake, brownie, lasagna, etc. were included in fraction tasks, circles, rectangles, or squares would be drawn, and these would be partitioned and shaded (see Table 3). Even when objects, or contexts, had nothing to do with regions, they might still be represented using circles, rectangles, or squares. Six examples, from Altieri et al. (2009), are shown in Table 4. In the first three examples, the volume of an apple, a quart of punch, and a cup package of cheese were all represented by rectangles. In the last three examples, quantities of eggs were represented by rectangles, weights of grapes by \( \frac{1}{4} \) and \( \frac{1}{8} \) fraction tiles, and distances from home to school by \( \frac{1}{4} \), \( \frac{1}{6} \), and \( \frac{1}{12} \) fraction tiles. Altieri et al. (2009) typically used rectangles to indicate fraction tiles.
Table 3 Rectangular and circular food representations (from Altieri et al. 2009)
Most of the worked examples in Altieri et al. (2009) were modeled using rectangles or circles (see Tables 3 and 4). Even for lessons whose objectives were to “compare fractions and mixed numbers on a number line” (p. 350) and to “round fractions to 0, \( \frac{1}{2} \), and 1 using a number line” (p. 356), rectangles were still used to introduce and explain how to compare fractions and to illustrate the rules for rounding fractions. The teacher’s guide also recommended that fraction concepts and skills be taught via using fraction circles, fraction tiles, tenths grids, and hundredths grids, or by drawing pictures of circles and rectangles.
The reason why area models have been so extensively used in Illinois Math Connects 5 could be attributed to NCTM’s (2000) Standards document. Despite the fact that the document recommended that mathematics instructional time in the elementary school be primarily assigned to representing numbers with a variety of visual images, it also stated that the area model was likely to be the most beneficial to the learning of fraction concepts, especially in relation to comparing fractions and finding equivalent fractions:
By using an area model in which part of a region is shaded, students can see how fractions are related to a unit whole, compare fractional parts of a whole, and find equivalent fractions. (p. 150)
Visual images of fractions as fraction strips should help many students think flexibly in comparing fractions. (p. 216)
Meanwhile, it was clearly implied that the use of area models could help fifth graders to perform well on the ISAT test for mathematics. In a set of practice questions for ISAT designed to link to the Illinois Mathematics Assessment Framework for grade 5, there were five questions using models to represent fractions, and four of these involved an area model.
Pre-teaching groups’ mean scores and standard deviations
According to test results for the first pre-teaching test, 12 of the 40 participating students (30 %) scored less than or equal to 14 out of 28 (50 %), and 15 (37.5 %) scored at least 21 out of 28. With a total possible score of 28, group 1 had a mean of 18.0 (standard deviation 5.3), and group 2 had a mean of 17.7 (standard deviation 7.2). The mean for group 2 on the second pre-teaching test was 19.3 (standard deviation 5.8).
Entries in Table 5 indicate that students were good at shading and splitting circular and rectangular diagrams (questions 27 and 28). However, more than 30 % failed to provide correct answers for questions 10 through 26 for which unit fractions were associated with parts of boundaries (perimeters), capacities, lengths of ribbon, number lines, and discrete sets of apples or marbles. In addition, more than one-third of the students failed to simplify \( 1-\frac{1}{4} \) (question 7) correctly, and more than one-half did not simplify \( \frac{1}{2}+\frac{1}{4} \) (question 9) correctly.
Table 5 Summary of student performances (% correct) on pre-teaching tests based on types of tasks
Concept images suggested by pre-teaching test data
For questions 7, 8, and 9, most of the students offered explanations describing the processes of how they carried out the operations without any scenario being incorporated or any picture being drawn. However, there were two students in group 1, three students in group 2 and, later on, six more students in group 2 (when working on the second pre-teaching test) who drew pictures on their tests to explain why their answers made sense, with some of the pictures being accompanied by stories and contexts. All of the pictures sketched were circles, rectangles, or squares which were divided and shaded to illustrate how those tasks were solved. Examples of pictures drawn by students when responding to questions 7, 8, and 9 can be seen in Fig. 2.
Fig. 2
Students’ pre-teaching explanations in response to questions 7 through 9 (a–c)
In Fig. 2(a), the student wrote that he imagined a picture of a circle in his mind. The circle was then “evenly” cut into four pieces and three of them were shaded to represent \( 1-\frac{1}{4} \). In Fig. 2(b), in order to find out the value of \( 1-\frac{1}{2}-\frac{1}{2} \), the scenario of two friends sharing a pie was created. In Fig. 2(c), the value of \( \frac{1}{2}+\frac{1}{4} \) was figured out by combining square depictions of \( \frac{1}{2} \) and \( \frac{1}{4} \).
For questions 19 and 25, the fraction \( \frac{1}{4} \) was to be associated with a full cup of water and 12 apples. Despite the clearly defined contexts mentioned in the questions, some students still sketched circles, rectangles, or squares to represent the wholes of \( \frac{1}{4} \) (see Figs. 3 and 4).
Fig. 3
Students’ explanations in relation to question 19 (a–c)
Figure 3 shows that a cup of water was represented by a rectangle, a circle, and a square, and Fig. 4 reveals that 12 apples were represented as a circle divided into 12 sectors. These students’ concept images of fractional quantities were clearly related to area models, which were evoked even though words like water, cup, and apples had been used in the stimulus questions.
For questions 29 and 30, the students were requested to create stories regarding \( \frac{1}{4} \) (or \( \frac{1}{3} \) on pre-teaching test 2, for group 2) and \( \frac{1}{6} \). Stories revealed that the students’ concept images of unit fractions were mainly associated with area-model representations (circles, rectangles, or squares). Among the 40 participating students, only four linked the given unit fractions with a discrete, a linear, or a capacity model, and no student offered a story involving a perimeter model.
Each student’s written response for \( \frac{1}{3} \), \( \frac{1}{4} \), or \( \frac{1}{6} \) was classified as a category A response, or a category B response, or a category C response according to the following criteria:
If a student’s story was mainly about how a pizza, pie, or cake had been shared or divided, the story was regarded as a category A, “area-model” response—whether or not a picture was drawn to illustrate the story. Responses, in which any of the words “circle,” “rectangle,” or “square” were mentioned, or drawings of circles, rectangles, or squares were shown, were automatically regarded as category A responses, if it was clear that other models were not involved in their stories.
If a student’s story for \( \frac{1}{3} \), \( \frac{1}{4} \), or \( \frac{1}{6} \) referred to a number line or to pictorial representations which could be identified as linear, capacity, or discrete models, then that story was regarded as a category B response.
Category C responses were those for which it was almost impossible to identify unambiguously the models implied or there was no model indicated in the stories.
Some category A and category C responses and all category B responses are shown below. All of the pre-teaching category A and category C responses are shown in Appendix 1 and 2.
[A1] “Erin and Jonathan have eaten \( \frac{4}{8} \) of a cherry pie. Then Levi and Jessica eat \( \frac{1}{8} \) of the pie. Finally Keegan and Hayley eat \( \frac{2}{8} \) of the pie. How much pie is left?”
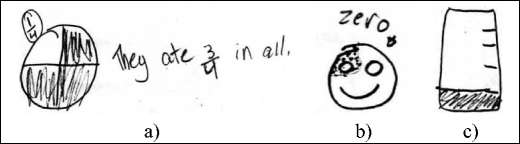
[A2] “Sally had a pizza that had 4 equal slices. She wanted to share the pizza with 2 of her friends. All of them ate 1 slice. How much pizza was left?” [The accompanying pictorial response is shown in Fig. 5(a).]
Fig. 5
Pictures that students drew to illustrate their stories for \( \frac{1}{4} \) (a, b)
[A3] “Sam drank \( \frac{1}{5} \) amount of water how much water would be left [?] \( \frac{1}{4} \) amount of water would be left” [see Fig. 5(b)].
[B1] “Think of it [\( \frac{1}{6} \)] as half of \( \frac{1}{3} \) a little bigger than \( \frac{1}{8} \) same as \( \frac{2}{12} \) or \( \frac{3}{18} \) you don’t use it a lot It’s close to the beginning of a number line”.
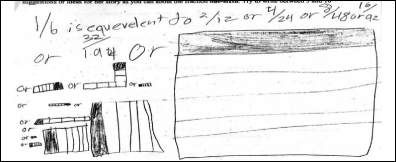
[B2] “\( \frac{1}{6} \) can be turned into \( \frac{2}{12} \), \( \frac{4}{24} \), \( \frac{8}{48} \), \( \frac{16}{96} \), etc. You can turn it into a problem or a different problem it is another of the first of fractions I learned” [see Fig. 6].
[B3] “Kyra had a crate of apples filled \( \frac{2}{3} \) full. Then she gave her sister \( \frac{1}{6} \) of the apples. Kara also ate \( \frac{1}{6} \) of the apples which now means that the crate of apples is \( \frac{1}{3} \) full” [Fig. 7(a)].
Fig. 7
Students’ stories for \( \frac{1}{3} \) and \( \frac{1}{6} \) (a, b)
[B4] “ Ivy had 6 oranges. She gave \( \frac{1}{6} \) of them to her friend Isabelle. How many oranges did she give to Isabelle?” [Fig. 7(b)]
[C1] “Nathan and Ashton went to buy 9 apples. It cost five dollars. When they came back to the Danty, Ashton ate \( \frac{1}{3} \) of the apples Nathan ate \( \frac{1}{3} \) of the apples, so together they ate \( \frac{2}{3} \) of the apples. Koletin sneaked over there and stole \( \frac{1}{3} \) of the apples so now all the apples are gone”.
[C2] “One sixth can be changed into different numbers. You can add subtract multiply and divide to it. You can change it to \( \frac{2}{12} \) or \( \frac{1}{6} \) or 0. You can do anything”.
Concept images suggested by pre-teaching interview data
Pre-teaching interview results revealed that circles were mainly associated with the students’ mental images of one-third, as seen in the following representative student responses to the first interview request (“I’m going to say a word, and I want you to say something, write something, or do something as a result of the word which I say. Here’s the word: … ‘One-third’”.).
[a1] “I am thinking of a circle split into three pieces”.
[a2] “A part of like a circle. A third of a circle”.
[a3] “equal third of a circle”.
[a4] “Circle who has lines that shows one third, area”.
[b1] “A pie cut into three slices”.
[b2] “Pizza, someone eat one-third”.
[b3] “I tried to make an equal thing. Then have that for pepperoni slices. Then shade it in for that corner ate. That is the one you ate”.
[c1] “Somebody is drinking a one-third of water. A third is gone. It is like math. It is easy to see stuff. [How will you draw a picture to show one-third?] Draw a circle and have one third. [How do you know split this circle like this way?] I have done this in class. It is like a peace sign”.
[c2] “One-third of my cousins are boys. My cousins are one-third of boys. [You drew a circle. How did you know you should split the circle that way?] She [Mum] taught me to draw one-third like that. She said it is kind of like a peace sign. My Mum also explained it as rectangular. She cut it into 3 pieces”.
[d1] “A little bit less than half. Out of three parts, one part of it”.
[d2] “It is less than half. It is more than one-fourth”.
[d3] “A candy bar. How you cut it into thirds”.
[d4] “A quarter, part of, like since this is fractions. Quarter is one-fourth of a dollar”.
With the first four responses ([a1], [a2], [a3], [a4]), a circle was mentioned to describe how they thought of one-third; in the next three responses ([b1], [b2], [b3]), circular foods were referred to; with responses [c1] and [c2], interviewees were thinking of noncircular objects, but their associated visual imagery still involved circles. In [c2], the interviewee also added that her Mum taught her how to split a rectangle into three pieces. A rectangle was also used to represent the object in this response—“One third of one whole. Potatoes. Like Rectangular. Cut them in thirds”.
In the last four responses ([d1], [d2], [d3], [d4]), no model representing one-third could be identified, because the comments were made without any picture being drawn. In these instances, it was very difficult to know what visual imagery was being associated with one-third. The first two responses indicated that the students made a comparison between one-third and one-half or one-fourth. In [d3], the object, a candy bar, could be considered as linear or as a rectangular shape. In [d4], one-fourth, instead of one-third, was mentioned by the student who might have thought of one-fourth as the same as one-third. In another interview, a student said that one-third could be illustrated by dividing a picture into four parts and then shading one part, because 4 is close to 3: “It is easier if you draw a picture. … I split it up into four, close to 3. Shade one”.
Analyses of interview data reinforced what had been found by analyzing pre-teaching written test responses. Most students’ concept images of unit fractions were dominated by area-model considerations. Many students directly responded to the word “one-third” by describing or drawing a circular picture. Some students’ responses disclosed that they had very limited conceptual understandings of unit fractions.
Post-teaching groups’ mean scores and standard deviations
Analysis of post-teaching test data indicated that only 3 of the 40 participating students (7.5 %) scored less than 15 out of 28, and 33 (82.5 %) scored at least 21 out of 28, with 5 obtaining 26 and 6 obtaining 27. The mean scores on the post-teaching tests were 23.2 for group 1 and 22.6 for group 2, and the standard deviations were 3.3 and 5.4, respectively.
As can be seen in Table 6, at the post-teaching stage, group 1 and group 2 students performed much better than at the pre-teaching stage on questions 10 through 26 in which unit fractions were represented using perimeter, capacity, linear, and discrete models—on average, more than 75 % of the post-teaching answers given by the students to the tasks were correct. The students’ performances on tasks involving addition and subtraction of fractions were also much better at the post-teaching stage than at the pre-teaching stage.
Table 6 Summary of student performances (% correct) on post-teaching tests based on types of tasks
Concept images suggested by post-teaching test data
Results indicated that at the post-teaching stage, the participating students were able to select and apply a variety of models when engaging with tasks involving unit fractions. Their concept images of unit fractions were linked to capacity, perimeter, linear, and discrete models, as well as to area models.
When explaining their answers to question 7 (“\( 1-\frac{1}{4} \) = ▭”), question 8 (“\( 1-\frac{1}{2}-\frac{1}{2} \) = ▭”), and question 9 (“\( \frac{1}{2}+\frac{1}{4} \) = ▭”), some students provided pictorial explanations. At the pre-teaching stage, all diagrams sketched in response to these tasks were circles, rectangles, or squares which were divided and shaded. Such representations were regarded as evidence that the students were thinking in terms of “area models.” However, at the post-teaching stage, the contexts of playing baseball and sharing glasses of water were incorporated into students’ explanations and into their pictorial representations, and it was assumed that these provided evidence that “perimeter” or “capacity” models were associated with students’ thinking about unit fractions (see Fig. 8).
Fig. 8
Examples of written and pictorial explanations in relation to questions 7 and 8 (a–d)
In Fig. 8(a), for example, in order to find the value of \( 1-\frac{1}{4} \), a student created a scenario involving someone running around a baseball diamond with the four sides of a rhombus being thought of as 1 whole. In Fig. 8(b), the student imagined a glass of water as a whole and this was shared between two people so that nothing was left. In Fig. 8(c, d), no written scripts were provided, but in each case a full glass of liquid was drawn and then some portions of it were shown as being taken away.
For questions 19 and 25, the students were asked to reflect on the meaning of \( \frac{1}{4} \) in relation to a full cup of water (question 19) and 12 apples (question 25). Analysis of diagrams drawn on the post-teaching test scripts revealed that the students tended to adopt the natural association of \( \frac{1}{4} \) with capacity and discrete models, rather than revert to area-model considerations.
Of the 40 students, at the pre-teaching stage, seven students drew a glass of water when responding to question 19 (“What fraction of it would be left after \( \frac{1}{4} \) of a cup of water was drunk?”), but at the post-teaching stage, this number increased to 19. Of the 40 students, 9 students (or 12 students if group 2’s second pre-teaching test was considered) sketched 12 small circles or sticks on the pre-teaching test to represent the whole in question 25 (“How many apples would be left if one-fourth of them were given away?”), but 19 students did so on the post-teaching test. Although “a cup of water” and “12 apples” were mentioned in the actual wording of the two problems, at the pre-teaching stage, less than 24 % of the students drew a cup or 12 discrete objects to depict the wholes; corresponding percentages were almost 50 % at the post-teaching stage.
With questions 29 and 30, the students were asked to make up stories focusing on \( \frac{1}{3} \) (or \( \frac{1}{4} \) on parallel forms of the test) and \( \frac{1}{6} \). On pre-teaching tests, mostly area-model responses were given to these requests; among 40 participating students, only four supplied pictorial representations of the unit fractions that could be reasonably linked to discrete, linear, or capacity models; no perimeter model was identified in any response at that stage. On post-teaching tests, however, various models, including perimeter models, were utilized in the students’ stories and area-model responses were given much less frequently.
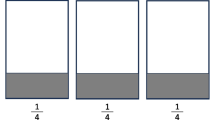
At the post-teaching stage, many students thought about fractions in terms of the capacity model. Figure 9(a) reproduces a “story” in which \( \frac{2}{3} \) of a cup of water was drunk and \( \frac{1}{3} \) of the cup of water was left. A full cup and one-third of a cup of water were sketched. In Fig. 9(b), a student, in creating a story about \( \frac{1}{4} \), mentioned that \( \frac{1}{4} \) is equal to \( \frac{2}{8} \) and \( \frac{4}{16} \), and then drew three cylinders and divided and shaded them to show \( \frac{1}{4} \), \( \frac{2}{8} \), and \( \frac{4}{16} \). In Fig. 9(c), \( \frac{5}{6} \) and \( \frac{1}{6} \) of a cup of lemonade were drawn to indicate what the student drank and what his brother spilled.
Fig. 9
Capacity model was employed to illustrate students’ stories of \( \frac{1}{3} \), \( \frac{1}{4} \), and \( \frac{1}{6} \) (a–c)
At the post-teaching stage, students also liked to describe how they cut or folded a piece of rope, string, or ribbon to represent the fractions \( \frac{1}{3} \), \( \frac{1}{4} \), and \( \frac{1}{6} \) (see, e.g., Fig. 10). In Fig. 10, a student described how a piece of string was folded to get sixths—the piece of string was considered as a whole, folded three times to get thirds, and then folded again to form six equal parts.
Some students’ stories were also developed by placing unit fractions on a number line. For instance, in Fig. 11(a), the student mentioned that \( \frac{1}{6} \) is smaller than \( \frac{1}{2} \) due to the denominator being bigger.
Fig. 11
Number line, balloons, and baseball field were used in stories of \( \frac{1}{4} \) and \( \frac{1}{6} \) (a–c)
Discrete and perimeter models were also applied to embody unit fractions. For example, in Fig. 11(b), four small circles were crossed out to show that \( \frac{1}{4} \) of the 16 balloons disappeared. In Fig. 11(c), a baseball field was mentioned and the story was about running \( \frac{1}{6} \) of the way around the baseball field.
Overall, the main message arising out of the post-teaching qualitative analyses of students’ responses to the seven questions was that the fractions lessons had enriched the participating students’ concept images of fractions. Before the intervention lessons, the students primarily used, and depended on, circular, rectangular, or square area-model representations, with these being created, divided, and shaded to embody unit fractions. After the instructional intervention, a variety of embodiments such as perimeters of baseball diamonds, capacities of glasses, lengths of pieces of string, and sets of discrete objects systematically displayed in arrays, were created and used to represent unit fractions. These findings will be further substantiated through analyzing students’ post-teaching interview data.
Concept images suggested by post-teaching interview data
Analyses of post-teaching interview data showed that in response to the word “one-third,” students mentioned a third of a glass of lemonade or water, one side of an equilateral triangle, one-third of the area of a circle or a rectangle, the position of one-third on a number line, one part of three equal parts of a string, or one-third of 12 cubes. This was in sharp contrast to responses during pre-teaching interviews, when most responses involved circles or circular food (e.g., pizzas) or drawing and shading circular regions. The following are some pertinent quotations from post-teaching-interviews:
[a1] “Lemonade. We had this vitamin water zero and squeeze lemonade, and two friends are over. I have to split it up into thirds”.
[a2] “A glass of water filled one-third full”.
[a3] “Like drinking lemonade and water”.
[a4] “Pour something, like when you are making food, you have to put cups in it”.
[a5] “Pouring lemonade”.
[a6] “Fraction. A part of something. One third of like a glass of water. The glass filled up one-third full of water. [What else?] Makes me think of a number line. ‘Greater than, less than.’ A number line with all the fractions on it. Lower than one-third or higher than one-third. … One-fourth is less than one-third; one-half is greater than one-third”.
[b1] “I think of a triangle ‘cos it has three thirds. Each time you go to different point, you go one-third of a way around. It is made up of thirds. If you go one part around, it would be one-third. You go another, you go another third. You keep going one-third”.
[b2] “A triangle, it has three sides and one of the sides would be one-third”.
[b3] “A part of triangle. One of the sides. A triangle has three parts. One-third would be one of the parts”.
[b4] “Less than half. Dividing things into three parts. [In what way?] What you have to do is to fold it. You can fold it into a triangle, put both sides”.
[b5] “Less than one half. [If I ask you to draw something, what would you draw?] A circle, 3 pieces colored one-third. [What else?] I would draw a triangle, go around it”.
[c1] “A third of a circle or something. Draw a circle which equals one whole, divide it into three equal parts, this is one-third. It is equivalent to 1/18, something has eighteenth as denominator, equals to 6/18. 1/3 of like, 12 divided by 3 is 4, a third of 12 would be 4, a third of 12 cubes”.
[c2] “One third, three equal bits of string. [A string with one-third marked was drawn]”.
[c3] “Draw a cup, color up one-third of the way. 2/6, just times 2, 1/3 times 2 is 2/6. There is five lines. Draw a box, put 5 lines inside of it, fill in 2 of them and make 2/6. Draw another line again, making a whole”. [The pictures drawn can be seen in Fig. 12(a).]
Student responses like one-third of a glass of lemonade or water, or pouring lemonade and water, were regarded as belonging to a category (see excerpts a1–a6, above). Some students incorporated the word “one-third” into their comments and associated the fraction with lemonade or water ([a1], [a2], [a6]); others made reference to lemonade, water or pouring without saying “one-third” ([a3], [a4], [a5]). In [a6], the student also referred to a number line, imagined unit fractions on the number line, and compared one-third with one-fourth and one-half on it.
In a second category (see excerpts b1–b5, above), a triangle was mentioned. Some students stated that a triangle has three sides and one side would be one-third ([b1], [b2], [b3]). Others only commented on forming a triangle through folding or going around a triangle without providing more explicit explanations ([b4], [b5]).
In a third category, references were made to a third of 12 cubes, a third of a piece of string, or a third of a cup (see excerpts c1–c3, above). In [c1], the student made mention of a circle divided into three equal parts with one part treated as one-third, and a third of 12 cubes being equal to 4 cubes. In [c2], the student made reference to a third of three equal parts of a piece of string and drew a piece of string with one-third labeled on it. In [c3], the student commented on a third of a cup and a third of a rectangle and drew the pictures shown in Fig. 12(a). Figure 12(b, c) shows two other students’ pictorial representations of one-third: A circle was divided into three equal parts with one of them shaded, a triangle with one side selected was sketched, one cube out of three cubes was marked, and a rectangle split into three parts was drawn.
In summary, the post-teaching interview comments pointed to much broader concept images of unit fractions having been developed as a result of the instructional intervention. Students could verbally point out a variety of objects associated with one-third—in relation to a cup of lemonade or water, the boundary of an equilateral triangle, a piece of string, or a set of cubes—and make use of pictorial representations to illustrate one-third of those objects. By contrast, during pre-teaching interviews, the students primarily talked about circular objects like pizzas, circular pies, or circles, and drew and shaded pictures involving circular regions.
In addition, it is interesting to point out the ways that students answered the second interview question, when they were asked to fold a piece of string to show one-third of it. During pre-teaching interviews, many students struggled to locate one-third of a piece of string. Some of them knew there should be three pieces, but had no idea of how to get one-third of the piece of string. However, post-teaching interview data revealed that after the intervention lessons the students connected one-third to one side of an equilateral triangle; they tended to fold the piece of string into the shape of an equilateral triangle and identify one side out of the three sides as one-third. Commentary on how the students responded to the interview question asking them to show how to get one-third of a piece of string before and after the intervention lessons is provided in the following excerpts:
[Pre-T-1] “One-third was a little bit before one-half”.
[Post-T-1] “If you make an equilateral triangle and then fold them, if you follow them, then you would get one-third of it, like right there would be one-third”.
[Pre-T-2] “I noticed it is three pieces. Half is right here. It can be a little bit off. It cannot be half, right here”.
[Post-T-2] “You can do an equilateral triangle. To check it, you could fold the sides in”.
[Pre-T-3] “One-third is less than half, this is half, one-third may be right here. [Can you fold it?] Three times. This is one-half, fold it again, this is fold it into one-third. This is 0 and this is 1, right here. I fold it in half and fold it again”.
[Post-T-3] “Be three equal parts, made it into a triangle”.
[Pre-T-4] “Fold it over again [He was not sure of what he is doing.]”
[Post-T-4] “Fold it into a triangle first”.
Clearly, the intervention lessons helped students to broaden and enrich their concept images of unit fractions and thereby to deepen their understandings of fraction concepts.
As stated before, retention test data were gathered after the students’ summer vacation—more than three months after the post-teaching test data were obtained. Between the post-teaching assessments and the retention assessment, students received no formal instruction on fractions. Quantitatively speaking, the mean performances for the two groups on the retention test were slightly below the means on the post-teaching tests, but well above the pre-teaching test means. For a full analysis of retention data, see Zhang (2012).
Of relevance to this paper was the fact that analyses of concept image data from the retention test yielded almost identical results to those at the post-teaching stage. It appears highly likely that the relatively brief teaching intervention had irrevocably influenced the students’ concept images with respect to unit fractions.
Conclusions and discussion
In the students’ textbook (Altieri et al. 2009), no matter which contexts were associated with fraction tasks, the illustrations shown mainly involved circles, rectangles, or squares. Analyses of pre-teaching test and interview data disclosed that at the pre-teaching stage, area-model embodiments of unit fractions were strongly preferred by most students. The consistency between students’ concept images of unit fractions and how the fractions were represented diagrammatically in the textbook suggests that the textbook had not only dictated which content had been covered in the classroom (Barr 1988), but also how the students had come to think about that content. The prevalence of area-model strategies for illustrating fractions in the textbook probably explains the students’ preference for this model.
After the fifth graders had participated in the instructional intervention, they were found to have developed more holistic concept images of unit fractions. They were willing and able, without prompting, to make reference to a variety of embodiments like boundaries of regular polygons, pieces of string, number lines, cylindrical glasses, and discrete objects when representing unit fractions.
The incorporation of multiple embodiments into the fractions lessons not only enriched the concept images of the participating students, but also improved their performances on written tests and strengthened their conceptual understandings of unit fractions. After the teaching intervention, statistically significantly more group 1 and group 2 students were able to provide correct responses to questions 10 through 28 associated with different embodiments of unit fractions. That indicated that after the intervention, the students were beginning to be capable of integrating the various representations of unit fractions into an abstract construct which could be separated from the process that produced it (Sfard 1991).
Analyses of post-teaching interview data also pointed to much more unified conceptual understandings of fractions having been developed by the participants. At the post-teaching stage, when responding to interview questions, many students were able to associate the unit fraction \( \frac{1}{2} \) (or \( \frac{1}{3} \) or \( \frac{1}{4} \)) with one of the 2 (or 3 or 4) equal parts of a whole, irrespective of what the whole involved in the question was.
At the post-teaching stage, group 1 and group 2 students were also able to perform much better than at the pre-teaching stage on questions 7, 8, 9, 19, and 25 which were concerned with the addition and subtraction of fractions. At that stage, they were also able to offer reasonable explanations of how they figured out their answers. For instance, the percentage of group 1 students who correctly answered question 25—“Suppose Jessica had 12 apples, but she gave one-fourth of them to her brother. How many apples would she have had left?”—at the pre-teaching stage was 45 % and the percentages of group 2 students who gave correct responses on the first and second pre-teaching tests were 55 % and 40 %, respectively; however, on the post-teaching test, 85 % of group 1 students and 75 % of group 2 students correctly answered the question. It appeared that a level of instrumental understanding had been achieved and a degree of relational understanding had been, or was being, reached. The students were utilizing both conceptual and procedural knowledge when implementing the operations and developing an understanding of how and why mathematical procedures work. They were building up structural, abstract conceptions of unit fractions (Sfard 1991).
At the post-teaching stage, in response to the last interview question, “What is the value of three times one-third?,” many students not only carried out an appropriate operation correctly but also were able to justify their answers conceptually. The students were developing conceptual and procedural understandings of the concept of one-third and of the operation “three times” and were able to transfer from objects to processes, and vice versa (Sfard 1991).
The findings from this study support Dienes’ (1960, 2007) assertions regarding multiple embodiment. Dienes maintained that the same mathematical structure should be presented through a variety of materials. The materials were to appear to be different, but structurally speaking, there was to be something in common. The quality of conceptual learning is likely to be maximized when students are exposed to “the process of discerning the common elements in many different embodiments of the same mathematics” (Dienes 2007, p. 8).
We believe that our analysis suggests that teachers, textbook writers, and mathematics curriculum developers might shift their attention to representing unit fractions away from area-model representations of unit fractions toward multiple embodiments. In this study, the pre-teaching curriculum emphasis on area-model approaches seemed to generate concept images of unit fractions which resulted in students learning much about drawing and shading circles, rectangles, and squares, but without developing sound conceptual understandings of the mathematical concepts and subconcepts that define unit fractions.
Nevertheless, it would be rash to overgeneralize from the results of the study. Considering that there were only 40 participating students together with their normal mathematics teacher, some critics might question whether the outcomes of the study would be representative of what might occur if larger or different samples were involved. Given that only five lessons were taught to each group, individuals might wonder whether the outcomes of the study might have been even better had the intervention period been longer. Further teacher-intervention studies on student knowledge of unit fractions are needed, with more participating students, and a longer period of intervention. It would also be useful to produce a similar study with other students and their normal classroom teachers involved, or to investigate the effects of using different teachers with different classes, but the same lesson plans.
Because random sampling procedures were applied when allocating the students to group 1 and group 2, ecological validity could have been compromised. The random allocation to groups, resulting in students no longer being in their normal classes, could have introduced unforeseen effects. That said, the results which have been reported here are sufficiently promising to call for replication studies and for studies which pay greater attention to issues raised in this paper.
References
Altieri, M. B., Balka, D. S., Day, R., Gonsalves, P. D., Grace, E. C., Krulik, S., Malloy, C. E., Molix-Bailey, R. J., Santa Cruz, R. M., Silbey, R., & Vielhaber, K. (2009). Illinois math connects 5 (Vol. 1–2). Columbus: Macmillan/McGraw-Hill.
Behr, M. J., Harel, G., Post, T., & Lesh, R. (1992). Rational number, ratio and proportion. In D. Grouws (Ed.), Handbook of research on mathematics teaching and learning (pp. 296–333). New York: Macmillan.
Bell, M., Bretzlauf, J., Dillard, A., Hartfield, R., Isaacs, A., McBride, J., Pitvorec, K., & Saecker, P. (2002). Everyday mathematics: the University of Chicago School Mathematics Project. Chicago: Everyday Learning Corporation.
Bright, G. W., Behr, M. J., Post, T. R., & Wachsmuth, I. (1988). Identifying fractions on number lines. Journal for Research in Mathematics Education, 19(3), 215–232.
Carpenter, T. C., Coburn, M. K., Reys, R. E., & Wilson, J. (1976). Notes from national assessment: addition and multiplication with fractions. Arithmetic Teacher, 23, 137–141.
Clements, M. A., & Del Campo, G. (1987). Fractional understanding of fractions: variations in children’s understanding of fractional concepts, across embodiments (grades 2 through 5). In J. D. Novak (Ed.), Proceedings of the Second International Seminar on Misconceptions and Educational Strategies in Science and Mathematics (Vol. III, pp. 98–111). Ithaca: Cornell University Press.
Clements, M. A., & Lean, G. A. (1988). “Discrete” fraction concepts and cognitive structure. In A. Borbas (Ed.), Proceedings of the Twelfth Annual Conference of the International Group for the Psychology of Mathematics Education (Vol. I, pp. 215–222). Veszprem: International Group for the Psychology of Mathematics Education.
Dienes, Z. P. (2007). Some thoughts on the dynamics of learning mathematics. In B. Sriraman & L. D. English (Eds.), The Montana Mathematics Enthusiast (pp. 1–118). Missoula: The University of Montana.
Gould, P. J. (2005). Year 6 students’ methods of comparing the size of fractions. In P. Clarkson, A. Downton, D. Gronn, M. Horne, A. McDonough, R. Pierce, & A. Roche (Eds.), Building connections: theory, research and practice. Proceedings of the 28th annual conference of the Mathematics Education Research Group of Australasia (pp. 393–400). Melbourne: Mathematics Education Research Group of Australia.
Gould, P. J. (2008). Children’s quantitative sense of fractions. Unpublished PhD dissertation, Macquarie University, Australia
Hirsch, C. R., Lappan, G., & Reys, B. (2012). Curriculum issues in an era of common core state standards for mathematics. Reston: National Council of Teachers of Mathematics.
Lamon, S. J. (2005). Teaching fractions and ratios for understanding: essential content knowledge and instructional strategies for teachers (2nd ed.). Mahwah: Lawrence Erlbaum Associates.
Mack, N. K. (1995). Confounding whole-number and fraction concepts when building on informal knowledge. Journal for Research in Mathematics Education, 26(5), 422–441.
Moss, J., & Case, R. (1999). Developing children’s understanding of the rational numbers: a new model and an experimental curriculum. Journal for Research in Mathematics Education, 30(2), 122–147.
National Council of Teachers of Mathematics. (2000). Principles and standards for school mathematics. Reston: National Council of Teachers of Mathematics.
National Council of Teachers of Mathematics, (1989). Curriculum and evaluation standards for school mathematics. Reston: National Council of Teachers of Mathematics.
National Council of Teachers of Mathematics, (2006). Curriculum focal points for kindergarten through grade 8 mathematics: a quest for coherence. Reston: National Council of Teachers of Mathematics.
Samsiah, Hjh bte Haji Damit (2002). Fraction concepts and skills of some primary six pupils in Brunei Darussalam. Unpublished M. Ed thesis, Universiti Brunei Darussalam.
Sfard, A. (1991). On the dual nature of mathematical conceptions: reflections on processes and objects as different sides of the same coin. Educational Studies in Mathematics, 22, 1–36.
Tall, D., & Vinner, S. (1981). Concept image and concept definition in mathematics with particular reference to limits and continuity. Educational Studies in Mathematics, 12, 151–169.
United States Department of Education. (2008). The final report of the National Mathematics Advisory Panel. Retrieved from http://www.ed.gov/about/bdscomm/list/mathpanel/ report/final-report.pdf
Vinner, S., & Dreyfus, T. (1989). Images and definitions for the concept of function. Journal for Research in Mathematics Education, 20(4), 356–366.
Vinner, S., & Hershkowitz, R. (1980). Concept images and common cognitive paths in the development of some simple geometrical concepts. In R. Karplus (Ed.), Proceedings of the 4th International Conference of the International Group for the Psychology of Mathematics Education (Vol. 1, pp. 177–184). Berkeley: International Group for the Psychology of Mathematics Education.
Zhang, X. (2012). Enriching fifth-graders’ concept images and understandings of unit fractions. Unpublished PhD dissertation, Illinois State University.
The authors would like to thank Mr. X and his students for their enthusiastic participation in this study. We would also thank Dr. Jeffrey Barrett and Dr. Jennifer Tobias for their support and constructive advice.
Author information
Authors and Affiliations
Department of Mathematics, Illinois State University, Normal, IL, 61790-4520, USA
Xiaofen Zhang, M. A. (Ken) Clements & Nerida F. Ellerton
The list of all category A responses (by grade 5 students) at the pre-teaching stage
1.
“Erin and Jonathan have eaten \( \frac{4}{8} \) of a cherry pie. Then Levi and Jessica eat \( \frac{1}{8} \) of the pie. Finally Keegan and Hayley eat \( \frac{2}{8} \) of the pie. How much pie is left?”
2.
“Mark ordered a pizza for his friends and him. They ordered pineapple on it. Mark ate \( \frac{1}{4} \) of the pizza. His 3 friends ate the rest. Mark and his friends were stuffed after they ate”.
3.
“Once upon a time there were three kids named Billy, Joe, and Timmy. It was Timmy’s birthday and his Mom bought him a cake. The kids all fought over who would get the most birthday cake. Then Billy figured out that they could each have one third of the cake. And they lived happily ever after”.
4.
“You could write about \( \frac{1}{6} \) is not needed any more or there is no circle to go with \( \frac{1}{6} \) so she had to go with the square”.
5.
“\( \frac{1}{6} \) is equivalent to \( \frac{2}{12} \) or \( \frac{4}{24} \) or \( \frac{8}{48} \) or \( \frac{16}{96} \) or \( \frac{32}{194} \) or…” [The accompanying pictures are shown in Fig. 13.]
Responses regarded as belonging to category A (continued)
6.
“Sally had a pizza that had 4 equal slices. She wanted to share the pizza with 2 of her friends. All of them ate 1 slice. How much pizza was left?” [The accompanying picture is shown in Fig. 14(a).]
Fig. 14
Pictures that students drew to illustrate their stories for \( \frac{1}{4} \) (a–c)
“There once was a number called \( \frac{1}{4} \). He had a friend named zero. Zero didn’t like \( \frac{1}{4} \) of him because it was covered in freckles and the rest of him wasn’t. But, \( \frac{1}{4} \) was like zero’s \( \frac{1}{4} \) of his face without the freckles. So zero asked \( \frac{1}{4} \) to be the last part of his face. \( \frac{1}{4} \) said he’d do it. Now, \( \frac{1}{4} \) won’t ever get lonely and will always be living on his friend’s face”. [The accompanying picture can be seen in Fig. 14(b).]
8.
“Sam drank \( \frac{1}{5} \) amount of water how much water would be left [?] \( \frac{1}{4} \) amount of water would be left” [see Fig. 14(c)].
Appendix 2
The list of all category C responses (by grade 5 students) at the pre-teaching stage
1.
“Mary needed about \( \frac{1}{4} \) of [a glass of] water but she got a whole glass of water So Tom subtracted \( \frac{3}{4} \) and he got \( \frac{1}{4} \) of [a glass of] water”.
2.
“Nathan and Ashton went to buy 9 apples. It cost five dollars. When they came back to the Danty, Ashton ate \( \frac{1}{3} \) of the apples Nathan ate \( \frac{1}{3} \) of the apples, so together they ate \( \frac{2}{3} \) of the apples. Koletin sneaked over there and stole \( \frac{1}{3} \) of the apples so now all the apples are gone”.
3.
“I would tell her: You walk downstairs and get a treat. You eat \( \frac{1}{6} \) of the treat. You leave it out on a plate for the next day. You see your dog eat \( \frac{1}{6} \) of your treat. Then you eat another \( \frac{1}{6} \) of your treat. You eat the rest of your treat and then you walk back upstairs to watch TV”.
4.
“One sixth can be changed into different numbers. You can add subtract multiply and divide to it. You can change it to \( \frac{2}{12} \) or \( \frac{1}{6} \) or 0. You can do anything”.
5.
“Once long ago \( \frac{1}{4} \) was a 0, because he wasn’t born yet of course. There were already 3 family members in his family. Then when he was born he had become the fourth person in their family. That is when he got his name: \( \frac{1}{4} \)”.
6.
“You could make a story about a boy that is making a tree house and he needs a \( \frac{1}{6} \) size so he goes to the hardware store”.
7.
“Once there was a man. However he really was \( \frac{1}{4} \) of a man. He would eat \( \frac{1}{4} \) of everything he even had \( \frac{1}{4} \) of a house. One day he went to jail for robbing \( \frac{1}{4} \) of a bank. ”
Zhang, X., Clements, M.A.(. & Ellerton, N.F. Enriching student concept images: Teaching and learning fractions through a multiple-embodiment approach.
Math Ed Res J27, 201–231 (2015). https://doi.org/10.1007/s13394-014-0137-4