
Abstract
Reliability of a recommender system is extremely substantial for the continuity of the system. Malicious users may harm the reliability of predictions by injecting fake profiles called shilling attacks into the system. Therefore, the detection of such attacks is vital for a recommender system. Thus, many shilling attack detection methods have been studied. However, the proposed solutions work only on numerical rating based recommender systems. On the other hand, it has been shown that collaborative filtering systems utilizing binary ratings are also vulnerable to shilling attacks. In this work, we propose a detection method, which finds out six well-known shilling attack models against binary ratings-based collaborative filtering systems. Besides deriving generic attributes from user profiles, we generate additional model-specific attributes in order to deal with fake profiles. Our empirical results show that the proposed method successfully detects attack profiles even with low attack size and filler size values.
1 Introduction
Information technologies improve very fast, and they introduce essential services for individuals’ daily life. Since any person utilizing such services faces a considerable amount of data, service providers focus on solutions for simplifying users’ effort. Recommender systems are one of the critical components of provided solutions, and they have efficient techniques for dealing with a massive amount of available data (Jiang et al. 2018). Individuals can employ recommender techniques in the decision-making process, and they can find out relevant suggestions from a vast amount of possible choices. Collaborative filtering (CF) is one of the recommendation techniques which produce accurate recommendations.
CF methods focus on the relationship among users’ preferences. Therefore, correlations between people are key instrument during the recommendation process. If any CF algorithm finds those relations successfully, the accuracy level of the method will increase (Lee 2019). Although utilizing user correlations provides constructing appropriate neighborhoods, it causes a drawback for CF algorithms. Any person who aims to manipulate a CF system’s outcomes can insert fake profiles which are designed to be in the neighborhood of actual users. Creating fake profiles and inserting into a recommender system is called as shilling attacks and recent studies mention that CF systems are very vulnerable to such attacks (Gunes et al. 2014).
Shilling attackers convince users by manipulating popularities of items (Williams et al. 2007). Also, they may cause the users to become displeased and the enterprises to lose reputation and money. In order to get rid of the damages of the shilling attack profiles, some detection methods have been developed (Si and Li 2018). However, the provided solutions focus on finding out the fake profiles only for CF systems employing numeric ratings (e.g., 1–5 stars).
On the other hand, sometimes it is preferable to know whether a customer likes an item or not more clearly, instead of knowing the degree of how much that user likes the item. In this case, companies ask for binary values (e.g., like/dislike). Today’s most popular streaming service NetflixFootnote 1 gives users the option to rate TV shows and movies with a “thumbs up” (to indicate that the content is liked) or “thumbs down” (to indicate that the content is disliked). Also, the worlds biggest video sharing website YouTubeFootnote 2 prefer to collect ratings in the same manner. Besides, they are just some examples of major content providers that favored thumbs over stars and shifted from a numerical rating system to a binary rating one.
Thus, a service provider might utilize CF techniques based on binary ratings. With this purpose, researchers propose recommendation techniques for binary rating-based recommender systems (Miyahara and Pazzani 2000). Kaleli and Polat (2013) proposed binary versions of mostly known shilling attack types and show that similar to the CF algorithms with numerical ratings, binary rating-based CF systems are also vulnerable to shilling attacks. Thus, binary rating oriented shilling attacks need to be detected. Even though there are many studies on shilling attack detection in numeric data, these methods can not be directly used to detect binary shill profiles since binary versions of mostly known shilling attack types are different from their numeric forms in detail. The only work which focuses on detecting shill profiles in binary data is (Batmaz 2015), in which a rule-based approach is used to find out the bogus profiles by utilizing four generic attributes. Since attackers are able to use particular purpose attacks (Si and Li 2018), a shilling attack detection method considering whole possible attacks is still a need.
Binary preferences provide a way for presenting tastes of users over predictions. Therefore, binary rating-based CF algorithms are designed for producing predictions over binary data. Since such methods are also vulnerable to shilling attacks, detection of these attack profiles is a requisite. In this work, we focus on how to design a detection methodology for binary shilling attack types. We provide a classification-based approach which extracts out the shill profiles in binary data before the recommendation process. Our classification approach utilizes six generic and four model-specific attributes generated from attack profiles. Our contributions to the literature can be listed as follows:
A classification-based method for shilling attack detection in binary data is proposed.
Considering generic attributes used in existing numerical shilling attack detection methods, new generic attributes for binary rating-based attack models are proposed.
New model-specific attributes are proposed for attack models utilizing binary ratings. Moreover, one of the existing generic attributes for binary data is converted into a model-specific attribute.
To the best of our knowledge, it is the first study that model-specific attributes are utilized for detecting binary rating-based shilling attacks.
The rest of our paper is organized as follows. Section 2 briefly presents the existing shilling attack detection methods. Section 3 gives a piece of short information about well-known shilling attack models in binary data. Our proposed method is given in Sect. 4. The experimental works are discussed in Sect. 5. Section 6 presents our conclusions and future works.
2 Related work
In a recommender system, reliability of referrals is vital. Therefore, service providers have to employ provided solutions in order to cope with the effects of shilling attacks. Recently, detection of attack profiles has become a very popular research topic, and several attack detection algorithms have been proposed and these methods can be categorized as statistical-based approaches (Bhaumik et al. 2006; Gao et al. 2014; Xia et al. 2015), clustering (Mehta and Nejdl 2009; Bilge et al. 2014; Yang et al. 2017), classification (Chirita et al. 2005; Burke et al. 2006a, b; Mobasher et al. 2006; Williams et al. 2007; He et al. 2010; Zhou et al. 2016) and other techniques (Mehta et al. 2007; Zhang et al. 2018a).
Statistical outcomes are used for finding out attack profiles. Bhaumik et al. (2006) proposed a method based on statistical anomaly detection. Time intervals-based approach was proposed to detect anomaly by considering rating distributions in different time intervals (Gao et al. 2014). A dynamic time interval segmentation approach based on item anomaly detection was proposed for attack detection (Xia et al. 2015).
In addition to statistical approaches, unsupervised learning is utilized for identifying attack profiles. Mehta and Nejdl (2009) used the similarity structure of shill profiles to distinguish them from authentic ones utilizing dimensionality reduction. Bisecting k-means clustering algorithm was employed to detect bogus patterns considering their specific generation strategies in (Bilge et al. 2014). Soft co-clustering-based approach was proposed in order to detect fake profiles (Yang and Cai 2017). Zhang et al. (2018b) propose an unsupervised method based on hidden Markov model and hierarchical clustering. An unsupervised detection model based on the rated item correlation is proposed by Chen et al. (2018b). Cai and Zhang (2018) propose an unsupervised approach that exploits item relationship and target items for attack detection.
Classification-based approaches utilize several features derived from attack profiles in order to detect shill profiles. Since shill profiles are generated utilizing a certain strategy, they are similar to each other. Moreover, attack profiles have their characteristics. For these reasons, generic and model-specific attributes derived from attack profiles are utilized for attack detection. Firstly, some generic attributes were proposed by Chirita et al. (2005) to classify a fake profile correctly. Additional generic attributes, some of them are extended forms of the attributes in Chirita et al. (2005), and model-specific attributes are utilized for attack detection (Burke et al. 2006a, b; Williams et al. 2007). Moreover, the segment focused attributes were proposed by Mobasher et al. (2006). Rough sets theory-based approach was applied to classify attack profiles truly (He et al. 2010). Zhang and Zhou (2014) proposed an online method called as HHT-SVM by classifying profiles with SVM utilizing extracted Hilbert spectrum-based features from profiles. Zhang and Zhou (2015) propose an ensemble detection model (EDM) by introducing backpropagation neural network and ensemble learning technique to detect profile injection attacks through selecting and integrating parts of the base classifiers using voting strategy. In another work, Zhang and Chen (2016) illustrate the effectiveness of ensemble method for detecting shilling attacks based on ordered item sequences (EMDSA-OIS) which use simple majority voting strategy to combine the predictive results of multiple C4.5-based classifiers. A method based on SVM and target item analysis called as SVM-TIA was proposed to identify attack profiles (Zhou et al. 2016). Yang et al. (2016) apply a variant of Boosting algorithm, called the re-scale AdaBoost (RAdaBoost) as an attack detection method, which turns out to be highly effective in harder scenarios as imbalanced classification. Later, Yang et al. (2017) formulate the problem as finding a mapping model between rating behavior and item distribution and developed a detector based on the trained model. Hao et al. (2018) proposed a multiview ensemble method to detect shilling attacks in collaborative recommender systems. Chen et al. (2018a, c) proposed the rated item correlation measurement, and show that real and malicious users can be distinguished effectively by considering the rated item correlation in the supervised learning frameworks. Wu et al. (2018) propose a hybrid semisupervised learning model for spammer detection to leverage both the users’ characteristics and the user-product relations. Yang et al. (2018) propose a shilling attack detection method called BayesDetector to detect spammers, which utilizes matrix factorization and user embedding to construct the implicit features and applies latent label information generated by Bayesian model to update the implicit features.
Even though there are lots of shilling attack detection methods for recommender systems, only Batmaz (2015) focuses on detecting binary versions of shill profiles. Four detection attributes were proposed, and a rule-based approach was utilized in order to recognize bogus binary profiles. Most of the attributes offered in work (Batmaz 2015) were derived based on modifying the ones proposed by Chirita et al. (2005). Our work differs from Batmaz (2015) in terms of proposed attributes, utilized method and used experimental methodology.
There is still a need in the literature regarding binary shilling attack detection, especially with low filler and attack size values. Therefore, we aim to identify fake profiles before producing recommendations utilizing some generic and model-specific attributes for binary data. Consequently, our proposed method is the first one which introduces model-specific attributes for detecting binary rating-based shilling attack models.
3 Shilling attacks
The goal of shilling attacks is effectively manipulating outcomes of a CF system. General structure of a shilling attack profile is given in Fig. 1. A shilling attack profile is constructed by four partitions as \(I_S\), \(I_F\), \(I_t\) and \(I_{\emptyset }\). \(I_S\) represents a set of selected items which specifies characteristics of the attack, whereas \(I_F\) symbolizes a set of filler items which obfuscates detectability of an attack (Gunes et al. 2014). \(I_t\) is the targeted item which will be attacked. Remaining unrated items construct \(I_{\emptyset }\). The symbols \(\delta\), \(\sigma\) and \(\gamma\) represents the functions which specify how ratings should be assigned to the items for \(I_S\) and \(I_F\) and \(I_t\), respectively.
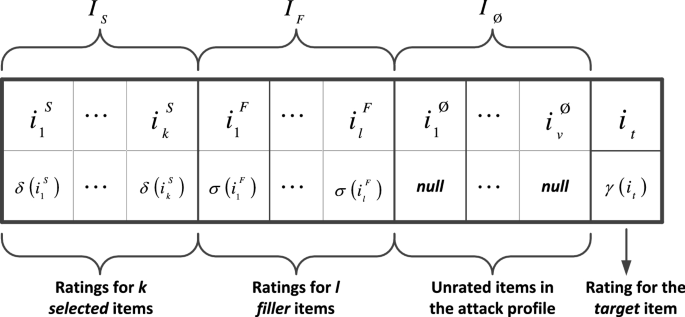
General form of an attack profile (Bhaumik et al. 2006)
Shilling attack models are categorized in different dimensions such as attackers’ intends, and required knowledge (Gunes et al. 2014). Attack models are grouped as nuke or push attacks according to the attackers’ intent. Push attack models try to increase the popularity of a target item, whereas decreasing popularity of a target item is the goal for nuke attack types. Shilling attack types are classified as high knowledge required (HKR) and low knowledge required (LKR) attacks according to needed knowledge about the recommender system. Kaleli and Polat (2013) proposed binary forms of six well-known shilling attack models as random attack (RA), average attack (AA), bandwagon attack (BA), reverse bandwagon attack (RBA), segment attack (SA) and love/hate attack (LH). Their properties and generation strategies for binary ratings are presented in Table 1.
4 Detecting shilling attack profiles for binary data
The success of CF techniques depends on user preferences. However, collecting user preferences might cause a weakness that is malicious users who want to manipulate the results of the system on behalf of their advantages might try to insert fake profiles. The possibility of having a malicious user makes CF techniques to be vulnerable to shilling attacks. Hence, for the reliability of the system, shill profiles should be detected. In order to identify shill profiles and decrease their damages against CF techniques employing binary data, we propose a classification-based detection algorithm. Our proposed method aims to label each pattern as either part of an attack or a genuine one utilizing some generic and model-specific features. Generic attributes are derived using statistical signatures of attack profiles. Model-specific features are obtained utilizing characteristics of attack models. Notations included in the equations of the attributes that were used in the paper is shown in Table 2.
4.1 Generic attributes
Basic descriptive statistical features of shilling attack profiles diversify attack profiles from genuine patterns. In this part, we describe the utilized generic attributes based on mathematical descriptions of attack profiles. Since existing numeric generic attributes (Mobasher et al. 2007) cannot be directly used in detecting binary data-oriented shill profiles, and binary versions of shill profiles are different from their numeric forms in detail (Kaleli and Polat 2013), we proposed new attributes for identifying malicious binary profiles. We inspired by existing numeric generic attributes (Chirita et al. 2005; Burke et al. 2006a); also we directly use some binary attributes from the work (Batmaz 2015).
We list the utilized generic attributes as follows:
Average difference from mode (ADMode) We propose ADMode attribute for binary data, inspired by rating deviation from mean agreement attribute (Chirita et al. 2005). The metric can be adapted to binary ratings by utilizing each profile’s average difference per item instead of the average mean from each item’s mean. ADMode is used for recognizing attack profiles by viewing the profile’s average difference per item, weighted by the inverse of the number of ratings given to that item. ADMode attribute can be computed for user u as given in Eq. 1.
$$\begin{aligned} ADMode_{u}= \frac{\sum _{i=0}^{N_{u}}\frac{c_{i}}{R_{i}}}{N_{u}}. \end{aligned}$$(1)Difference from mode (DMode) We propose DMode attribute for binary profiles inspired by the weighted degree of agreement attribute (Burke et al. 2006a) by utilizing items’ modes instead of their means. DMode can be evaluated as the numerator part of ADMode, and it can be computed for user u as given in Eq. 2.
$$\begin{aligned} DMode_{u} = \sum _{i=0}^{N_{u}}\frac{c_{i}}{R_{i}}. \end{aligned}$$(2)Weighted difference from mode (WDMode) Aiming to derive WDMode, we modify weighted rating deviation from mean agreement attribute (Burke et al. 2006a) for binary data. The metric can be adapted to binary ratings by utilizing each profile’s weighted difference per item mode instead of weighted agreement for each item’s mean. Even though WDMode is similar to ADMode, it is more precise to anomalies. WDMode balances effects of densely voted items and sparse ones more precisely than ADMode by dividing the difference values with squared values of the number of votes given to the items instead of summation of them. The WDMode attribute can be computed for user u as given in Eq. 3.
$$\begin{aligned} WDMode_{u} = \frac{\sum _{i=0}^{N_{u}}\frac{c_{i}}{{R_{i}}^2}}{N_{u}}. \end{aligned}$$(3)Similarity with top-N neighbors (avgSim) Batmaz (2015) shows that degree of similarity with other users attribute (Chirita et al. 2005) can be used for binary data by utilizing binary similarity measures. Since attack profiles are generated by employing a certain strategy, it is inevitable that the profiles are similar to each other. In this study, we utilize a binary version of the Pearson correlation coefficient (PCC) similarity measure to find out correlations between users. The metric can be computed as in Eq. 4.
$$\begin{aligned} avgSim_{u} = \frac{\sum _{v=1}^{v=N}w_{uv}}{N}. \end{aligned}$$(4)Weighted similarity with top-N neighbors (WavgSim) The strategy utilized in the degree of similarity with co-rated factor (DegSim’) (Burke et al. 2006a) is applied to avgSim aiming to derive WavgSim attribute. WavgSim provides decreasing effects of the neighbors with a few numbers of co-rated items for a user. In order to specify the mentioned neighbors, a threshold value d is used. The metric is computed as in Eq. 5.
$$\begin{aligned}&\begin{Bmatrix} w_{uv}' = w_{uv}\times \frac{\left| I_{uv} \right| }{d},&if \left| I_{uv} \right| < d \\ w_{uv}' = w_{uv}&otherwise \end{Bmatrix}\nonumber \\&\qquad \quad WavgSim_{u} = \frac{\sum _{i=1}^{i=N}w_{uv}'}{N}. \end{aligned}$$(5)Length variance (LengthVar) (Burke et al. 2006a) LengthVar computes the variation of a user profile’s length across the average length of all user profiles. Since LengthVar is independent of the type of data, it can be directly used with binary ratings. The metric can be computed as given in Eq. 6.
$$\begin{aligned} LengthVar_{u} = \frac{\left| N_{u} - \overline{U} \right| }{\sum _{k=0}^{U}\left( N_{k} - \overline{U} \right) ^2}. \end{aligned}$$(6)
4.2 Model-specific attributes
Existing studies show that generic attributes provide more successfully detection with increasing filler size values (Burke et al. 2006a; Mobasher et al. 2006). Even though the ratings are binary, distinguishing the fake profiles from genuine ones causes unsuccessfully when filler size values are greatly decreased (Batmaz 2015). Identifying bogus patterns with too small filler size values from cranky but authentic patterns is extremely hard. Attack models are characterized depending on their partitions such as \(I_F, I_S\), and \(I_t\). Shilling attack profiles designed for numeric data have significant characteristics which are enough to be identified. In order to deal with attack profiles with smaller filler size values, model-specific features were proposed and utilized in addition to generic features (Burke et al. 2006b; Williams and Mobasher 2006; Williams et al. 2007). With model-specific attributes, partitions of a user profile are discovered aiming to maximize the profile’s similarity with a known attack model type. Existing studies show that model-specific attributes improve the success of the detection method (Burke et al. 2006b; Williams and Mobasher 2006; Williams et al. 2007).
In order to increase detection performance, we propose some model-specific attributes for random and average attack models by considering the signatures of attack models. When design strategies and partitions of binary rating-based attack models are discussed, it is hard to specify model-specific features for the segment and love–hate attacks due to the possibility of user profiles’ rating values acutely split up the partitions. Ratings in each partition do not vary. Thus, it makes it harder to produce attributes which are specific to them.
As like in numerical data, we grouped a user profile into three partitions as \(P_{uf}, P_{ut}\) and \(P_{u\emptyset }\). The set \(P_{u\emptyset }\) contains all unrated items for a profile. The set \(P_{ut}\) includes all the suspected target items, which are rated as either 0 (for nuke attack types) or 1 (for push attack types). All the remaining rated items construct the set \(P_{uf}\). With the help of attack-specific metrics, \(P_{uf}, P_{ut}\) and \(P_{u\emptyset }\) sets approximate to \(I_F, I_S \cup I_t\) and \(I_\emptyset\), respectively.
4.2.1 Average attack model-specific attributes
Since filler items in binary average attack model are filled with their mode values, there is a strong positive correlation between filler items’ ratings and their mode values. We derive two metrics utilizing the mentioned property.
Filler mode unlikability (FMU) We propose FMU inspired by filler mean difference metric (Williams and Mobasher 2006) by utilizing modes of items instead of their means. FMU computes averages of the differences between filler items’ ratings and their corresponding mode values. Since filler items are filled with the mode values of corresponding items, the value of the metric will be expected to be 0 for an average attack profile. FMU can be computed for a user profile \(P_u\) as in Eq. 7.
$$\begin{aligned} FMU_{u,p_{target}\in P_{ut}} = \frac{\sum _{i \in (P_u -(P_{ut} \cup P_{u\emptyset })) } c_i }{\left| P_u - P_{u\emptyset } \right| - 1} = \frac{\sum _{i \in P_{uf}}c_i}{\left| P_{uf} \right| }. \end{aligned}$$(7)Filler mode correlation (FMC) Since filler items of an average attack profile for binary data are voted as the mode values of the corresponding items, votes of the filler items are positively correlated with their corresponding modes. Considering these characteristics of average attack profiles, we propose a new attribute, FMC. FMC value is expected to be 1 for an average attack profile in terms of PCC. FMC can be computed for a user profile \(P_u\) as given in Eq. 8.
$$\begin{aligned} FMC_{u,p_{target}\in P_{ut}} = \frac{\sum _{i \in (P_u -(P_{ut} \cup P_{u\emptyset })) } W_i }{\left| P_u - P_{u\emptyset } \right| - 1} = \frac{\sum _{i \in P_{uf}}W_i}{\left| P_{uf} \right| }. \end{aligned}$$(8)
In order to detect average attack profiles with smaller filler and attack size values, the metrics obtained from optimal partitioning for a profile \(P_u\) are utilized. Firstly, FMU value is computed for each suspected target item (\(p_{target}\)) belonging to the set \(P_{ut}\), iteratively. FMU value is computed on filler items in \(P_{uf}\) which includes all rated items except \(p_{target}\). Then, the partitioning providing the lowest FMU value is determined as an optimal one. Then, FMC is derived using the optimal partitioning and utilized as a detection attribute. These metrics are computed twice one for nuke intend, and one for push intend.
4.2.2 Random attack model-specific attributes
Filler item filling strategy of a random attack profile for binary ratings differs from the one for numeric data. Filler items are filled randomly depending on a uniformly randomly generated number. Since the number is generated uniformly randomly, the number of 1s and the number of 0s belonging to \(I_{F}\) are close to each other. By utilizing this property, we derive a metric named as Filler Dissimilarity in User Profile. Moreover, the vote and a mode value of each filler item will be expected to be lowly correlated depending on the randomness. Besides, FMC is also utilized as a random attack model-specific attribute differently.
Filler dissimilarity in user profile (FDUP) Dissimilarity in user profile (DUP) metric (Batmaz 2015) was proposed as a generic attribute to measure variance in a binary user profile. However, DUP is more significant for the random attack model depending on its filler item filling strategy. Thus, we reinterpret DUP to adapt it to a random attack model and named it as FDUP. Since filler items’ ratings are generated randomly, it is expected that the average difference value between each rating belonging to filler items set and the mode value of the corresponding set is closer to 0.5. FDUP can be computed for a user profile \(P_u\) as in Eq. 9.
$$\begin{aligned} FDUP_{u,p_{target}\in P_{ut}} = \frac{\sum _{i \in (P_u -(P_{ut} \cup P_{u\emptyset })) } c_m }{\left| P_u - P_{u\emptyset } \right| - 1} = \frac{\sum _{i \in P_{uf}}c_m}{\left| P_{uf} \right| }, \end{aligned}$$(9)where \(c_m\) is 0 if the rating for a filler item is equal to the mode value of \(P_{uf}\), otherwise it is 1.
As like in the average attack model, FDUP and FMC values obtained from optimal partitioning for a profile \(P_u\) are used with classification purpose for random attack model. Firstly, FDUP value is computed for each suspected target item (\(p_{target}\)) belonging to the set \(P_{ut}\), iteratively. FDUP value is computed on filler items in \(P_{uf}\) which includes all rated items except \(p_{target}\). Then, the partitioning which provides the higher variation is chosen as the optimum one. Then, FMC is computed using the optimum partitioning and utilized as a detection attribute. These metrics are computed twice one for nuke intend, and one for push.
5 Experimental works
Several experiments are conducted on a real data set in order to show the effectiveness of the proposed detection method. These experiments are grouped into three sets. In the first group of experiments, information gain values are computed to show the efficacy of the proposed attributes. In the second group of experiments, the effects of some dimensions such as attack size and filler size which affect the success of attack profiles over the performance of the proposed methods are presented. Attack size represents the percentage of attack profiles across all authentic profiles, whereas filler size is the ratio of the number of filled cells of an attack profile to the number of items in the system. Number of attack profiles effects cost/benefit analysis of attacks (Lam and Riedl 2004). Thus, attack size values more than 1% are infeasible for real-life applications (Morid et al. 2014). Thus, trials are performed regarding varying filler size values when attack size is 1%. In the third group of experiments, the offered method is compared with Batmaz’s work (Batmaz 2015). Since Batmaz’s work (Batmaz 2015) is the only work in binary attack detection, it is considered as a baseline.
5.1 Data set and evaluation criteria
Real data sets which represent binary preferences of users for recommendation task are not available. Real public binary data sets represent users interactions with items such as whether a user buys a product or listens to a song rather than their tastes. Thus, researchers utilize real public numeric datasets in order to obtain binary preferences of users (Miyahara and Pazzani 2000; Kaleli and Polat 2013; Verstrepen 2015). In this work, we employ the MovieLens public (MLP) real data set to get binary preferences. MLP is one of the well-known real numeric data sets, which includes 100,000 evaluations for 1682 movies from 943 users. Ratings in MLP are discrete values in the interval [1, 5] in which 1 represents the lowest rating and 5 indicates the highest one. We apply the procedure in work (Miyahara and Pazzani 2000) to MLP in order to convert numeric preferences to binary ones. Hence, to interpret users’ preferences in terms of binary tastes, the ratings lower than three are transformed into 0 (disliked) and remained ratings are identified as 1 (liked).
To measure the classification accuracy of the proposed method, precision and recall metrics are used in the evaluation. Let the number of attack profiles classified as true is named as true positives (TP), and false positives (FP) represents the number of misclassified genuine profiles. Assume that the number of misclassified attack profiles are called as false negatives (FN). Then precision and recall values can be computed as follows:
5.2 Experimental setup
During experiments, the employed data set is divided into two parts in a ratio of 1/3 and 2/3 for training and testing, respectively. A methodology which is similar to the one used in the work (Williams et al. 2007) is utilized while conducting the train set. Attack profiles, which are varied in filler size values from 3 to 100% and attack size values from 0.5 to 1% for push and nuke intends, are inserted into the authentic users’ data separated for training purpose. Randomly chosen movies among the ones which have between 50 and 100 ratings are used as target items. Training set for the classifier is constructed by inserting an attack model with a particular filler and attack size values to the authentic users. Then, the classification attributes are computed for attack and authentic profiles. The procedure repeated 21 more times for the remaining attack models and only the attributes computed from attack profiles are inserted into the original detection attributes. For training the classifier, 14 detection attributes are utilized:
Six generic attributes: ADMode, DMode, WDMode, avgSim (\(\hbox {N}=25\)), WavgSim (\(\hbox {N}=25\), \(\hbox {d}=50\)), and LengthVar
Four average attack model-specific attributes (two for push and two for nuke): FMC, FMU
Four random attack model-specific attributes (two for push and two for nuke): FDUP, FMC
After generating detection attributes for the training set, the entries are labeled as either ’authentic’ or ’attack’ for classification purpose. Binary classifiers are constructed over the training attributes set. Two supervised learning algorithms as k nearest neighbor (\(k\hbox {NN}\)), and support vector machines (SVM) are utilized for comparison. \(k\hbox {NN}\) classifier is constructed on 20 nearest neighbors using Euclidean distance with inverse distance weighting. SVM classifier is trained with default values as defined in Matlab R2017b, except the kernel function, which is used as a radial basis function. All classifiers and experimental results are created using Matlab R2017b.
For testing, attack profiles are generated with a fixed attack size as 1% and varying filler sizes from 3% to 100% as 3%, 5%, 10%, 15%, 20%, 30%, 40%, 60%, 80%, 100%. Trials are performed for each of the eight attack types (RA to push, RA to nuke, AA for pushing, AA for nuking, BA, RBA, SA, and LH). The experiments are repeated for each randomly chosen 50 target items according to the intended.
5.3 Experimental outcomes
5.3.1 Efficacy of the proposed attributes
Table 3 shows the proposed attributes and corresponding information gain values over the training data. According to the results, the highest information gain values belong to ADMode, DMode, WDMode attributes. Since users generally vote a few items in real life applications, LengthVar is another distinguishing attribute especially when filler size value is too high. Model-specific attributes also provide high information gain values, and it is concluded that better detection results could be obtained. Moreover, information gain values for the modified attributes are near to information values of the original numeric attributes which are shown in study (Burke et al. 2006a). Therefore, even though the original attributes for numeric ratings are adapted for binary ratings, modified attributes still provide high information gain over binary data. Additionally, newly proposed model-specific attributes provide information gain over binary data as high as the modified model-specific attributes.
5.3.2 Performance of the proposed method
In order to demonstrate the performance of the proposed method, some experiments are performed for varying filler size values for 1% attack size. To increase the legibility of the values in the figures, experimental outcomes which stay the same are not shown for filler size values larger than 60% for some of the figures. Figure 2a shows results of the \(k\hbox {NN}\) classifier with derived attributes for various attack types in terms of precision. As it is seen, AAPush, AANuke, LH profiles are distinguishable from authentic profiles even with low filler sizes. For remaining attack model types, the same success is obtained for filler size values larger than or equal to 10%. Since filler items are voted with the mode values of corresponding items, AA profiles are successful in terms of manipulating target item’s preference (Kaleli and Polat 2013). The filler item filling strategy causes AA profiles to be highly distinguishable from authentic ones. The derived attributes considering mentioned property provides AA profiles to be detected successfully. With increasing filler size values, the strategy utilized to determine attributes becomes more obvious. Thus the performance of the proposed method detects all of the attack profiles belonging to any attack type in terms of precision.

Effect of filler size for various attack types with \(k\hbox {NN}\) classifier

Effect of filler size for various attack types with SVM classifier
Figure 2b represents the performance of the \(k\hbox {NN}\) algorithm with proposed attributes for varying filler sizes in terms of recall. As it is seen, all the attack profiles for each attack model are detected perfectly for filler size values larger than or equal to 15. Increasing filler size values improve the performance of the proposed method for all attack types in terms of recall. Even though filler sizes are too small, very high recall values can still be obtained for AA profiles. When Fig. 2a, b are compared; it is observed that precision values are higher than recall values for filler sizes smaller than 15%. The reason for such result may be caused by \(k\hbox {NN}\) algorithm which depends on determined neighbors based on the chosen distance metric. Since attack profiles are so similar due to their certain design strategies, their attributes are also alike. As a result, precision values are higher.
Performance of SVM classifier with proposed attributes are shown in Fig. 3a, b in terms of precision and recall, respectively. It is observed from Fig. 3a, attack profiles for each attack type become more detectable with increasing filler sizes. Precision values reach 0.67 with filler sizes larger than 10% for all attack models, except SA. Especially AA profiles are more distinguishable comparing with other attack models’ profiles in terms of precision, even though filler size is so small due to the previously mentioned reasons.
As it is obvious in Fig. 3b, recall values are improved with increasing filler sizes for each attack model with SVM classifier. For filler size values larger than or equal to 10%, perfect recall values are obtained for all attack types, except SA. Even though filler size values are too small, AA profiles are still successfully detectable in terms of recall.
Since SVM classifier is based on matching profiles signatures with decision space instead of similarity, recall values of the classifier are higher than precision values. When all the results are analyzed, it is observed that \(k\hbox {NN}\)-based classifier is more successful than SVM-based classifier with proposed attributes due to their learning algorithms. Because of attack profiles are generated with a particular strategy, they tend to be similar to each other. This situation causes their nearest neighbors to consist of different attack profiles. The result why \(k\hbox {NN}\) is more successful than SVM with proposed attributes especially in terms of precision is caused by the neighborhood.
5.3.3 Comparison with the baseline algorithm
In order to show the success of our proposed method, we compare our experimental results with the baseline’s outcomes. However, the detection method and experimental methodology used in the baseline work is different than ours, hence comparing baseline’s preliminary results directly with ours would not be reliable. Thus, to make the results comparable, we conduct an extra set of experiments by applying the baseline’s attributes to our method with our methodology.
Figure 4a, b shows the performance of the baseline’s attributes in terms of precision and recall, respectively. The figures are presented to allow comparison of our detection attributes with the baseline’s attributes in attack detection. Since \(k\hbox {NN}\) is more successful than SVM as discussed before, the attributes are used with \(k\hbox {NN}\) classifier. When Fig. 2a is compared with Fig. 4a, it is seen that the proposed attributes beat the baseline’s attributes in attack detection for all attack types in terms of precision. Moreover, it is obvious that attack types except AA are not successfully detected with low filler size values using the baseline’s attributes. The performance of the attributes in attack detection is deficient for SA and LH profiles. When Fig. 2b is compared with Fig. 4b, it is clear that the proposed attributes are more successful than the baseline’s attributes in terms of recall for all attack models especially for low filler size values. As a brief, the proposed algorithm is dominant for precision and recall. It is seen that the proposed algorithm overpowers the baseline’s algorithm in attack detection especially with low filler and attack size values. The baseline’s algorithm suffers from low filler and attacks size values. Moreover, the baseline’s algorithm cannot handle with SA and LH profiles even though filler size values are high.

Effect of filler size for various attack types with \(k\hbox {NN}\) classifier using attributes offered in (Batmaz 2015)
6 Conclusion and future work
E-commerce sites should ensure reliable recommendations in order to satisfy their customers. Shilling attack profiles damage the reliability of a recommender system by manipulating popularities of items. Thus, lots of researchers proposed methods to detect shill profiles in numeric data. Existing works show that binary versions of shilling attack types can damage the reliability of binary recommendations. Therefore, detecting and removing binary shill profiles before the recommendation process is substantial for a binary ratings oriented recommender system. With this purpose, we propose a classification-based approach to identify shill profiles in binary data. We propose several generic attributes by considering the statistical characteristics of the attack types. Moreover, model-specific attributes are derived for random and average attack types to deal with the low attack and filler size values.
In our experiments, we utilize \(k\hbox {NN}\) and SVM classifiers. According to our empirical results, the performance of the proposed method improves with increasing filler size values for both \(k\hbox {NN}\) and SVM. Due to the specific characteristic of average attack type, it is detected successfully even though filler size is too low. Since attack profiles are generated with a particular strategy, they are similar to each other. This is why similarity based \(k\hbox {NN}\) classifier is more successful in detecting shill profiles with proposed attributes compared to SVM. To the best of our knowledge, model-specific attributes are firstly used for binary ratings-based attack detection.
Adapting the proposed method/attributes for detecting attack profiles in distributed collaborative filtering systems utilizing binary ratings is our future work.
References
Batmaz Z (2015) Shilling attack design and detection on masked binary data. Master’s thesis, Anadolu University, Turkey
Bhaumik R, Williams C, Mobasher B, Burke R (2006) Securing collaborative filtering against malicious attacks through anomaly detection. In: Proceedings of the 4th workshop on intelligent techniques for web personalization, Boston, MA, USA
Bilge A, Ozdemir Z, Polat H (2014) A novel shilling attack detection method. Proc Comput Sci 31:165–174
Burke R, Mobasher B, Williams C, Bhaumik R (2006a) Classification features for attack detection in collaborative recommender systems. In: Proceedings of the 12th ACM SIGKDD international conference on knowledge discovery and data mining, Philadelphia, PA, USA, pp 542–547
Burke R, Mobasher B, Williams C, Bhaumik R (2006b) Detecting profile injection attacks in collaborative recommender systems. In: Proceedings of the 8th IEEE international conference on E-commerce technology and the 3rd IEEE international conference on enterprise computing, E-commerce, and E-services, San Francisco, CA, USA
Cai H, Zhang F (2018) An unsupervised method for detecting shilling attacks in recommender systems by mining item relationship and identifying target items. Comput J. https://doi.org/10.1093/comjnl/bxy124
Chen K, Chan PP, Yeung DS (2018a) Shilling attack detection using rated item correlation for collaborative filtering. In: IEEE international conference on systems, man, and cybernetics. Miyazaki, Japan, pp 3553–3558
Chen K, Chan PP, Yeung DS (2018b) Unsupervised shilling attack detection model based on rated item correlation analysis. In: 2018 International conference on machine learning and cybernetics, Chengdu, China, vol 2, pp 667–672
Chen K, Chan PP, Zhang F, Li Q (2018c) Shilling attack based on item popularity and rated item correlation against collaborative filtering. Int J Mach Learn Cybern. https://doi.org/10.1007/s13042-018-0861-2
Chirita PA, Nejdl W, Zamfir C (2005) Preventing shilling attacks in online recommender systems. In: Proceedings of the 7th annual ACM international workshop on web information and data management, Bremen, Germany, pp 67–74
Gao M, Yuan Q, Ling B, Xiong Q (2014) Detection of abnormal item based on time intervals for recommender systems. Sci World J. https://doi.org/10.1155/2014/845897
Gunes I, Kaleli C, Bilge A, Polat H (2014) Shilling attacks against recommender systems: a comprehensive survey. Artif Intell Rev 42(4):767–799. https://doi.org/10.1007/s10462-012-9364-9
Hao Y, Zhang P, Zhang F (2018) Multiview ensemble method for detecting shilling attacks in collaborative recommender systems. Secur Commun Netw. https://doi.org/10.1155/2018/8174603
He F, Wang X, Liu B (2010) Attack detection by rough set theory in recommendation system. In: Proceedings of the 2010 IEEE international conference on granular computing, San Jose, CA, USA, pp 692–695
Jiang L, Cheng Y, Yang L, Li J, Yan H, Wang X (2018) A trust-based collaborative filtering algorithm for e-commerce recommendation system. J Ambient Intel Humaniz Comput. https://doi.org/10.1007/s12652-018-0928-7
Kaleli C, Polat H (2013) Robustness analysis of naïve bayesian classifier-based collaborative filtering. Lect Notes Bus Inf 152:202–209. https://doi.org/10.1007/978-3-642-39878-0_19
Lam SK, Riedl J (2004) Shilling recommender systems for fun and profit. In: Proceedings of the 13th international conference on world wide web, New York, NY, USA, pp 393–402
Lee S (2019) Using entropy for similarity measures in collaborative filtering. J Ambient Intel Humaniz Comput. https://doi.org/10.1007/s12652-019-01226-0
Mehta B, Nejdl W (2009) Unsupervised strategies for shilling detection and robust collaborative filtering. User Model User Adapt Interact 19(1–2):65–97. https://doi.org/10.1007/s11257-008-9050-4
Mehta B, Hofmann T, Fankhauser P (2007) Lies and propaganda: detecting spam users in collaborative filtering. In: Proceedings of the 12th international conference on intelligent user interfaces, Honolulu, HI, USA, pp 14–21
Miyahara K, Pazzani MJ (2000) Collaborative filtering with the simple bayesian classifier. In: Proceedings of the 6th pacific rim international conference on artificial intelligence, Melbourne, Australia, pp 679–689
Mobasher B, Burke R, Williams C, Bhaumik R (2006) Analysis and detection of segment-focused attacks against collaborative recommendation. In: Proceedings of the 7th international conference on knowledge discovery on the web: advances in web mining and web usage analysis, Chicago, IL, USA, pp 96–118
Mobasher B, Burke RD, Bhaumik R, Williams C (2007) Toward trustworthy recommender systems: an analysis of attack models and algorithm robustness. ACM Trans Internet Technol 7(4):23. https://doi.org/10.1145/1278366.1278372
Morid MA, Shajari M, Hashemi AR (2014) Defending recommender systems by influence analysis. Inf Retr 17(2):137–152. https://doi.org/10.1007/s10791-013-9224-5
Si M, Li Q (2018) Collaborative recommendation: a robustness analysis. Artif Intell Rev. https://doi.org/10.1145/1031114.1031116
Verstrepen K (2015) Collaborative filtering with binary, positive-only data. PhD thesis, Antwerp University, Belgium
Williams CA, Mobasher B (2006) Profile injection attack detection for securing collaborative recommender systems. DePaul University CTI Technical Report pp 1–47
Williams CA, Mobasher B, Burke R (2007) Defending recommender systems: detection of profile injection attacks. Serv Oriented Comput Appl 1(3):157–170. https://doi.org/10.1007/s11761-007-0013-0
Wu Z, Cao J, Wang Y, Wang Y, Zhang L, Wu J (2018) hPSD: a hybrid PU-learning-based spammer detection model for product reviews. IEEE Trans Cybern. https://doi.org/10.1109/TCYB.2018.2877161
Xia H, Fang B, Gao M, Ma H, Tang Y, Wen J (2015) A novel item anomaly detection approach against shilling attacks in collaborative recommendation systems using the dynamic time interval segmentation technique. Inf Sci 306(C):150–165. https://doi.org/10.1016/j.ins.2015.02.019
Yang F, Gao M, Yu J, Song Y, Wang X (2018) Detection of shilling attack based on bayesian model and user embedding. In: IEEE 30th international conference on tools with artificial intelligence. Volos, Greece, pp 639–646
Yang L, Huang W, Niu X (2017) Defending shilling attacks in recommender systems using soft co-clustering. IET Inf Secur 11(6):319–325. https://doi.org/10.1049/iet-ifs.2016.0345
Yang Z, Cai Z (2017) Detecting abnormal profiles in collaborative filtering recommender systems. J Intell Inf Syst 48(3):499–518. https://doi.org/10.1007/s10844-016-0424-5
Yang Z, Xu L, Cai Z, Xu Z (2016) Re-scale adaboost for attack detection in collaborative filtering recommender systems. Knowl Based Syst 100:74–88. https://doi.org/10.1016/j.knosys.2016.02.008
Zhang F, Chen H (2016) An ensemble method for detecting shilling attacks based on ordered item sequences. Secur Commun Netw 9(7):680–696. https://doi.org/10.1002/sec.1389
Zhang F, Zhou Q (2014) HHT-SVM: an online method for detecting profile injection attacks in collaborative recommender systems. Knowl Based Syst 65:96–105. https://doi.org/10.1016/j.knosys.2014.04.020
Zhang F, Zhou Q (2015) Ensemble detection model for profile injection attacks in collaborative recommender systems based on bp neural network. IET Inf Secur 9(1):24–31. https://doi.org/10.1049/iet-ifs.2013.0145
Zhang F, Deng ZJ, He ZM, Lin XC, Sun LL (2018a) Detection of shilling attack in collaborative filtering recommender system by pca and data complexity. In: 2018 international conference on machine learning and cybernetics, Chengdu, China, vol 2, pp 673–678
Zhang F, Zhang Z, Zhang P, Wang S (2018b) UD-HMM: an unsupervised method for shilling attack detection based on hidden markov model and hierarchical clustering. Knowl Based Syst 148:146–166. https://doi.org/10.1016/j.knosys.2018.02.032
Zhou W, Wen J, Xiong Q, Gao M, Zeng J (2016) SVM-TIA a shilling attack detection method based on svm and target item analysis in recommender systems. Neurocomputing 210:197–205. https://doi.org/10.1016/j.neucom.2015.12.137
Author information
Authors and Affiliations
Corresponding author
Additional information
Publisher's Note
Springer Nature remains neutral with regard to jurisdictional claims in published maps and institutional affiliations.
Rights and permissions
About this article

Cite this article
Batmaz, Z., Yilmazel, B. & Kaleli, C. Shilling attack detection in binary data: a classification approach. J Ambient Intell Human Comput 11, 2601–2611 (2020). https://doi.org/10.1007/s12652-019-01321-2
Received:
Accepted:
Published:
Issue Date:
DOI: https://doi.org/10.1007/s12652-019-01321-2