
Abstract
The study area, Hesaraghatta watershed is located between 77° 20′ to 77° 42′ E longitude and 13° 10′ to 13° 24′ N latitude with an area of 600.01 km2. Thematic layers such as Land Use/Land Cover, drainage, soil and hydrological soil group were generated from IRS–1D LISS III satellite data (FCC). An attempt was made to estimate runoff using Soil Conservation Service (SCS) curve number model and it was estimated to be 1960, 2066, 1870 and 1810 mm for sub-watersheds 1, 2, 3 and 4 respectively. Quantitative morphometric analysis was carried out for the entire watershed and the four sub-watersheds independently by estimating their (a) linear aspects like stream order, stream length, stream length ratio, bifurcation ratio, length of overland flow, drainage pattern (b) aerial aspects like shape factor, circulatory ratio, elongation ratio and drainage density and (c) relief aspects like basin relief, relief ratio, relative relief and ruggedness number. Drainage density was estimated to be 1.23 km/km2 designating the study area as a very coarse textured watershed.
Introduction
Water of sufficient quantity and quality is an essential resource not only for agriculture, industry, and tourism, but also for everyday life in cities and villages. Water resources distributed in time and space are at the heart of sustainable development in many regions of the world, and their availability varies greatly from time to time and place to place. An abrupt change and an imbalance in the hydrological cycle put forth the necessity to quantify the available water resources with the objective of managing the resources both environmentally as well as ecologically. As such, approach towards management of watershed assures greater importance in recent years. Remote sensing data can be used in conjunction with conventional data for delineation of ridge lines, characterization, priority evaluation, problem identification, assessment of potentials and management needs, identification of erosion prone areas, evolving water conservation strategies, selection of sites for check dams and reservoirs etc., (Dutta et al. 2002). Durbude (2001) estimated surface runoff potential of watershed in semi-arid environment, in Banswara district of Rajasthan. The analysis was done using 1RS-1B-L1SS II satellite images in the form of FCC using SCS curve number method. Jasrotia et al. (2002) computed a mathematical model to estimate rainfall and runoff in conjunction with remote sensing data and GIS using SCS method and runoff potential map. Tripathi et al. (2002) used weighted average runoff curve number and developed an empirical model to predict the runoff for the available events of a small agricultural watershed- Nagwan, Hazari bagh, Bihar. Similarly, Anand (2004) demonstrated the use of remote sensing and geographic information system for runoff estimation by SCS curve number method and also to suggest alternate land use classification, while Ashwini (2007) explained the potential use of remote sensing and geographic information system for runoff estimation for identifying the land suitability for different crops based on available natural resources within the watershed.
The Study Area
The study area, Hesaraghatta watershed is located in Bangalore Rural District, stretching geographically between 77° 20′ and 77°42′ E longitude and 13°10′ and 13° 24′N Latitude. The catchment area of the watershed is about 600.00 km2 with a length of 33.36 km and width of 27.28 km (Fig. 1). The watershed is divided into 4 sub-watersheds based on topography and drainage system to understand the hydrological processes. The study area is covered in the survey of India (SOI) toposheets 57 G/7, 57 G/8, 57 G/11 and 57 G/I2 and characterized by large number of tanks, which intersect the flow from their receptive command area. Most of these tanks are old and partially silted and the status of the bunds, sluice and channels are poor. The study area falls in the southern maidan region, characterized by undulating landscape with rather broad based valleys. The land forms are considered ancient and have undergone an extensive pediplantation, leading to the present landscape. The highest relief is found at 1460 m above mean sea level and lowest relief at 860 m above MSL. The slope of the land is from northeast to southwest. The overall relief for the basin is 0.630 km with shallow valleys and few inselberg. The area comprises of granite in the form of intrusives in the gneissic complex and vary in color, structure and texture. It is rich in red loamy soils, which are bright red to pale red rather sticky when moist. The soils represent one of the oldest soils, derived from igneous rocks, principally granitic gneisses. The depth varies from 50 cm to several meters depending on the undulating terrain. Soils are moderate to well drained with infiltration rates ranging from 8 to 12 mm/h (NBSS and LUP, 1998). Ragi (Eleusine coracana) is the major and important crop grown in the taluk in addition to Paddy (Oryza sativa), Maize (Zea mays) and Cereals along with Wheat (Triticum spp.), Jowar (Sorghum bicolor) and Millets. Pulses comprise of field bean, groundnut, etc.

Location map of the study area
The present study was undertaken with an aim to prepare different thematic layers using Survey of India (SOI) topomaps and remote sensed data on 1:50000 scale by visual interpretation technique. Runoff estimation was carried out by using information on various aspects pertaining to rainfall, topography of the study area, etc. using hydrological models (e.g., SCS Curve Number model). Additionally, morphometric analysis of the watershed has been done to find out stream properties from the measurement of various stream attributes to quantify the effects of watershed characteristics in order to understand the hydrological process and predict the hydrologic behavior.
Materials and Methods
Survey of India (SOI) Topomaps 57 G/7, 57 G/8, 57 G/11 and 57 G/I2 on scale 1: 50,000 were scanned, georeferenced and mosaiced. Multispectral satellite data of IRS–1D LISS III (geocoded FCC) of date January, 20, 2000 pertaining to path-row 100–64 was used for the current study. Visual interpretation of satellite imagery was carried out to delineate various geomorphic units and landform features. Flow Chart 1 depicts the methodology followed for the preparation of various thematic maps. The toposheets were used as ancillary source of information in addition to satellite data to delineate the watershed and to prepare Base, Drainage (Fig. 2a), Soil (Fig. 2b), Hydrologic Soil group (Fig. 2c), Land Use/Land Cover (Fig. 2d) maps necessary for runoff estimation. The ground truth verification was carried out before finalization of the thematic maps.

Methodology for the preparation of thematic maps

Methodology to estimate surface runoff by SCS curve number model
Runoff was estimated indirectly with the aid of hydrological models using USDA (United States Department for Agriculture) methodology for estimation of surface runoff using SCS (Soil Conservation Service) Curve Number Model (Flow Chart 2). To estimate the curve numbers and runoff depth for the watershed, vector coverage of land use/land cover, soil map showing clayey soil and loamy soil series and HSG map showing hydrological soil group prepared from IRS satellite data were integrated. CN values were determined from hydrological soil group and antecedent moisture conditions in the watershed. The Curve Number values for AMC-I and AMC-II were obtained from AMC-II (Chow et al. 1988) by the method of conservation. The Quantitative Morphometric Analysis of the drainage basin is considered to be the most satisfactory method because it enables understanding of the relationship between different aspects of the drainage pattern of the same basin. Hence, the drainage details derived from Survey of India (SOI) topomaps on 1:50000 scale, updated with IRS 1D LISS III, FCC remote sensed data was used to carry out morphometric analysis and to estimate dimensional parameters using ArcGIS 9.2 software. It included
-
a)
Linear aspects include the measurements of linear features of drainage basin such as stream order (u), stream length (Lu), stream length ratio (RL), bifurcation ratio (Rb), length of overland flow (Lo) and drainage pattern (Strahler 1952) etc. Additionally, total number of streams in an order was determined by numbering of segments for each order.
-
b)
Areal aspects (Au) of a watershed of given order ‘u’ is defined as the total area projected upon a horizontal plane contributing overland flow to the channel segment of the given order and includes all tributaries of lower order. It comprises of watershed shape factor (Sf), form factor (Rf), circulatory ratio (RC), elongation ratio (Re) and drainage density (Dd).
-
c)
Relief aspects is an indicator of flow direction of water as it is an important factor in understanding the extent of denudational process that have undergone within the watershed. It comprises of Basin relief (H), Relief Ratio (Rr), Relative relief (RR) (Melton 1957), Ruggedness number (Rn) (Strahler 1964).
Fig. 2 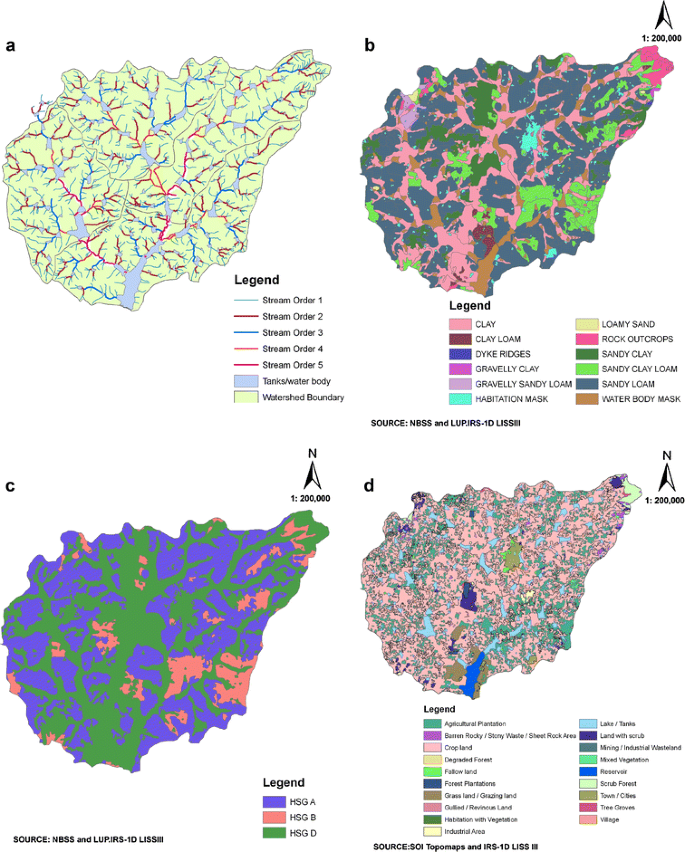
a Drainage map b soil map c hydrological soil group map d land use/land cover map of Hesaraghatta watershed

Results and Discussion
Based on the drainage details derived from Survey of India (SOI) topomaps on 1:50000 scale and remote sensed data (IRS 1D LISS III, Jan 2000), morphometric analysis for the present study can be classified into linear, areal and relief aspects (Table 1). The drainage pattern is dendritic for the study area, indicating that soil is semi-pervious in nature. The drainage pattern showed a well integrated pattern formed by the main stream with its tributaries branching and rebranching freely in all directions and, occurs on relatively homogeneous material such as granitic terrain. The total length of all stream segments (Nu) in a stream order, total stream length (Lu) in stream order (u), cumulative stream length of all stream strength of the all stream orders, mean stream length for the watershed was calculated. It is evident from Table 1 that mean length of channel segments of a given order is more than that of next higher order as Lu increases with increase of order number.
According to Strahler’s method of ordering, the watershed forms the fifth order and hence designated as fifth order watershed (Table 2).
Soil map and hydrological soil group prepared for the present study illustrates clayey soil and loamy soil series and three different hydrological soil groups (A, B and D) based on soil series within the watershed (Table 3).
Land Use and Land Cover Map indicates that the main crops during the Kharif season are ragi, pulses and oil seeds where as paddy is grown in the command area of tanks. New crops have replaced the traditional crops as a result of increase in irrigation potential by bore wells. Land use/land cover of Hesaraghatta watershed has been classified into five major classes in Level I and 12 major classes in Level II (Table 4). Further, Land Use/Land Cover has been classified into 21 sub-classes according to the SNRIS norms and their extent and proportion to the total geographical area of the watershed has been summarized (Table 5).
The shape of the basin has a profound influence on the runoff and sediment transport process and it governs the rate at which water enter the stream, being dependent on circulatory and elongation ratio. The circularity ratio (R C ) for Hesaraghatta watershed is 0.56, signifying mature nature of topography, The elongation ratio (Re) was found to be 0.83 indicating that the watershed is oval in shape (Table 6) and the values varied from 0.53 to 0.8 among sub-watersheds.
The values of bifurcation ratio (R b ) for the Hesaraghatta watershed was 4.357, remained less than five even for subwatesheds, indicating that watershed has suffered less structural disturbance with undistorted drainage density pattern and the watershed may be regarded as the elongated one. The drainage density reflects land use and affects the infiltration and the watershed response time between the precipitation and discharge. The value was 1.23 km/km2 suggesting very coarse nature of area (Table 7). It varied from 1.13 km/km2 to 1.23 km/km2 among subwatersheds. This low value is an indication that the area has highly resistant or highly permeable sub-soil material and less undulated. This low value of drainage density influence greater infiltration and hence the wells in this region will have specific capacity and the region appear to possess good water potential. The watershed exhibits impermeable subsurface material, which is evident from the presence of narrow stream coarse, while the watershed no.1 and 2 exhibited highly permeable subsoil materials, which are broad and wide valley fill zones with dense vegetation cover. The length of overland flow suggests that surface runoff reaches the streams faster.
The constant of channel maintenance ‘C’ (Schumn 1956) value for the study area is 0.81 km2/Km, which indicates the number of square kilometer of watershed required to sustain one linear km of the channel. The Stream frequency (Sf) (Horton 1945) obtained for the study area is 2.3 No. of streams/km2 and its classification has been presented in Table 8 and the values for subwatershed level is given in Table 9.
The highest watershed relief is formed by Nandi Hills at the northern tip of the watershed where river Arkavati originates at an elevation of 1460 m above MSL. The lowest relief is obtained at 860 m above MSL. The overall watershed relief calculated for the basin is 0.630 km (630 m).
Based on the minimum infiltration rate, SCS developed a soil classification system consisting of four hydrologic Soil group (HSG), namely A, B, C, and D (Table 10) and the soil characteristics associated with each of this group are given in the Table 11.
The SCS developed three Antecedent Moisture Conditions (AMC), labeled as I, II, III (Table 12) based on the water content of the soil at a given time. It is intended to reflect the effect of infiltration on both the volume and rate of runoff according to the infiltration curve.
The weighted curve numbers used for the four subwatersheds of Hesaraghatta watershed is given in Table 13. All the three AMC conditions are considered for the estimation of runoff from watershed.
According to Drought Monitoring Cell (DMC), Bangalore, the mean annual rainfall of the study area for the period between 1995 and 2006 is 925 mm, with a maximum of 1166.2 mm in 2000 and 2005 with 120 rainy days and a minimum of 382.8 mm in 2003 with 62 rainy days (Table 14). From the SCS curve number model for the present study, the minimum runoff for subwatershed 1, 2,3 and 4 estimated to be 18.80, 20.96, 17.20 and 15.89 mm respectively in 2003 and the maximum runoff is estimated as 359.64, 374.40, 348.21 and 338.36 mm respectively in 2000 (Table 14). Relationship has been established between rainfall and runoff for the entire watershed as well as for the four subwatershed (Fig. 3) and it is evident that in all five cases, rainfall and runoff are strongly correlated with coefficient of correlation (r) value being 0.87 (Table 15).

Relationship between rainfall and runoff for Hesaraghatta watershed and four subwatersheds for the year 1995 to 2006
Conclusion
Hesarghatta watershed is basically a low rainfall area and is characterised by erratic and irregular pattern of rainfall. No perennial source of water is available for the watershed other than the tanks fed by rainwater. Hesaraghatta watershed can be designated as very coarse textured and fifth order watershed, with low drainage density, leading to higher bifurcation ratio into the soil. The watershed has suffered less structural disturbance and the oval shaped watershed is of elongated nature. The dendritic pattern of drainage indicates that soil of the study area is semi-pervious in nature. Various harvesting structures such as Check dams, Nala bunds, farm pond besides desilting of tanks can be suggested at various locations based on the above evaluation to facilitate groundwater recharge.
References
Anand, B. K. (2004). Integrated approach for watershed development using remote sensing and geographic information system, M.E. Thesis Department of Civil Engineering, accepted by Bangalore University, Bangalore.
Ashwini. (2007). Analysis of land use classification using remote sensing and geographic information system, M.E. Thesis, accepted by Department of Civil Engineering, Bangalore University.
Chow, V. T., Maidment, D. R., & Mayse, W. (1988). Applied hydrology. New York: Mc Graw Hill.
Dutta, D., Sharma, J. R., & Adiga, S. (2002). Watershed characterization, prioritization, development planning and monitoring—remote sensing approach, technical report, ISRO-NNRMS-TR-103-2002. Bangalore: ISRO.
Durbude, D. G. (2001). Journal of the Indian Society of Remote Sensing, 29(1&2), 111–210.
Horton, R. E. (1945). Erosional development of streams and their drainage basins: Quantitative Morphology. Bulletin of the Geological Society Of America, 56, 275–361.
Jasrotia, A. S., Dhiman, S. D., & Aggarwal, S. P. (2002). Rainfall-runoff and soil erosion modeling using remote sensing and GIS technique – A case study on tons watershed. ‘Photonirvachak’ Journal of Indian Society of Remote Sensing, 30(3), 167–180.
Mc. Cuen, R. H. (1982). A guide to hydrologic analysis using SCS methods. Englewood Cliffs: Prentice Hall Inc.
Melton, M. A. (1957). An analysis of the relations among elements of climate, surface properties, and geomorphology. Technical Report 11. New york: Department of Geology, Columbia University.
National Bureau of Soil Survey and Land Use Planning (NBSS and LUP). (1998). Soil of Karnataka for optimization land use—executive summary in Co-operation with Government of Karnataka, pp 33–35.
Schumn, S. A. (1956). Evolution of drainage system and slopes in bad lands at poeth Ambry, New Jersey. Journal of Hydrology, 240, 45–61.
Strahler, A. N. (1952). Hypsometric (area–altitude) analysis of erosional topography. Geological Society of American Bull, 63, 1117–1142.
Strahler, A. N. (1964). Quantitative geomorphology of drainage basin and channel networks. In V. T. Chow (Ed.), Handbook of Hydrology. Mc Graw Hill, Section 4–11.
Tripathi, M. P. (2002). Runoff modelling of a small watershed using satellite remote data & GIS. Journal of the Indian Society of Remote Sensing, 30(1&2), 40–52.
Author information
Authors and Affiliations
Corresponding author
About this article
Cite this article
Somashekar, R.K., Ravikumar, P., Sowmya, S.V. et al. Runoff Estimation and Morphometric Analysis for Hesaraghatta Watershed Using IRS–1D LISS III FCC Satellite Data. J Indian Soc Remote Sens 39, 95–106 (2011). https://doi.org/10.1007/s12524-011-0074-6
Received:
Accepted:
Published:
Issue Date:
DOI: https://doi.org/10.1007/s12524-011-0074-6