
Abstract
In this study, a different ranking method has been proposed to prioritize the mineral potential areas and select the best potential area to decrease potential risks of mineral exploration. In this regard, at first, the area located in the east-southeast of the Sarcheshmeh copper mine was selected as mineral targets due to their high potential of porphyry copper occurrences. Then, the favorable porphyry copper areas were determined through collecting and integrating multiple exploratory evidential layers derived from remotely sensed imagery, geochemical, geophysical, lithological, and structural maps and images using the fuzzy logic approach in the GIS environment. Next, through building the decision matrix, the fuzzy VIKOR and Dempster-Shafer-fuzzy AHP methods were applied to estimate the favorability for copper porphyry deposits from information data layers, and the selected prospects were ranked and prioritized based on their scores obtained by each method. A comparison of the results obtained from each method with the previously discovered porphyry copper deposits and indications in the study area revealed a great match between the predicted and known deposits. The validation of results proved the ability of the proposed approach in detecting the highly favorable areas, particularly in the areas embedding known porphyry copper mineralizations. Finally, by applying the fuzzy VIKOR method to the potential areas located in the study area, the Darreh-Zar porphyry mine, as well as a region in the southeast of the Saecheshmeh mine, and a region in the south of Kouhpanj with the minimum values of Q parameter in fuzzy VOKOR method, i.e., 0.021, 0.046, and 0.166, were chosen as the best areas. The results of ranking through the Dempster-Shafer-fuzzy AHP method showed that a region in the southeast of the Sarcheshmeh mine with a priority value of 0.742, a region in the south of Kouhpanj with a priority value of 0.727, and the Dareh zar porphyry mine with a priority value of 0.653, are the best potential areas. The results of the fuzzy VIKOR and Dempster-Shafer-fuzzy AHP methods for ranking the potential areas are consistent with each other, which are validated by previously known areas as well.
Introduction
Minerals are the basic human needs and their usage is expanding every day. As the discovery of new deposits is becoming increasingly difficult, the new and advanced policies must be deployed not only to reduce the high costs of discovering a large mineral deposit but also to decrease its potential risks. To this end, it requires a systematic exploration. The first stage in a systematic exploration project is to prospect a new mineralization in a region of interest, known as mineral prospectivity mapping (MPM). The MPM is the process of creating a map that illustrates the favorability of a mineralization occurrence in a specified area by combining the geological, geophysical, geochemical maps in a regional-scale exploration. Identifying high potential areas within a promising region is one of the fundamental objectives in mineral exploration projects. Besides, many researchers applied satellite data and remote sensing methods appropriately to find mineralization areas and produce the MPM (Pour et al. 2018; Ahmadirouhani et al. 2018; Askari et al. 2018; Sheikhrahimi et al. 2019; Noori et al. 2019). Several steps should be taken before creating the MPM. In the first step, the exploratory data should be validated by correcting possible outliers, enhancement processing, and interpretation. Next, the input exploratory data should be factored to different independent evidential layers as the predictor of an unknown mineralization. Finally, these evidential layers should be integrated to highlight the mineralization characteristics using data, knowledge, or any combination of these approaches in the GIS environment. The GIS-based MPM models in general are classified into knowledge-driven, data-driven, and hybrid models. The knowledge-driven models are distinguished by integrating evidential maps and computing model parameters based on expert knowledge. The data-driven models are those using locations of known mineral occurrence as training points (Joly et al. 2015; Yousefi and Carranza 2015), and the hybrid models contain both existing data and expert knowledge (Cheng and Agterberg 1999; Porwal et al. 2003; Zuo et al. 2009). Since the MPM method is a multicriteria decision-making (MCDM) task that its purpose is detecting and prioritizing prospective areas for exploring undiscovered mineral deposits (Carranza and Laborte 2015; Carranza 2011; Porwal and Carranza 2015), applying it with other multi-criteria decision-making methods can have acceptable results in identifying the best mineralization areas. Moreover, using geographic information alone to determine areas of mineralization may not work well in this respect. Therefore, if multi-criteria decision-making policies are applied in ranking and selecting the appropriate options in order to perform exploration operations, a considerable amount of money, time, and energy could be saved, which will provide much better results. Creating a mathematical exploratory algorithm according to the mineralization type is a complex task. Nowadays, various approaches have been recommended for data analysis in order to produce mineral prospectivity mapping (Panahi et al. 2017; Yazdi et al. 2019). Zhang et al. (2017) used the fuzzy logic and fuzzy AHP methods for producing the MPM of porphyry and detecting hydrothermal vein copper deposits in the Dananhu-Tousuquan island arc, Xinjiang, NW China. Khajehmiri et al. (2016) used the fuzzy AHP and GIS for detecting prospective Cu–Au porphyry in the Mokhtarn 1:100000 geological sheet, in Southern Khorasan, east of Iran. Abedi et al. (2017) applied evidential belief functions (EBFs) as a knowledge-driven MPM method by the Dempster-Shafer’s rule of combination. They used this method to weigh and combine large scale exploration datasets to localize the prospects. Abedi et al. (2016) used the regular and the generalized version of the VIKOR method to produce two mineral potential maps in the central Iranian volcanic-sedimentary belt in Kerman province, in the Urumieh-Dokhtar magmatic arc zone. In another study, Ghezelbash and Maghsoudi (2018) applied hybrid AHP-VIKOR, as a developed knowledge-driven method for producing MPM and integrating the various exploration evidence layers. In their study, the AHP method has been used to calculate and assign the weights and importance of spatial criteria and the VIKOR has been applied to produce the final prospectivity model. In the recent study, the new attitude in applying the AHP-fuzzy TOPSIS method was used in mineral potential mapping, in which proper weights were assigned to each information layer using the AHP method based on knowledgeable information and field studies (Rahimi et al. 2020). In the other study, the Fuzzy AHP approach and GIS have been applied to delineate prospective zones of gold mineralization areas and generation of a MPM. In this study, a knowledge-driven fuzzy AHP method has been applied to extract knowledge on the comparative importance (weights) of the sub-criteria layers (Forson et al. 2019).
So far, the fuzzy Logic, VIKOR, fuzzy VIKOR, AHP, fuzzy AHP, and Dempster-Shafer methods have been used separately in mineral exploration and other studies. For instance, Alipour et al. (2017) developed a new hybrid MCDM method by combining the fuzzy AHP and cumulative belief degree model to correctly evaluate energy alternatives for investment in Iran. Moreover, in Arabameri et al. (2019), a comparison of statistical methods and MCDM has been accomplished using four methods, including evidential belief function (EBF), frequency ratio (FR), TOPSIS, and VIKOR, to obtain the map of flood hazard susceptibility (Arabameri et al. 2019).
However, until now, the combination of the fuzzy AHP and Dempster-Shafer methods has not been used to rank and prioritize exploration areas and to compare the results of ranking the fuzzy VIKOR and Dempster-Shafer-fuzzy AHP methods in mineral exploration studies. According to the mentioned studies that have been used as variable methods of MPM, the method used in this study, in terms of having appropriate conditions for weighing the criteria and considering the existing uncertainties, is an appropriate method in finding the mineralization areas and prioritizing them. Hence, in the current study, the exploration datasets were obtained from different sources, including geology, remotely sensed imagery, geophysics, and geochemistry. These datasets were fed into the favorability mapping model using the proposed MCDM approaches, which will be explained in the following sections. Results obtained for each method were compared, and finally, the best regions for further field exploration surveys were proposed.
Study area
The study area is located on the Vulcano-Plutonic zone of Urmia-Dokhtar in the southeast of the Sarcheshmeh copper mine in Kerman Province, Iran. This zone is the largest known copper belt in Iran in which important copper deposits such as Sungun, Sarcheshmeh, Midok, and Darrehzar are located there. The formation of this zone is the result of magmatic activity in the Cenozoic and especially in the Neogene-Pleistocene (Jafari Rad and Busch 2011; Abbaszadeh and Hezarkhani 2013; Zarasvandi et al. 2005). The Urumieh-Dokhtar magmatic belt (UDMB) is one of the main Cu-Mo metallogenic belts extended from NW to SE of Iran. This zone is a part of the Alpine-Himalayan orogenic belt. The direction of this belt is NW–SE and is parallel to the Zagros orogenic belt. Also, this belt is one of the main demonstrations of convergence between Eurasia and Gondwana. The Dehaj-Sarduieh volcano-plutonic belt is a part of the Urumiyeh-Dokhtar magmatic arc and especially in the Kerman Cenozoic magmatic arc (KCMA). This belt plays a vital role in the formation of copper deposits that are associated with Miocene intrusive formations, which have been intruded and emplaced in the Eocene sedimentary-volcanic sequence (Daneshvar Saein and Afzal 2017; Noorizadeh et al. 2018). The study area includes parts of two 1:100,000 scale Pariz and Chahargonbad quadrangle lithological maps. According to the position of the study area in the southeast part of the Sarcheshmeh copper mine, the considerations of EIA regulations are noticed in this area. The simplified lithology map of the study area is shown in Fig. 1.There are many faults and fractures in the study area. Important faults and fractures have a northeastern-southwestern trend that these tectonic movements along with the region’s magmatism belonged to the Quaternary (Khan Nazer 1995).

Geological map of the eastern areas of the Sarcheshmeh deposit (source: Geological Survey of Iran)
Due to the location of the study area, which is located in the Central Iranian Volcanic Belt (CIVB), the predominant formation of the region consists of igneous rocks and has fewer sediments and streams (Shahabpour and Doorandish 2008). This region is located in the areas where there are porphyry copper mineralization like other porphyry copper mines, e.g., Sarcheshmeh, Midok, and Songun. In the study area, information from 11 main Cu-Mo porphyry deposits was collected, as depicted in Table 1. The rocks in the areas where the mineralization took place consist of volcanic-sedimentary complexes, oligomycin penetrating masses, and Quaternary dacite lavas. The Eocene complex is made up of pyroclasts created by andesitic tracheal lava and tracheal-tracheal lavas, and most of these complexes are deformed. Intrusive bodies are porphyritic granodiorites in which numerous dykes have been injected. The origin of this granodiorite is probably the hybrid magma (Khoi et al. 1999).
According to the studies about the porphyry copper deposit model, porphyry copper deposits consist of copper, molybdenum, and gold minerals, disseminated or in a stockwork of small veinlets inside a large mass of altered rock (Singer and Mosier 1981). The host rock is generally a pyrite-rich porphyry arranging in combination from granodiorite to tonalite, but alkaline porphyries are locally significant. Some existing important evidence in porphyry copper deposits such as alterations, commonly argillic, phyllic, and propylitic, iron oxide, lineaments, associated with large faults and structures, and clusters of intrusions that may host porphyry copper deposits (Raines 1978; Turner et al. 1982; Abrams et al. 1983) help us to produce geological, geophysical, and geochemical evidential layers.
Proposed methodology
The steps of applying the proposed method are shown in Fig. 2. For ranking and choosing the best area, first, the exploration information layers were created as the criteria for decision-making. Then, the layers were overlaid through the fuzzy logic to obtain the potential areas. In the next step, the attributes were ranked, and the best of which was selected by applying the fuzzy VIKOR method. Afterwards, the best attributes were selected again by weighting the criteria using the fuzzy AHP method and ranking the attributes using the Dempster-Shafer-fuzzy AHP method. In the end, the results of ranked attributes obtained by the two methods were compared and validated using the known mines and mineral prospects in the study area. Therefore, in all steps, fuzzy MCDM approaches were applied to obtain results and produce an accurate MPM in which potential areas are appropriately ranked. Applying this methodology in the mineral exploration field accompanied by many uncertainties is an appropriate and reliable approach to obtain more accurate results and can be used in further studies.

Schematic representation of the ranking method model proposed for prioritization of porphyry copper areas
Fuzzy VIKOR method
In this study, an extended version of VUKOR has been utilized in a way this method has been applied for subjective and objective weights (Shemshadi et al. 2011). The trapezoidal fuzzy function is used to apply the fuzzy VIKOR method here. The steps to perform this method is explained in the following (Shemshadi et al. 2011; Opricovic and Tzeng 2004; Zadeh 1996):
-
Step 1:
Producing the decision matrix and fuzzy weighting vector based on Table 2, used to convert linguistic variables to numbers:
Table 2 Fuzzy linguistic variables and fuzzy numbers corresponding to each of the attributes -
Step 2:
Creating a decision matrix according to the profit criteria or cost type (positive or negative aspects). In this regard, the fuzzy rating for the ith alternative regarding the jth criterion of the kth decision maker would be shown as (Shemshadi et al. 2011):
-
Step 3:
Defuzzifying the fuzzy weights of each criterion in the decision matrix for obtaining the crisp values.
-
Step 4:
Weighting the normal decision matrix.
-
Step 5:
Calculating the overall performance evaluation as follows (Shemshadi et al. 2011):
-
Step 6:
Determining the worst \( {f}_j^{-} \) and the best \( {f}_j^{\ast } \)values of all criterion ratings as follows (Shemshadi et al. 2011):
-
Step 7:
Computing the values of Si and Ri as follows (Shemshadi et al. 2011):
-
Step 8:
Computing the values Qi as follows (Shemshadi et al. 2011):
where υ is introduced as a weight for the policy of maximum group utility, whereas 1-υ isthe individual-regret weight.
-
Step 9:
Ranking the alternatives by sorting the values S, R, and Q in an ascending order.
-
Step 10:
Proposing the alternative (A(1)) as the best rank solution by the measure Q (i.e., minimum).
Fuzzy AHP method
After the introduction of the fuzzy AHP method by Saaty in the 1970s, many models of fuzzy AHP have been proposed by various researchers. In these methods, the concept of fuzzy and AHP have been used in combination (Saaty 1977). Considering this matter that it is easier for decision makers to make linguistic judgments than that to give a definite answer, the use of fuzzy concepts in decision-making has become very important. Van Laarhoven and Pedrycz (1983) proposed a method for the fuzzy analysis hierarchical process based on the least logarithmic method. The large number of calculations and the complexity of the steps of this method made it not welcomed. Another method called “developmental analysis” was proposed by Chang (1996). The numbers used in this method are the triangular fuzzy numbers. Table 3 shows these fuzzy numbers.
The essential steps of the procedure conducted in this study are shown as follows:
-
Step 1:
Defining the decision-making problem.
-
Step 2:
Decomposing the complex problem in a hierarchical structure with decision elements.
-
Step 3:
Establishing a pairwise comparison matrix of the criteria by triangular fuzzy numbers and calculating the weight of criteria.
As shown in Table 3, a 9-point scale was applied to explain the relative importance of criteria (Tsaur et al. 2002). The weights of criteria are calculated using the geometric mean method (Buckley 1985).
-
Step 4:
Converting to crisp value.
Suppose the fuzzy evaluation for criterion i would be (li, mi, ui), where l, m, and u represent the lower, the middle, and the upper values. For every criterion, each fuzzy evaluation must be converted into the crisp value.
The relative weight of triangular fuzzy numbers of all criteria needs to be defuzzified using the Centroid of Area method (Chou and Chang 2008).
Finally, the defuzzified values are normalized by Chou and Chang (2008):
-
Step 5:
Consistency ratio checking.
Consistency ratio (CR) is needed for checking the weight assigned by the decision maker in a way if CR < 0.1, judgment in pairwise comparisons is consistent. CR is achieved using Eqs. (15) and (16), and Table 4 (Chou and Chang 2008).
-
Step 6:
Suppliers’ ranking.
The overall performance of each supplier was achieved by the weighted sum method and based on the achieved final score of the suppliers, ranking will be carried out.
Dempster-Shafer-fuzzy AHP method
The Dempster-Shafer theory is one of the popular theories used for modeling and reasoning inaccuracies in intelligent systems. This theory—known as the theory of belief functions—is an extension of the Bayesian theory of subjective probability. The name of the Dempster-Shafer theory is made because of the efforts of two researchers Dempster (1968) and Shafer (1976). This theory came to the attention of all researchers in the early 1980s. Belief functions have been proposed for modeling someone’s degrees of belief.
Beynon et al. (2000) first used and proposed the method Dempster-Shafer-AHP. This method is a hybrid method that consists of two different theories: the Dempster-Shafer theory, as a mathematical foundation, and the AHP, as a structure of the method. The AHP method is one of the MCDM methods that is widely used in various studies.
Another aspect of the AHP model was highlighted by Beynon et al. (2000) which represented that ignorance does not take into account. The essential idea of the Dempster-Shafer theory is that numerical measures of uncertainty may be assigned to overlapping sets, subsets of hypotheses, events, or propositions, as well as the individual hypothesis. In the Dempster-Shafer theory, the measures of uncertainty are known as basic probability assignments (BPAs). The vital components of the Dempster-Shafer theory are as follows (Altieri et al. 2017):
-
a finite set of hypotheses ϴ = {h1, h2,…. hn} is called as Frame of Discernment,
-
the BPA is a function m: 2ϴ → [0,1] that satisfies the following hypotheses: (i) m (Ø) = 0, ii)\( \sum \limits_{B\subset A}m(x)=1 \),
-
the belief measure is a function Bel: 2ϴ → [0,1], in a way Bel (A) = \( \sum \limits_{B\subset A}m(B)=1 \), for all A ⊆ θ.
-
The plausibility measure is a function Pls: 2ϴ → [0,1], in a way Pls (A) = \( \sum \limits_{B\cap A\ne \phi }m(B) \), for all A ⊆ θ.
-
The Dempster-Shafer rule’s combination allows combining the BPAs. The denominator \( 1-\sum \limits_{B\cap A=\phi }{m}_1(A){m}_2(B) \) is the normalization factor, and \( \sum \limits_{B\cap A=\phi }{m}_1(A){m}_2(B) \) is the degree of conflict between the pieces of evidence (Kohlas and Monney 2013):
In Dempster-Shafer, the relation between the belief (Bel) and plausibility (Pls) measures is as follows (Kohlas and Monney 2013):
According to the ability of the Dempster-Shafer theory to express uncertain information, this theory has been widely used in many fields such as obscure data, decision-making analysis, modeling, and risk assessment.
The Dempster-Shafer-AHP method should be utilized in presence of ignorance in an MCDM problem. Ignorance is a set of imprecision, incompleteness, and uncertainty categories. Smets (1991) makes a difference between these three categories, based on the subjective and objective components. The uncertainty as the subjective component is linked to the observer without certainty about the available information. This information only persuades some form of deficient knowledge or belief in the observer. In the current study, the Dempster-Shafer-fuzzy AHP method has been applied for the first time for the mineral exploration problems and mineral prospectivity mapping. In this regard, it could be able to demonstrate the uncertainty embedded in the users’ judgment related to the quality parameters, because in this case, each of the exploration criteria is treated as an evidence (Altieri et al. 2017). Therefore, it is possible to combine them according to the Dempster-Shafer theory using the weights of criteria obtained from the fuzzy AHP method. In this case, by using the weights obtained from the fuzzy AHP method and applying the Dempster-Shafer theory, the attributes can be prioritized and the best attribute selected. In order to prioritize the attributes by this hybrid method, a mass function, as presented in Eq. (19), has been used (Beynon et al. 2006).
where P is the weights of each criterion obtained by the fuzzy AHP method, a1,a2,…, ad are the values of each criterion in each zone, and S1, S2,..., Sd are the indicators of attribute groups.
Processing exploration data
The essential step of MPM is processing exploration data correctly and producing accurate information layers as evidential maps for mineralization type sought. This is because ultimate prospectivity models are affected by various detailed specifications of a certain deposit type sought in different areas and consequently by the diversity of individual geo-evidential layers, each of which is affected by the geological features of the study area. Therefore, all available exploratory data in the study area for porphyry copper mineralization were carefully processed, and information layers related to them were obtained.
Preparation of exploration information layers
The associated geological, geochemical, geophysical, and remotely sensed data covering the study area were processed, and the required evidential layers were prepared. In this section, the preparation procedures of deriving the main evidential layers from primary raw data are described.
Satellite imagery layer
It is well known that the dominant alterations in the altered areas are argillic, phyllic, and propylitic types. Therefore, in order to prepare these layers, satellite data processing of the three relevant imagery datasets including ETM+, ASTER, and ALI was used to map different minerals based on their unique spectral characteristics (absorbance wavelengths). For this purpose, cloud-free Landsat ETM+ data in the reflectance format (path/row160/39; attainment date: July 21, 2002) were orthorectified and reprojected applying the digital elevation model. Also, a cloud-free level B1 ASTER data recorded on May 25, 2007, and two cloud-free level 1B ALI data on August 18, 2004, that covered the study area were collected. These data were obtained by the US Geological Survey Earth Resources Observation and Science Center. The images were pre-georeferenced to UTM zone 40 North projection WGS–84 datum and processing methods such as band rationing, LS-Fit, PCA (principal component analysis), and SAM (spectral angle mapper) were applied to them. The results of processing the satellite imagery data are shown in Fig. 3.

Images of processing the satellite data related to the east of the Sarcheshmeh area on the pixel size of 30 m. Alteration areas are shown in the colors indicated in the legend in the images. (A) Hydrothermal alteration in the study area. (B) Iron oxide outcrops in the study area. (C) The Google Earth image of the study area displays some existing field evidence
Geophysical layer
The geophysical data (aeromagnetometry) used for producing geophysical layer were prepared in 1977 for the Atomic Energy Organization of Iran. A survey was done on an airplane with flight line spacing selected at 500 m and height at 150 m. The data were in the form of a 1:50,000 scale geophysical contour map. The geophysical data were converted into digital form. Accordingly, a set of 832 data points were selected to stably downward continue the reduced-to-pole (RTP) map of the aeromagnetic data at a height of 150 m. The RTP technique is applied to remove the dipolar nature of magnetic anomalies and transform their asymmetric shape to a symmetric shape (Ansari and Alamdar 2009). After that, the analytic signal filter is applied to enhance the exhibition of the shape of magnetic bodies (Kheyrollahi et al. 2018) (Fig. 4).

Images from magnetic data processing related to the east of the Sarcheshmeh area on pixel size 30 m. Magnetic property reduces from pink color areas to blue color areas. (A) Image from the analytical signal in the study area. (B) Image of reduced to pole filter
Geochemical layer
The geochemical evidential layer was prepared based on the analytic results of Zn, Pb, Cu, Mo, Sb, Co, Sn, Ba, W, and B since these elements have been presented in former studies as the indicators of porphyry copper mineralization (e.g., Sillitoe 2010; Yousefi et al. 2012; Carranza 2015; Asadi et al. 2016). For this purpose, the number of 336 geochemical stream sediment samples has been collected by the Geological Survey of Iran in the study for a sampling density of one sample per 3 km2, and the drainage network and the spatial distribution of stream sediment samples on this network are shown in Fig. 5. At first, sample catchment basins (SCB) were computed. In order to identify stream sediment anomalies, local background for elements required to be calculated for each SCBs (Carranza 2009, 2010; Yousefi et al. 2013). Six components were deduced by the PCA, and the values of loadings and scores were calculated. PC1, PC2, PC3, PC4, PC5, and PC6 were obtained 45.609, 18.728, 13.407, 9.198, 7.384, and 5.673 of the total variance in multi-variate data, respectively. As shown in Table 5, the PC1 as the PC component with a high positive correlation coefficient for Mo and Cu concentrations and a low correlation coefficient for Zn and Pb concentrations was selected as the geochemical predictor of favorable porphyry copper mineralization as shown in Fig. 6.

Location of stream sediment samples within the study area

Raster image of PC1 on geochemical data of the east of the Saecheshmeh area. The existence probability of Cu porphyry increases from pink color areas to blue color areas
Structural layer
The structural evidential layer in the region was prepared from three other layers that are indicative of faults and lineaments as the main structural elements. In this regard, the final structural layers are the faults plotted in the geological map, lineaments derived from remotely sensed images through the application of directional filters, and the main regional structures obtained through applying the tilt angle and the horizontal derivative on aeromagnetic data. Figure 7 shows the final structural map compiled by all the above-mentioned structural indicators.

Structural map of the east of the Sarcheshmeh area
Finally, the geological data layer was prepared using the digitized 1:100,000 geological map of the study area.
Preparing the evidential maps
The procedure used to obtain the final evidential factor layers is discussed and presented in this section.
-
1.
Geological factor layer: the surface geological map of the area was used to separate all different rock types covering the surface area followed by specifying the association of each rock unit with porphyry copper mineralization according to the experts’ opinions and after that, the weights were normalized. Table 6 shows these values (Yazdi et al. 2014).
-
2.
Geochemical factor layer: this layer was directly obtained after processing and eliminating the background effects and applying the PCA method on stream sediment samples covering the study area. The separation of geochemical anomaly classes is based on stream sediment data and catchment-based model by applying PCA factors related to the Cu porphyry mineralization. For the interpolation of geochemical data, many algorithms have been proposed in studies that multifractal moving interpolation methods, e.g., MIDW, IDW, and multifractal Kriging, are the most common and useful methods among them. These approaches make the discernment of geochemical populations easier by increasing geochemical anomalies and separation from geochemical background values. Therefore, the kriging method was used for the interpolation of values of geochemical signatures (Afzal et al. 2013; Yuan et al. 2015; Parsa et al. 2017).
-
3.
Geophysical factor layer: for preparing this layer at first, the filter reduced to the magnetic pole (RTP) was applied to place the anomalies above their causative bodies (Baranov 1957), based on the local inclination and declination values of IGRF model-1975, using Oasis Montaj Software (Geosoft Inc.). After applying the RTP filter, the analytic signal filter was applied for detecting magnetic bodies and their edges obviously and this map efficaciously places magnetic anomalies on top of their creator bodies (Kheyrollahi et al. 2018). Figure 8 shows this procedure.
-
4.
Alteration factor layer: the alteration images of argillic, phyllic, propylitic, and iron oxide were used for preparing the combined alteration factor. As mentioned in the previous section, this classification for alteration areas was done according to the known mineralization occurrences and the available expert information from the study area. Each alteration image was given a weighting coefficient based on their degree of association with porphyry copper mineralization by asking expert opinions and normalizing the numbers of weighting coefficients. The procedure of producing the final alteration factor indicating favorable mineralization areas in the region is depicted in Fig. 9.
-
5.
Structural factor layer: this layer was produced through combining maps that are indicative of faults, such as geological fault map, the structures derived from remotely sensed imagery, as well as the structures extracted from horizontal derivative and tilt angle of residual magnetic maps. Based on the correlation of each derived structural evidence with the known porphyry copper mineralization in the area, a weighting coefficient was normalized and allocated to each of them based on experts’ knowledge and then combined in the GIS environment according to the procedure shown in Fig. 10.
Table 6 Geological units in the east of the Sarchshmeh area and the scores given to each unit according to their importance Fig. 8 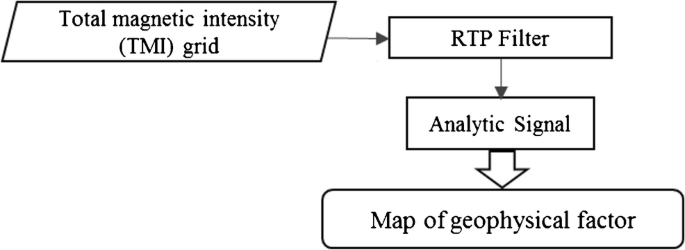
Fuzzy overlay layers from geophysics data to obtain information geophysics layer from the east of the Sarcheshmrh area
Fig. 9 
Fuzzy overlay layers from remote sensing data from the east of the Sarcheshmeh area to obtain the alteration information layer
Fig. 10 
Fuzzy overlay layers from types of structure data to obtain structure information layer from the east of the Sarcheshmeh area


Results of integration of evidence maps and ranking the potential areas
Evidential maps should be integrated to produce target areas for further exploration of the mineral deposit type sought (Bonham-Carter 1994; Carranza 2008). Also, the prioritization of mineralization areas in MPM should be specified. In this section, the process of combining evidential maps to generate MPM for Cu porphyry mineralization and ranking the potential areas is illustrated.
Combining evidential factors using a fuzzy logic approach
After obtaining all evidential factors in a GIS environment, it is necessary to transform their values into 0 to 1 range. In order to obtain the final favorable areas, the obtained evidential factor layers were combined using the fuzzy gamma operator. The reason for using the fuzzy gamma operator for integrating the weighted evidential maps and obtaining the final prospectivity map (Fig. 11) is that this operator consists of a fuzzy algebraic product and fuzzy algebraic sum. The fuzzy algebraic product has a decreasing effect and if it is used alone in integrating evidential layers, there is very little favorable area in the final mineral prospectivity map. But fuzzy algebraic sum has an enhancing effect and in the final prospectivity map, there are more favorable areas. Therefore, by determining the proper value of gamma, it could be possible to obtain an accurate final prospectivity map. Considering the available data of known porphyry copper mineralization areas and the amount of association of the final potential map with different gamma values with them, we chose the best gamma value and we used the fuzzy gamma operator (0.9) (Yousefi and Carranza 2015). Moreover, by testing other values for gamma operator, it specified that using gamma with 0.9 value would create a better mineral potential map and cover more known copper porphyry mineralization.

(A) Fuzzy overlay exploration information layer to obtain the final mineral prospecting map of the east of the Sarcheshmeh area. (B) The indicator maps and the MPM result of the integration of them
Favorable areas are then obtained from the prospectivity fuzzy logic map through applying a statistical threshold value resulting in several polygons of highly favorable areas in the GIS (Fig. 12). The threshold cut-off value was determined based on trial and error, and the constraint of each polygon should cover the area with a minimum of 2 km2 and also being located in the vicinity of known copper indicators scattered throughout the study area.

Favorable porphyry copper mineralization zones derived from fuzzy integration approach introduced as the targets (alternatives) to the fuzzy VIKOR and Dempster-Shafer-fuzzy AHP methods
Results of fuzzy VIKOR
The data used in the previous step of the fuzzy VIKOR algorithm were analyzed using the above-mentioned decision-making method. The fuzzy VIKOR method results were obtained using two modes, one using all six criteria and one without using criteria. Tables 7, 8, and 9 explain all modes regarding the 20 attributes (Fig. 12), and also the related results.
Attributes were ranked according to the results obtained by applying the fuzzy VIKOR method. According to step 9 of applying the fuzzy VIKOR algorithm, Table 9 shows the ranked attributes and the Q value obtained for each attribute in a way the Crisp Si was obtained by Eq. (9), Crisp Ri was obtained by Eq. (11), and Crisp Qi was obtained by Eq. (12).
Results of Dempster-Shafer-fuzzy AHP for ranking
By computing the correlation matrix and calculating the amount of correlation coefficient between information exploration layers obtained in the previous section, it was found out that the correlation coefficient between exploration layers is under 0.6 value (Table 10) and this means we can use the AHP and fuzzy AHP methods for obtaining the weights of each layer or criteria. The procedure for computing triangular fuzzy function in the fuzzy AHP method is outlined as follows:
The fuzzy weighting vectors were formed based on Table 11 and used for converting linguistic variables to numbers.
Thirty experts were requested to express their pairwise comparisons for the criteria using the scale provided in Table 3, and the following weights were obtained using the fuzzy AHP method (Table 12).
According to the favorable porphyry copper mineralization zones in Fig. 12, the average values of each criterion in each zone for applying the Dempster-Shafer-fuzzy AHP method were obtained as shown in Table 13.
In the next step, the grouping of options is performed based on each criterion. According to the reached values for each criterion in each zone, the decision tree was formed as shown in Table 14:
Because the area criterion was used to consider the desirability of the zones and according to the number of criteria, the area criterion was omitted in the nest stages, the weights obtained by the fuzzy AHP method for lithology, alteration, structures, geochemistry, and geophysics criteria were 0.5039, 0.2915, 0.1359, 0.0343, and 0.0343, respectively. The values of mass function were obtained using Eq. (19) (Beynon et al. 2006).
After calculating the mass function for each group of attributes, the criteria were sorted in order of their importance and were checked for their values of subscription and non-subscription and then combined using the Dempster-Shafer algorithm. Since in the Dempster-Shafer algorithm one uses the weights obtained from the fuzzy AHP method, in the denominator, where we put the result of subtracting the non-subscription value from the number one, both results of multiplying the values of two criteria were used instead of one. In this way, at the last stage of the bifurcation combination, a value is obtained for each attribute, and if this value is higher than the other attributes, it will show the priority of copper porphyry potential in the southeast of Sarcheshmeh. Thus, depending on the values of each of the attribute, we can rank the attributes. The values obtained from the Dempster-Shafer-fuzzy AHP method for each attribute are shown in Table 15.
Discussion
Producing an excellent evidential map in terms of predicting mineralization areas has always been a challenging issue for geologists in MPM (Yousefi et al. 2019; Montsion et al. 2019; Sun et al. 2020). MPM is a beneficial tool to highlight areas of interest in challenging exploration settings and identifying new mineralization areas. MPM is efficient when applied in a team setting, with experts from different geoscientific fields providing their expertise to assign suitable weights to model inputs. Due to the complication of the geological procedure, prospectivity modeling of specific mineralization in the region of interest requires the simultaneous attention of various geodatasets. Identifying potential areas in mineral prospectivity map and choosing the best area are the other challenging issues that in many mineral exploration studies discussed about the various methods for ranking and prioritizing attributes (Abedi et al. 2015; Pazand and Hezarkhani 2015; Feizi et al. 2017; Arabameri et al. 2020).
In this study, the data integration methods have been applied to the satellite imagery, the airborne geophysics, geochemical layer, structural layer, and geological map with 1:100,000 scale in order to produce MPM and to find high potential zones of Cu porphyry mineralization that should be considered for further investigations. A vital problem after determining the potential zones is to propose a ranking method to prioritize these zones and finding the best area for further exploration operation. Hence, using a suitable and trustworthy method is necessary. For this purpose, in this study, we used two hybrid methods of fuzzy MCDM that include the fuzzy VIKOR method and fuzzy AHP method combined with a proposed Dempster-Shafer method. The advantages and disadvantages of each MPM method were demonstrated by Abedi et al. (2012). In this paper, another technique for generating a prospectivity mineral map was applied. Establishing the geological databases using the Dempster-Shafer-fuzzy AHP and fuzzy VIKOR methods is achievable for the representation of evidence of prospectivity mapping related to Cu porphyry deposits. Because of the specifications and capabilities of the fuzzy MCDM methods, the fuzzy VIKOR and fuzzy AHP methods have been widely applied in mineral prospectivity mapping in recent years (Panahi et al. 2017; Ghezelbash and Maghsoudi 2018; Mami Khalifani et al. 2019). The fuzzy VIKOR method focuses on ranking and selecting a set of alternatives in a fuzzy environment. This method is based on the aggregating fuzzy measure Q that computes the distance of an alternative to the ideal solution (Alguliyev et al. 2015). The fuzzy AHP method takes into cognisance the uncertainties by applying fuzzy numbers to compare the relation among criteria or alternatives (Forson et al. 2019). Here, this method was engaged to make a decision on the priority weights of evidential layers based on triangular fuzzy numbers. Moreover, the Dempster-Shafer theory is often used to combine data and information, but this method can be used in decision-making problems and prioritization of different attributes using different criteria. Due to the effectiveness of the fuzzy AHP and Dempster-Shafer methods, a combination of these two methods would present acceptable results.
Analyzing the results obtained by the fuzzy VIKOR method and comparing them with the results of implementing the Dempster-Shafer-fuzzy AHP method show that in mineral exploration studies, these methods can be used for ranking the favorable mineralization zones and these methods can help geologists to choose top targets for focusing and further studies in the future. As in the previous studies related to the preparation of the potential map, these methods have been used efficiently, and good results have been obtained (Seraj and Delavar 2018; Riahi et al. 2020; Mokhtari et al. 2020). Comparing the results obtained in this study with other studies that have used similar methods to obtain mineral prospectivity maps and ranking attributes, it is clear that applying these methods in the field of mineral potential mapping is useful and feasible too. The proposed innovative knowledge-driven approach is based on expert knowledge and features of the known Cu occurrences in the study area to produce a predictive model for porphyry Cu mineralization. In this method, mineral potential mapping problems, such as weighting and scoring evidential layers, producing an accurate mineral prospectivity map, and ranking the potential areas are considered. Therefore, this applied method is applicable in other mineral exploration studies to produce MPM and choose the best mineralization area. In potential mapping studies and ranking potential areas, as discussed in the “Introduction” section, some common MCDM and fuzzy MCDM methods were applied (e.g., Abedi et al. 2016; Asadi et al. 2016; Duan et al. 2016); this paper is an effort to apply the Dempster-Shafer-fuzzy AHP and fuzzy VIKOR methods for solving the MCDM problem under uncertainty and fuzziness, in mineral prospectivity mapping to predict the Cu porphyry potential zones with the five relating factors.
The top three targets covering the well-known Darehzar porphyry copper deposit, the areas close to the Sereydoon deposit and its northern areas, are the best three priorities. Therefore, it can be concluded that the ultimate common choice through the application of the Dempster-Shafer-fuzzy AHP and fuzzy VIKOR MCDM methods would be the Darehzar area with the highest value in the Dempster-Shafer-fuzzy AHP and fuzzy VIKOR methods.
Through comparing the properties of existing porphyry copper deposits in the region with the targets obtained as the best top priorities out of the Dempster-Shafer-fuzzy AHP and fuzzy VIKOR methods, it is concluded that the methodology used in the current study could provide valid results consistent with the governing geological settings of the studied area. This could be achieved through the sequential application of the Dempster-Shafer-fuzzy AHP and fuzzy VIKOR methods in the course of solving an MCDM problem. Thus, such application could be used in the prioritization of the target sites, and the selection of the best favorable areas for further ground follow-up exploratory works. fuzzy logic with extreme adaptability in examining natural language meanings can model and explain the human mind’s ambiguities and the environment and the uncertainty in human judgment. Therefore, the results of this study have beneficial implications for decision-making, managers’ policymaking, and planning. The procedure’s appropriate performance relies on experts working together in an open forum, within a standard model. Progress of integrative methods, such as the one proposed here, is key to unfastening the untapped mineral potential of non-traditional exploration settings.
Conclusion
The current study aimed to investigate the possibility of employing a sequential application of the Dempster-Shafer-fuzzy AHP and fuzzy VIKOR methodologies to make a method for ranking the best favorable targets in the area covering the eastern to southeastern regions of the well-known Sarcheshmeh copper deposit. In this regard, five different spatial evidence layers, which were known to be an indicator or having a meaningful association with porphyry copper mineralization, were identified. The fuzzy logic approach was then applied to recognize the favorable porphyry copper mineralization areas and produce MPM, and a fuzzy prospectivity modeling was obtained based on the expert opinion and attributes of already known mineral deposits. Moreover, the weights were assigned to each class of layers according to the fuzzy logic and AHP method. Investigating and comparing the favorable areas obtained through the fuzzy method in the preliminary stage of favorability mapping with known porphyry copper mineralization throughout the studied area guaranteed the integration of all favorable prospects to be introduced to the next stages and prevent missing potentially essential areas. Using the Dempster-Shafer-fuzzy AHP and fuzzy AHP methods with different conditions resulted in ranking the well-known Dareh-Zar area, as the top priority with a score of 0.8477 for the Dempster-Shafer-fuzzy AHP method and Q value 0.166 for the fuzzy VIKOR methods. This area was followed by target areas tagged as 5 and 8 in Tables 9 and 15, which are close to the well-known deposits like Sereydoon and Northern Sereydoon as the second and third priorities with a Q value of 0.021 and 0.046 for the fuzzy VIKOR method and 0.748 and 0.528 for the Dempster-Shafer-fuzzy AHP method, respectively. Also, the target area tagged as 18 with a score of 0.181, which is near the KouhPanj prospect, was identified using the fuzzy VIKOR method. Therefore, the known Cu porphyry mineralization occurrences were used to compare and evaluate the capability of the fuzzy VIKOR and Dempster-Shafer-fuzzy AHP methods in ranking the potential areas and selecting the best area for the development of further exploration operations. Other areas were ranked and prioritized by applying the fuzzy VIKOR and Dempster-Shafer-fuzzy AHP methods on the areas proposed by preliminary fuzzy integration outputs, resulting in new prospects to be focused for further field exploration surveys. The predicted and ranked regions of the two methods are highly similar. There has been no proven deposit in some high favorability zones, which requires to be prospected and verified in the future, and it can be said that this study’s prediction results provide a prospecting direction for this area.
References
Abbaszadeh M, Hezarkhani A (2013) Enhancement of hydrothermal alteration zones using the spectral feature fitting method in Rabor area, Kerman, Iran. Arab J Geosci 6:1957–1964
Abedi M, Norouzi GH, Fathianpour N (2012) Fuzzy outranking approach: a knowledge-driven method for mineral prospectivity mapping. Int J Appl Earth Observ Geoinform 21:556–567. https://doi.org/10.1016/j.jag.2012.07.012
Abedi M, Norouzi GH, Fathianpour N (2015) Mineral potential mapping in Central Iran using fuzzy ordered weighted averaging method. Geophys Prospect 63:461–477
Abedi M, Mohammadi R, Norouzi G-H, Mir Mohammadi M-S (2016) A comprehensive VIKOR method for integration of various exploratory data in mineral potential mapping. Arab J Geosci 9:482
Abedi M, Kashani SBM, Norouzi G-H, Yousefi M (2017) A deposit scale mineral prospectivity analysis: a comparison of various knowledge-driven approaches for porphyry copper targeting in Seridune, Iran. J Afr Earth Sci 128:127–146. https://doi.org/10.1016/j.jafrearsci.09.028
Abrams MJ, Brown D, Lepley L, Sadowski R (1983) Remote sensing for porphyry copper deposits in southern Arizona. Econ Geol 78:591–604
Afzal P, Harati H, Fadakar Alghalandis Y, Yasrebi AB (2013) Application of spectrumearea fractal model to identify of geochemical anomalies based on soil data in Kahang porphyry-type Cu deposit. Iran Chem Erde Geochem 73:533e543
Ahmadirouhani R, Karimpour MH, Rahimi B, Malekzadeh-Shafaroudi A, Pour AB, Pradhan B (2018) Integration of SPOT-5 and ASTER satellite data for structural tracing and hydrothermal alteration mineral mapping: implications for Cu–Au prospecting. Int J Image Data Fusion 9(3):237–262. https://doi.org/10.1080/19479832.2018.1469548
Alguliyev RM, Aliguliyev RM, Mahmudova RS (2015) Multicriteria personnel selection by the modified fuzzy VIKOR method. Sci World J 2015:612767–612716. https://doi.org/10.1155/2015/612767
Alipour M, Alighaleh S, Hafezi R, Omranievardi M (2017) A new hybrid decision framework for prioritizing funding allocation to Iran’s energy sector. Energy 121:388–402
Altieri MG, Dell’Orco M, Marinelli M, Sinesi S (2017) Evidence (Dempster – Shafer) Theory-based evaluation of different transport modes under uncertainty. Theoretical basis and first findings, 20th EURO Working Group on Transportation Meeting, EWGT 2017, 4–6 September 2017, Budapest, Hungary
Ansari AH, Alamdar K (2009) Reduction to the pole of magnetic anomalies using analytic signal. World Appl Sci J 7:405–409
Arabameri A, Rezaei K, Cerdà A, Conoscenti C, Kalantar Z (2019) A comparison of statistical methods and multi-criteria decision making to map flood hazard susceptibility in Northern Iran. Sci Total Environ 660:443–458
Arabameri A, Lee S, Tiefenbacher JP, Thao Thi Ngo P (2020) Novel ensemble of MCDM-artificial intelligence techniques for groundwater-potential mapping in arid and semi-arid regions (Iran). Remote Sens 12:490. https://doi.org/10.3390/rs12030490
Asadi HH, Sansoleimani A, Fatehi M, Carranza EJM (2016) An AHP–TOPSIS predictive model for district-scale mapping of porphyry Cu–Au potential: a case study from Salafchegan area (Central Iran). Nat Resour Res 25:417–429
Askari G, Pour AB, Pradhan B, Sarfi M, Nazemnejad F (2018) Band ratios matrix transformation (BRMT): a sedimentary lithology mapping approach using ASTER satellite sensor. Sensors 2018(18):3213. https://doi.org/10.3390/s18103213
Baranov V (1957) A new method for interpretation of aeromagnetic maps: pseudo-gravimetric anomalies. Geophysics 22:359–382
Beynon M, Curry B, Morgan P (2000) The Dempster-Shafer theory of evidence: an alternativeapproach to multicriteria decision modelling. Omega 25:37–50
Beynon M, Munday M, Robert A (2006) Using DS/AHP to rank of sectors on their potential to strengthen regional economic development. In 8th International Conference on MCDM, Chania, Greece, 19-23 June 2006, pp 13
Bonham-Carter GF (1994) Geographic information systems for geoscientists: modelling with GIS. Pergamon, Oxford
Buckley JJ (1985) Fuzzy hierarchical analysis. Fuzzy Sets Syst 17:233–247
Carranza EJM (2008) Controls on mineral deposit occurrence inferred from analysis of their spatial pattern and spatial association with geological features. Ore Geol Rev 35:383e400
Carranza EJM (2009) Objective selection of suitable unit cell size in data-driven modeling of mineral prospectivity. Comput Geosci 35:2032–2046
Carranza EJM (2010) Catchment basin modeling of stream sediment anomalies revisited: incorporation of EDA and fractal analysis. Geochemistry 10:365–381
Carranza EJM (2011) Analysis and mapping of geochemical anomalies using log-ratio transformed stream sediment data with concord values. J Geochem Explor 110:167–185
Carranza EJM (2015) Data-driven evidential belief modeling of mineral potential using few prospects and evidence with missing values. Nat Resour Res 24:291–304
Carranza EJM, Laborte AG (2015) Data-driven predictive mapping of gold prospectivity, Baguio district, Philippines: application of random forests algorithm. Ore Geol Rev 71:777–787
Chang DY (1996) Applications of the extent analysis method on fuzzy AHP. Eur J Oper Res 95:649–655
Cheng QM, Agterberg FP (1999) Fuzzy weights of evidence method and its application in mineral potential mapping. Nat Resour Res 8(1):27–36
Chou SW, Chang YC (2008) The implementation factors that influence the ERP (enterprise resource planning) benefits. Decis Support Syst 46(1):149–157
Daneshvar Saein L, Afzal P (2017) Correlation between Mo mineralization and faults using geostatistical and fractal modeling in porphyry deposits of Kerman Magmatic Belt, SE Iran. J Geochem Explor 181:333–343
Dempster AP (1968) A generalization of Bayesian inference. J R Stat Soc Ser B 30:205–247
Duan H, Deng Z, Deng F, Wang D (2016) Assessment of groundwater potential based on multicriteria decision making model and decision tree algorithms. Math Probl Eng 2016, Article ID 2064575, 11 pages. https://doi.org/10.1155/2016/2064575
Feizi F, Karbalaei-Ramezanali A, Tusi H (2017) Mineral potential mapping via TOPSIS with hybrid AHP– Shannon entropy weighting of evidence: a case study for porphyry-Cu, Farmahin Area, Markazi Province, Iran. Nat Resour Res. https://doi.org/10.1007/s11053-017-9338-3
Forson ED, Menyeh A, Wemegah DD, Danuor SK, Adjovu I, Appiah I (2019) Mesothermal gold prospectivity mapping of the southern Kibi-Winneba belt of Ghana based on fuzzy analytical hierarchy process, concentration-area (C-A) fractal model and prediction-area (P-A) plot. J Appl Geophys. https://doi.org/10.1016/j.jappgeo.2020.103971
Ghezelbash R, Maghsoudi A (2018) A hybrid AHP-VIKOR approach for prospectivity modeling of porphyry cu deposits in the Varzaghan District, NW Iran. Arab J Geosci 11:275
Jafari Rad AR, Busch W (2011) Porphyry copper mineral prospectivity mapping using interval valued fuzzy sets topsis method in central Iran. J Geogr Inf Syst 3:312–317
Joly A, Porwal A, McCuaig TC, Chudasama B, Denthis MC, Aitken ARA (2015) Mineral systems approach applied to GIS-based 2D-prospectivity modelling of geological regions: insights from Western Australia. Ore Geol Rev 71:673–702
Khajehmiri Z, Shayestehfar MR, Moeinzadeh H (2016) Fuzzy analytical hierarchy process and gis for predictive cu -au porphyry in mokhtarn 1:100000 sheet, southern Khorasan, east of Iran. J Fundam Appl Sci 8(3S):478–500
Khan Nazer NH (1995) Geological map of Chahargonbad. Geological survey of Iran
Kheyrollahi H, Alinia F, Ghods A (2018) Regional magnetic lithologies and structures as controls on porphyry copper deposits: evidence from Iran. Explor Geophys 49:98–110
Khoi N, Qorbani M, Tajbakhsh P (1999) Copper deposits in Iran. Geological survey of Iran. p 421
Kohlas J, Monney PA (2013) A mathematical theory of hints: an approach to the Dempster-Shafer theory of evidence. Springer Science & Business Media, Business & Economics, 422 p
Mami Khalifani F, Bahroudi A, Barak S, Abedi M (2019) An integrated fuzzy AHP-VIKOR method for gold potential mapping in Saqez prospecting zone, Iran. Earth Observ Geomat Eng 3(1):21–33
Mokhtari M, Hoseinzade Z, Shirani K (2020) A comparison study on landslide prediction through FAHP and Dempster–Shafer methods and their evaluation by P–A plots. Environ Earth Sci 79:76. https://doi.org/10.1007/s12665-019-8804-0
Montsion RM, Saumur BM, Gongora PA, Gadd MG, Tschirhart P, Tschirhart V (2019) Knowledge-driven mineral prospectivity modelling in areas with glacial overburden: porphyry Cu exploration in Quesnellia, British Columbia, Canada. Appl Earth Sci 128(4):181–196. https://doi.org/10.1080/25726838.2019.1675403
Noori L, Pour AB, Askari GH, Taghipour N, Pradhan B, Lee CHW, Honarmand M (2019) Comparison of different algorithms to map hydrothermal alteration zones using ASTER remote sensing data for polymetallic vein-type ore exploration: Toroud–Chahshirin Magmatic Belt (TCMB), North Iran, 11:495. https://doi.org/10.3390/rs11050495
Noorizadeh M, Moradian A, Ahmadipour H, Ghassemi MR, Santos JF (2018) Petrology, geochemistry and tectonomagmatic evolution of Hezar Igneous Complex (Rayen- south of Kerman- Iran): the first description of an arc remnant of the Neotethyan subduction zone. J Sci Islam Republic Iran 29(4):341–359
Opricovic S, Tzeng GH (2004) Compromise solution by MCDM methods: a comparative analysis of VIKOR and TOPSIS. Eur J Oper Res 156:445–455
Panahi S, Khakzad A, Afzal P (2017) Application of stepwise weight assessment ratio analysis (SWARA) for copper prospectivity mapping in the Anarak region, central Iran. Arab J Geosci 10(22):484
Parsa M, Maghsoudi A, Yousefi M, Carranza EJM (2017) Multifractal interpolation and spectrumearea fractal modeling of stream sediment geochemical data: implications for mapping exploration targets. J Afr Earth Sci 128:5–15
Pazand K, Hezarkhani A (2015) Porphyry cu potential area selection using the combine AHP - TOPSIS methods: a case study in Siahrud area (NW, Iran). Earth Sci Inf 8:207–220
Porwal A, Carranza EJM (2015) Introduction to the special issue: GIS-based mineral potential modelling and geological data analyses for mineral exploration. Ore Geol Rev 71:477–483
Porwal A, Carranza EJM, Hale M (2003) Artificial neural networks for mineralpotential mapping: a case study from Aravalli Province, Western India. Nat Resour Res 12:156–171
Pour AB, Park TYS, Park Y, Hong JK, Zoheir B, Pradhan B, Ayoobi I, Hashim M (2018) Application of multi-sensor satellite data for exploration of Zn–Pb sulfide mineralization in the Franklinian Basin, North Greenland. Remote Sens 10:1186. https://doi.org/10.3390/rs10081186
Rahimi E, Shekarian Y, Mastri Farahan S, Asgari GR, Nakini A (2020) New approach in application of the AHP–fuzzy TOPSIS method in mineral potential mapping of the natural bitumen (Gilsonite): a case study from the Gilan-e-Gharb block, the Kermanshah, west of Iran. Am J Eng Appl Sci 13(1):96–110
Raines GL (1978) Porphyry copper exploration model for northern Sonora, Mexico: U.S. Geol Surv J Res 6(1):51–58
Riahi S, Moradzadeh A, Pahlavani P, Keshtdar A (2020) Application of data fusion methods of index overlay, Dempster Shafer and fuzzy AHP in geothermal resources potential mapping and their prioritization in Zanjan Province. J Res Appl Geophys 6(1):61–74
Saaty TL (1977) A scaling method for priorities in hierarchical structures. J Math Psychol 15:234–281
Saaty TL (1980) The analytic hierarchy process: planning, priority setting, resource allocation. McGraw-Hill International Book Co., New York, p 287
Seraj S, Delavar MR (2018) An extended GIS-based Dempster–Shafer theory for play-based hydrocarbon exploration risk analysis under spatial uncertainty conditions, case study: Zagros sedimentary basin, Iran. J Georisk 13(2):131–144
Shafer G (1976) A mathematical theory of evidence. Princeton University Press
Shahabpour J, Doorandish M (2008) Mine drainage water from the Sarcheshmeh porphyry copper mine, Kerman, IR Iran. Environ Monit Assess 141:105–120
Sheikhrahimi A, Pour AB, Pradhan B, Zoheir B (2019) Mapping hydrothermal alteration zones and lineaments associated with orogenic gold mineralization using ASTER data: a case study from the Sanandaj-Sirjan zone, Iran. Adv Space Res 63:3315–3332. https://doi.org/10.1016/j.asr.2019.01.035
Shemshadi A, Shirazi H, Toreihi M, Tarokh MJ (2011) A fuzzy VIKOR method for supplier selection based on entropy measure for objective weighting. Expert Syst Appl 38:12160–12167
Sillitoe RH (2010) Porphyry copper systems. Econ Geol 105:3–41
Singer DA, Mosier DL (1981) The relation between exploration economics and the characteristics of mineral deposits. In: Ramsey JB (ed) The economics of exploration for energy resources. Jai Press Inc, Greenwich, pp 313–326
Smets , P. 1991. Varieties of ignorance and the need for well-founded theories. Inf Sci, vol. 57-58. Pag. 135-144
Sun T, Li H, Wu K, Chen F, Zhu Z, Hu Z (2020) Data-driven predictive modelling of mineral prospectivity using machine learning and deep learning methods: a case study from southern Jiangxi Province, China. Minerals 2020(10):102. https://doi.org/10.3390/min10020102
Tsaur SH, Chang TY, Yen CH (2002) The evaluation of airline service quality by fuzzy MCDM. Tour Manag 23:107–115
Turner RL, Raines GL, Kleinkopf MD (1982) Regional northeast-trending structural control of mineralization, northern Sonora, Mexico. Econ Geol 77(1):25–37
Van Laarhoven PJM, Pedrycz W (1983) A fuzzy extension of Saaty's priority theory. Fuzzy Sets Syst 11(1–3):199–227
Yazdi Z, Jafarirad A, Ajayebi KS (2014) Analysis and modeling of geospatial datasets for porphyry copper prospectivity mapping in Chahargonbad area, Central Iran. Arab J Geosci 8:8237–8248
Yazdi Z, Jafarirad A, Aghazadeh M, Afzal P (2019) Porphyry copper prospectivity mapping using fuzzy and fractal modeling in sonajeel area, NW Iran. Bull Miner Res Explor 158(158):235–250
Yousefi M, Carranza EJM (2015) Fuzzification of continuous-value spatial evidence for mineral prospectivity mapping. Comput Geosci 74:97–109
Yousefi M, Kamkar-Rouhani A, Carranza EJM (2012) Geochemical mineralization probability index (GMPI): a new approach to generate enhanced stream sediment geochemical evidential map for increasing probability of success in mineral potential mapping. J Geochem Explor 115:24–35
Yousefi M, Carranza EJM, Kamkar-Rouhani A (2013) Weighted drainage catchment basin mapping of geochemical anomalies using stream sediment data for mineral potential modeling. J Geochem Explor 128:88–96
Yousefi M, Kreuzer OP, Nykänen V, Hronsky JM (2019) Exploration information systems-a proposal for the future use of GIS in mineral exploration targeting. Ore Geol Rev 5:103005
Yuan F, Li X, Zhou T, Deng Y, Zhang D, Xu C, Zhang R, Jia C, Jowitt SM (2015) Multifractal modelling-based mapping and identification of geochemical anomalies associated with Cu and Au mineralisation in the NW Junggar area of northern Xinjiang Province, China. J Geochem Explor 154:252e264
Zadeh LA (1996) Fuzzy sets. In Fuzzy sets, fuzzy logic, and fuzzy systems: selected papers. World Scientific 6:394–432. https://doi.org/10.1142/9789814261302_0021
Zarasvandi A, Liaghat S, Zentilli M (2005) Porphyry copper deposits of the Urumieh-Dokhtar magmatic arc, Iran. In: Porter TM (ed) Super porphyry copper & gold deposits: a global perspeclive. PGC Publishing, Adelaide, pp 441–452
Zhang N, Zhou K, Du X (2017) Application of fuzzy logic and fuzzy AHP to mineral prospectivity mapping of porphyry and hydrothermal vein copper deposits in the Dananhu-Tousuquan island arc, Xinjiang, NW China. J Afr Earth Sci 128:84–96
Zuo R, Cheng Q, Agterberg FP (2009) Application of a hybrid method combining multilevel fuzzy comprehensive evaluation with asymmetric fuzzy relation analysis to mapping prospectivity. Ore Geol Rev 35:101–108
Author information
Authors and Affiliations
Corresponding author
Ethics declarations
Conflict of interest
The authors declare that they have no conflicts of interest.
Additional information
Responsible Editor: Biswajeet Pradhan
Rights and permissions
About this article

Cite this article
Pahlavani, P., Riahi, S. & Bigdeli, B. Ranking potentially favorable mineralization zones using fuzzy VIKOR vs. Dempster-Shafer-fuzzy AHP methods, a case study: southeast of the Sarcheshmeh copper mine, Kerman, Iran. Arab J Geosci 13, 1167 (2020). https://doi.org/10.1007/s12517-020-06145-5
Received:
Accepted:
Published:
DOI: https://doi.org/10.1007/s12517-020-06145-5