
Abstract
Recently, a novel analytical instrument setup was reported for automatic preconcentration and determination of organic compounds in various sample matrices based on online hollow fiber liquid-phase microextraction (HF-LPME)–high-performance liquid chromatography (HPLC). In the present work, this novel instrument has been developed for extraction and determination of phthalate esters samples located in the polyethylene (PET) bottles. By using an automated syringe pump for loading supported liquid membrane (SLM) and acceptor solvents, a platform lift for moving sample vial, and a sampling loop for online injection of extract to HPLC, along with an electronic board with AVR microcontroller for storage of data and instrument programs, an automated sample preparation-HPLC analysis was developed. Optimization of extraction parameters was carried out by Box–Behnken design (BBD) which required a minimum of 29 experiments; the entire set of experiments was performed completely automatically and consecutively without any human intervention. The limits of detection (three times the S/N) ranged from 0.3 to 0.5 μg L−1. Effective preconcentration of the analytes was also achieved (between 153 and 335). The method is highly precise, with relative standard deviations varying between 5.1 and 6.4 % and also accurate (recovery percentages >94.6 %). The main advantages of the developed method are high sensitivity, selectivity, and reliability of results, minimum sample manipulation, full automation, suitable extraction time, low solvent consumption, and ease of use. The applicability of the online automated HF-LPME/HPLC-UV instrument was validated for quantitative extraction and determination of phthalate esters in aqueous samples located inside the PET bottles.
Introduction
Phthalate esters (PEs) have a wide variety of industrial, agricultural, and domestic applications, but by far, the most important is their use as plasticizers that improve the flexibility and workability of polymeric materials. Because of these properties, in the recent years, phthalate esters production and use have increased significantly. PEs are not chemically bound to the plastics, they can be easily released from the products and migrate into the food or water that comes into direct contact and consequently, they are often found in water, soil, air, food products, and the human body (Castillo et al. 1999; Holadová and Hajslová 1995; Castillo and Barceló 1997; Peñalver et al. 2000, 2001). Little is known about the possible effects of these substances on the environment and human health, but some recent studies have shown that they may cause hormone disrupting activities (Jobling et al. 1995; Staples et al. 1997).
Gas chromatography (GC) (Castillo et al. 1997; Tienpont et al. 2000; Yamini et al. 2009; Yasuhara et al. 1997) and high-performance liquid chromatography (HPLC) (Castillo et al. 1998; Kelly and Larroque 1999; Jara et al. 2000) have been used for the detection of these compounds in water samples. Nevertheless, when the concentration levels are low, a previous enrichment step is usually needed. The preconcentration techniques, which are commonly applied to monitor phthalates in water, are liquid–liquid extraction (LLE) with dichloromethane or hexane (Holadová and Hajslová 1995; Yasuhara et al. 1997) and solid-phase extraction (SPE) (Holadová and Hajslová 1995; Jobling et al. 1995; Castillo et al. 1998; Jara et al. 2000). However, these conventional pretreatment methods need either large quantities of sample and organic solvents or are time-consuming, and the materials used are not reusable and expensive (Zhou and Zeng 2006). The quest for novel sample preparation techniques has never ceased, and one of the most recent trends is the miniaturization of the traditional LLE method. The major ideas behind this are to allow efficient extraction along with reduced solvent volumes and time, and with a high level of automation and online connection to analytical instruments (Costa 2014).
Hollow fiber-based liquid-phase microextraction (HF-LPME) was first reported by Pedersen–Bjergaard and Rasmussen in 1996, where the extraction phase was placed inside the lumen of porous hollow fibers made of polypropylene (Pedersen-Bjergaard and Rasmussen 1999). In this HF-LPME system, target analytes are extracted from the sample into an extraction phase immobilized as a thin SLM located inside the pores of the wall of a porous hollow fiber. HF-LPME offers efficient alternatives to classical sample preparation techniques due to permission of high selectivity and high enrichment factors, as well as giving good possibilities for automation. This method could be performed either in the two- or three-phase mode. In the two-phase mode, the organic solvent presents both in the porous wall and inside the lumen of the hollow fiber (Basheer et al. 2002; Es’haghi 2009; Kawaguchi and Takatsu 2009). In the three-phase mode, the acceptor phase can be aqueous resulting in a conventional three-phase system compatible with high-performance liquid chromatography or capillary electrophoresis (Hou and Lee 2003; Andersen et al. 2002; Balchen et al. 2008), or the acceptor solution can be organic providing a three-phase extraction system with two immiscible organic solvents compatible with all instruments without any limitation (Ghambarian et al. 2010, 2011, 2012). The technique has a broad application potential within areas such as drug analysis and environmental monitoring and is compatible with a broad range of samples, including plasma, whole blood, urine, saliva, breast milk, tap water, surface water, pond water, seawater, and soil slurries.
The aim of this work was to assess the fully automated online HF-LPME/HPLC-UV instrument suitability for extraction and determination of some phthalate esters in water and fruits juices located inside PET bottles. In the present work, three-phase mode of HF-LPME based on two immiscible organic solvent was used for extraction of target analytes. The automated HF-LPME system runs experiments without user intervention to optimize the extraction conditions of each analyte. Also, the system acquires quantification data by online injection of extracts to HPLC and creates an HF-LPME acquisition method based on the optimization that can be set and saved on systems such as the optimum value of stirring rate, extraction solvent volume, and extraction time. This instrument offers the ability for users with limited experience to develop a sophisticated HF-LPME method so that analyses can be quantified under optimum conditions to achieve the best sensitivity and selectivity.
The main advantages of the method developed are minimum sample manipulation, full automation, suitable extraction time, low solvent consumption, and ease of use.
Experimental
Chemicals and Supplies
HPLC-grade water and methanol were purchased from Caledon (Ontario, Canada) and were used to prepare the mobile phase. HPLC-grade acetonitrile was also purchased from Duksan and was used to prepare standard solutions. n-Dodecane and other reagents with analytical grade were purchased from Merck (Darmstadt, Germany). The Q3/2 Accurel polypropylene hollow fiber was purchased from Membrana (Wuppertal, Germany). The inner diameter of the fiber was 600 μm, the thickness of the wall was 200 μm, and the pore size was 0.2 μm.
Pure standards of dimethyl (DMP), diethyl (DEP), and diallyl (DAP) phthalate esters were purchased from Sigma-Aldrich (Steinheim, Germany). Individual stock solutions of the analytes with concentration of 1000 mg L−1 were prepared by dissolving 10 mg of each compound in 10 mL of methanol. The mixed standard of the compounds was prepared in water at different concentrations by appropriate dilution of the individual stock solutions. The water solubility of DMP and DAP are 0.4 % and 6 g L−1 at 20 °C, respectively, and DEP is 1080 mg L−1 at 25 °C.
Instrumentation
The chromatography instrument used was a Varian 9012 (Mulgrave Victoria, Australia) equipped with an LC pump and a Varian 9050 variable wavelength UV/Vis detector. The HPLC column used was a PerfectSil Target ODS column (250 mm × 4.6 mm, with particle size of 5 μm) from MZ Analysentechnik (Mainz, Germany). A mixture of water and acetonitril (35:65) at a flow rate of 1 mL min−1 was used as a mobile phase in isocratic elution mode. The injection volume was 20 μL for all of the samples, and the detection was performed at a wavelength of 225 nm.
Instrument Design
A schematic illustration of HF-LPME/HPLC instrument is shown in Fig. 1. All of instrument parts were designed by solid works software 2010. The total backbone of the extraction system was made of stainless steel 316 that have 35 cm long, 30 cm wide, and 32 cm high. The main component was constructed using the following apparatuses: four solvent containers, a syringe drive module part, 6-port injection valve, operating extraction part, electronic board units, and touch screen controller. The parts were located in a steel closed box under controlled thermal conditions. These parts were fabricated as follows.

A schematic illustration of online automated HF-LPME device
-
1.
Solvent containers: Four solvent containers were positioned at the left side of the instrument containing SLM solvent (A), acceptor solvents (B and C), and elution solvent (D).
-
2.
Syringe driven module part: This part was constructed using a syringe, stepper motor, and distribution valve. The valve was made of a stainless steel body and Teflon plug. The plug rotates inside the valve body to connect the syringe port to the various input and output ports. A 1-mL gastight HPLC syringe from Hamilton (Bonaduz, Switzerland) was connected to 6-port distribution valve that driven by a stepper motor to aspirate and dispense measured quantities of SLM and extraction solvents. The valve is turned by a 1.8° stepper motor that has an encoder coupled to it for positioning feedback. Valve commands position the input and output channels to the specified ports. Six input and output channels are the following: (1) entrance of SLM solvent, (2) entrance of acceptor solvent 1, (3) entrance of acceptor solvent 2, (4) entrance of elution solvent, (5) way out of waste solutions, and (6) way out to operating extraction part.
-
3.
Six port injection valve: A high-pressure 2-position/6-port motorized injection valve was used for online injection of the acceptor solvent located inside the lumen of fiber in to HPLC column. A position-sensing switch closes in the INJECT position and stays closed until the handle is returned to the LOAD position that supplied with a 20-μL sample loop.
-
4.
Extraction part: This part comprised from three components including a sample vial, an elevator, and a Teflon cap with two needles to fix the hollow fiber. The extraction of analytes was performed in 21-mL vial containing 20 mL of aqueous sample that placed on the top of the lift while equipped with an adjustable magnetic stirrer. Two ends of hollow fiber segment were connected to the needle plugs of cap.
-
5.
Electronic board units: The task of this part is performing the extraction process according to requested schedule and sequence. The electronic circuits were designed by Proteus software Version 7, and the microprocessor program was written using BASCOM software in 8000 lines. The main components of electronic board are shown in Fig. 2.
Fig. 2 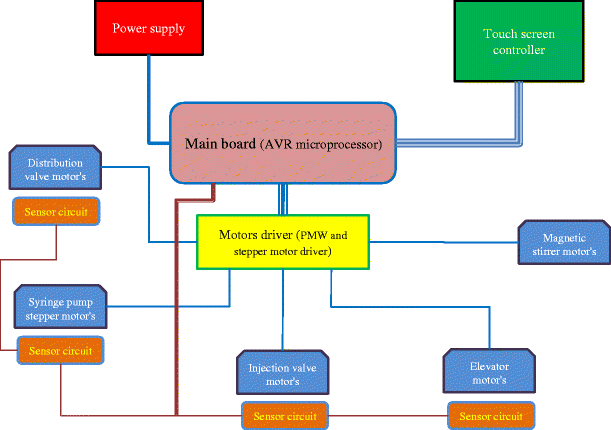
A schematic illustration of electronic parts of the instrument
-
6.
Touch screen LCD: All variable parameters could be set and controlled using a touch screen controller. It consists of five main menus as follows: (1) Start menu to lunch the device that has a specified method, (2) edit method menu which includes three methods can be stored within the memory device, (3) solvent purge menu, (4) extraction time menu to set the extraction time, and (5) stirring speed menu to adjust speed of solution stirring.

Fully Automated HF-LPME Procedure
The following describes the automated HF-LPME procedure: First, after rinsing all lines and injection valve with water (solvent D) using a syringe drive module, the SLM solvent (solvent A) was withdrawn into the syringe barrel and then dispensed toward the hollow fiber. After impregnation of wall pores of the fiber by SLM solvent, the acceptor solvent was withdrawn and transferred to the lumen of fiber using syringe drive module, and the remaining of the SLM solvent in the lumen was vent to the waste container. It should be noted that in all above steps, 6-port injection valve is in the LOAD position. In the second step, the glass vial containing the sample solution that placed on the lift moves upward until the connected hollow fiber to needle-shaped plug that attached to the cap was immersed into the sample and then lid is closed.
During the specified extraction time, the sample solution was stirred with an adjusted speed using magnetic stirrer that was placed inside the lift platform. After extraction time, the acceptor solvent was directed to the 6-port injection valve in the LOAD position supplied with 20-μL loop using syringe-driven module to introduce acceptor solvent into the HPLC column. Finally, the valve was switched to INJECT position, after which the extract was injected directly into the HPLC for analysis.
Results and Discussion
In the present study, fully automated microextraction instrument was worked in a three-phase mode of HF-LPME based on two immiscible organic solvents. Therefore, the following parameters that could affect the extraction efficiency of phthalate esters by the proposed HF-LPME method were explored and optimized: choice of SLM and acceptor solvents, hollow fiber length, salt concentration, stirring rate, and influence of extraction time.
Optimization of HF-LPME Conditions
Selection types of two immiscible organic solvents used in HF-LPME were essential for successful extraction of analytes. Extraction solvent (SLM) and acceptor organic solvent should have some properties. First, the SLM must be compatible with the fiber so that the pores in the wall of the fiber can be filled completely and formed a very thin organic membrane film. This is important since the extraction occurs on the surface of the solvent immobilized in the pores. Second, the SLM must be immiscible with water and acceptor organic phase. And finally, the acceptor organic solvent should have excellent chromatographic behaviors. On the basis of the above considerations, n-dodecane was selected as the SLM, and acetonitrile and methanol were evaluated in preliminary experiments as the acceptor organic solvents. Both of the solvents have excellent chromatographic behaviors, low solubility in n-dodecane, and effectively remained during the extraction (no leakage to SLM and no solvent loss due to evaporation). According to the obtained results, the extraction recovery using acetonitrile as acceptor solvent was higher than methanol. Thus, acetonitrile was selected as acceptor solvent.
In order to evaluate interactions between the variables simultaneously with the least number of experiments, optimization of four other variables (hollow fiber length, salt concentration, stirring rate, and influence of extraction time) was conducted using Box-Behnken design. Each of the variables had three coded levels: −1, 0, and +1, and 29 experiments were necessary in total which were randomly performed to nullify the effect of extraneous or nuisance variables. Six replicates in the central point were included in the matrix of the experimental design to obtain an estimate of the variance and to check the linearity loss between the chosen levels for each variable. Table 1 contains the minimum and maximum levels for the variables studied using factorial design. The central point was taken as the arithmetic mean between minimum and maximum level values for each variable. Design-Expert (Version 7.0) software package was used to analyze the experimental data. An analysis of variance (ANOVA) was performed on the design to assess the significance of the main effects and interactions (Table 2). The significance and the magnitude of the effect estimates of each variable as well as all the possible linear and quadratic interactions among the response variables were determined. Effects with a significance value less than 95 %, i.e., effects with a p value higher than 0.05, were discarded and pooled into the error term (often called residual error), and a new analysis of variance was performed for the reduced model. Note that the p value represents a decreasing index of the reliability of a result. The lack-of-fit test is useful to determine whether the selected model is adequate to describe the observed data or whether a more complicated model should be used. The test is performed by comparing the variability of the current model residuals with the variability between observations at replicate setting of the factors. Since the p value for lack-of-fit in the ANOVA table was greater than 0.05, the model appears to be adequate at a 95 % confidence level. A Pareto chart of effects is shown in Fig. 3. In this chart, the bar lengths are proportional to the absolute value of the estimated main effects. Figure 3 also includes a vertical line corresponding to the 95 % confidence interval. An effect, which exceeds this reference line, may be considered significant with regard to the response. A positive value for the estimated effect indicates an increase in the response if the variable increases to its high level. A negative value indicates that a better response is obtained at low levels of the variable. For the interactions, a positive value indicates that the response will increase if both variables change to the same level, low or high. A negative value indicates an increase in the response if the variables change in opposite directions (one variable increases to a high level and the other decreases to a low level).

Pareto chart of main effects obtained from Box–Behnken design. The vertical line defines the 95 % confidence interval
It was observed that stirring rate (D), salt concentration (B), extraction time (C), and hollow fiber length (A) have a strong positive linear effect, respectively. The interaction between salt concentration and hollow fiber length also had some significant effect. The sign of the main effects showed that the response would be improved on passing a given factor (extraction time, stirring rate, and hollow fiber length) from the low to the high level.
In this work, the influence of acceptor phase volume on the extraction efficiencies was studied using various hollow fiber lengths. It is known that in the HF-LPME methods, volume of the acceptor phase should be large enough to promote analyte transport to the acceptor phase. Generally, an increase in acceptor volume enhances the peak area of each analyte as much as it does not lead to dilution of extractant. On the other hand, salt concentration modification is a very useful way to enhance the extraction efficiency due to salting out effect. Commonly, addition of salt can decrease the solubility of analytes in the aqueous sample and enhance their partitioning into the organic phase. However, change of physical properties of the Nernst diffusion film can reduce the diffusion rate of analytes into the organic phase, therefore decreasing the extraction efficiency of the organic phase within a constant period of time. Taking into account the interaction between these variables, i.e., hollow fiber length and salt concentration, the observed effect is negative; that is, by employing higher hollow fiber length, mass transfer of the analytes is favored through employing low sodium chloride concentration and vice versa.
The extraction can be accelerated by stirring the aqueous sample because of the decreased thickness of the Nernst diffusion layer as well as the continuous exposure of the extraction surface to fresh aqueous sample. However, the extraction recovery raised as the stirring rate of sample solution increased in the range of 400–1000 rpm. The higher rates were not evaluated because of generation of excessive air bubbles that adhered to the surface of the hollow fiber, making the experiments difficult to control and thus leading to poor reproducibility. For extraction time, the amounts of extracted analytes were increased dramatically by increasing exposure time from 20 to 40 min, and thereafter the curves became flat. On the other hand, if the extraction time is long, solvent loss and formation of air bubbles may occur, which would decrease the extraction efficiency.
According to the overall results of optimization study, the following experimental conditions were chosen: hollow fiber length 10 cm, stirring rate 800 rpm, salt concentration 2 mol L−1 NaCl, and extraction time 40 min.
Method Validation
To evaluate the practical applicability of the proposed preconcentration method, repeatability, linearity, and limits of detection were investigated by utilizing fully automated hollow fiber microextraction device (Table 3). The precision of the method was determined by performing five consecutive automated extractions from spiked aqueous solutions. The RSDs of the analytical responses at a low concentration level were found to be between 5.1 and 6.4 %. The chromatograms for three extractions and analysis of micrograms per liter levels of PEs in aqueous solution are shown in Fig. 4. The PFs were obtained in the range of 153 to 335. For all the studied PEs, linearity was obtained in the range of 1–200 μg L−1 with coefficients of determination (r 2) ranging from 0.996 to 0.998. The LODs ranged from 0.3 to 0.5 μg L−1, based on a signal-to-noise ratio of 3 (S/N = 3). The broad linear range combined with the low detection limit suggests that HF-LPME/HPLC-UV has a high potential for monitoring phthalate esters in water and fruits juice samples located in the PET containers.

Chromatograms obtained for three replicate extractions and analyses of PEs using the proposed automated HF-LPME/HPLC system
A comparison between the figures of merit of the proposed method and some of the published methods for extraction and determination of PEs was made, whose results are summarized in Table 4. Clearly, the proposed method has a good sensitivity and precision with a suitable dynamic linear range in comparison with the other methods that coupled with HPLC instrument. An improvement in detection limits of the methodology could be achieved using GC–MS analyses if this system can be coupled online with gas chromatography instrument.
Application of the Proposed Method to the Real Samples
For further investigation of the automated HF-LPME instrument, the developed instrument was applied to the analysis of PEs in water and fruits juice samples located in the PET containers. Two water samples, one in disposable container and other in PET bottle, as well as two energetic drinks and a fruit juice in PET bottles, were analyzed by applying the developed method. Quantification of PEs in fruit juice sample was made by standard addition method. The detected values of target analytes are shown in Table 5. The relative recoveries (defined as the ratio of the concentration of analytes found in spiked real sample extracts to that from spiked ultrapure water extracts) were calculated to evaluate matrix effects. Results of relative recoveries and RSDs of four spiked real samples are shown in Table 5. The data demonstrated high relative recoveries, with RSDs less than 7.8 %. The excellent reproducibility was attributable to the full automation of the procedure, and the above results showed that the matrix had a negligible effect on the HF-LPME method. Moreover, with no interfering peaks from the matrix (Fig. 5, which shows the HPLC-UV chromatogram of extracts from unspiked and spiked fruit juice), the fully automated technique demonstrated the viability for quantitative determination of PEs compounds in various real samples.

Chromatograms of phthalate esters compounds after extraction from an orange juice sample using automated HF-LPME combined with HPLC-UV
Conclusions
A novel fully online automated HF-LPME instrument was developed for the convenient analysis of PE compounds in water, fruit juice, and energetic drink samples located in PET containers. By using an automated syringe pump for loading solvents, a platform lift for moving sample vial, a sampling loop for online injection of extracts to analysis instrument, extraction, injection, and HPLC-UV analysis could be carried out completely automatically. This novel method shows suitable accuracy for measurement trace analytes including environmental pollutants with the minimized human manipulations. Importantly, it is easy to use and inexpensive in consumables. The development of this fully automated HF-LPME device should facilitate further and broader application of HF-LPME to preparation of biological and other complex samples for improved chromatographic separations. It is believed that this is the first implementation of such a consecutively fully automated and online HF-LPME/HPLC-UV device.
References
Andersen S, Halvorsen TG, Pedersen-Bjergaard S, Rasmussen KE (2002) Liquid-phase microextraction combined with capillary electrophoresis, a promising tool for the determination of chiral drugs in biological matrices. J Chromatogr A 963:303–312
Balchen M, Reubsaet L, Pedersen-Bjergaard S (2008) Electromembrane extraction of peptides. J Chromatogr A 1194:143–149
Basheer C, Lee HK, Obbard JP (2002) Determination of organochlorine pesticides in seawater using liquid phase hollow fibre membrane microextraction and gas chromatography–mass spectrometry. J Chromatogr A 968:191–199
Batlle R, Nerín C (2004) Application of single-drop microextraction to the determination of dialkyl phthalate esters in food simulants. J Chromatogr A 1045:29–35
Castillo M, Barceló D (1997) Analysis of industrial effluents to determine endocrine-disrupting chemicals. Trends Anal Chem 16:574–583
Castillo M, Alpendurada MF, Barceló D (1997) Characterization of organic pollutants in industrial effluents using liquid chromatography–atmospheric pressure chemical ionization–mass spectrometry. J Mass Spectrom 32:1100–1124
Castillo M, Oubiña A, Barceló D (1998) Evaluation of ELISA kits followed by liquid chromatography-atmospheric pressure chemical ionization-mass spectrometry for the determination of organic pollutants in industrial effluents. Environ Sci Technol 32:2180–2184
Castillo M, Barceló D, Pereira AS, Aquino Neto FR (1999) Characterization of organic pollutants in industrial effluents by high-temperature gas chromatography-mass spectrometry. Trends Anal Chem 18:26–36
Costa R (2014) Newly introduced sample preparation techniques: towards miniaturization. Crit Rev Anal Chem 44:299–310
Es’haghi Z (2009) Determination of widely used non-steroidal anti-inflammatory drugs in water samples by in situ derivatization, continuous hollow fiber liquid-phase microextraction and gas chromatography-flame ionization detector. Anal Chim Acta 641:83–88
Farahani H, Norouzi P, Dinarvand R, Ganjali MR (2007) Development of dispersive liquid–liquid microextraction combined with gas chromatography–mass spectrometry as a simple, rapid and highly sensitive method for the determination of phthalate esters in water samples. J Chromatogr A 1172:105–112
Ghambarian M, Yamini Y, Esrafili A et al (2010) A new concept of hollow fiber liquid–liquid–liquid microextraction compatible with gas chromatography based on two immiscible organic solvents. J Chromatogr A 1217:5652–5658
Ghambarian M, Yamini Y, Esrafili A (2011) Three-phase hollow fiber liquid-phase microextraction based on two immiscible organic solvents for determination of tramadol in urine and plasma samples. J Pharm Biomed Anal 56:1041–1045
Ghambarian M, Yamini Y, Esrafili A (2012) Three-phase hollow fiber microextraction based on two immiscible organic solvents for determination of tricyclic antidepressant drugs: comparison with conventional three-phase hollow fiber microextraction. J Chromatogr A 1222:5–12
Holadová K, Hajslová J (1995) A comparison of different ways of sample preparation for the determination of phthalic acid esters in water and plant matrices. Int J Environ Anal Chem 59:43–57
Hou L, Lee HK (2003) Dynamic three-phase microextraction as a sample preparation technique prior to capillary electrophoresis. Anal Chem 75:2784–2789
Jara S, Lysebo C, Greinbrokk T, Lundanes E (2000) Determination of phthalates in water samples using polystyrene solid-phase extraction and liquid chromatography quantification. Anal Chim Acta 407:165–171
Jobling S, Reynolds T, White R, Parker MG, Sumpter JP (1995) A variety of environmentally persistent chemicals, including some phthalate plasticizers, are weakly estrogenic. Environ Health Perspect 103:582–587
Kataoka H, Ise M, Narimatsu S (2002) Automated on-line in-tube solid-phase microextraction coupled with high performance liquid chromatography for the analysis of bisphenol A, alkylphenols, and phthalate esters in foods contacted with plastics. J Sep Sci 25:77–85
Kawaguchi M, Takatsu A (2009) Miniaturized hollow fiber assisted liquid-phase microextraction and gas chromatography–mass spectrometry for the measurement of progesterone in human serum. J Chromatogr B 877:343–346
Kelly MT, Larroque M (1999) Trace determination of diethylphthalate in aqueous media by solid-phase microextraction–liquid chromatography. J Chromatogr A 841:177–185
Pedersen-Bjergaard S, Rasmussen KE (1999) Liquid–liquid–liquid microextraction for sample preparation of biological fluids prior to capillary electrophoresis. Anal Chem 71:2650–2656
Peñalver A, Pocurull E, Borrull F, Marcé RM (2000) Determination of phthalate esters in water samples by solid-phase microextraction and gas chromatography with mass spectrometric detection. J Chromatogr A 872:191–201
Peñalver A, Pocurull E, Borrull F, Marcé RM (2001) Comparison of different fibers for the solid-phase microextraction of phthalate esters from water. J Chromatogr A 922:377–384
Psillakis E, Kalogerakis N (2003) Hollow-fibre liquid-phase microextraction of phthalate esters from water. J Chromatogr A 999:145–153
Staples CA, Peterson DR, Parkerton TF, Adams WJ (1997) The environmental fate of phthalate esters: a literature review. Chemosphere 35:667–749
Sun M, Tang R, Wu Q, Wang C, Wang Z (2013) Graphene reinforced hollow fiber liquid-phase microextraction for the determination of phthalates in water, juice and milk samples by HPLC. Anal Methods 5:5694–5700
Tienpont B, David F, Sandra P, Vanwalleghem F (2000) Evaluation of sorptive enrichment for the analysis of phthalates in air samples. J Microcolumn Sep 4:194–203
Yamini Y, Ghambarian M, Khalili Zanjani MR, Faraji M, Shariati S (2009) Comparison of solidification of floating drop and homogenous liquid–liquid microextractions for the extraction of two plasticizers from the water kept in PET bottles. J Sep Sci 32:3201–3208
Yasuhara A, Shiraishi H, Nishikawa M et al (1997) Determination of organic components in leachates from hazardous waste disposal sites in Japan by gas chromatography–mass spectrometry. J Chromatogr A 774:321–332
Zhou J, Zeng Z (2006) Novel fiber coated with β-cyclodextrin derivatives used for headspace solid-phase microextraction of ephedrine and methamphetamine in human urine. Anal Chim Acta 556:400–406
Compliance with Ethical Standards
The authors gratefully acknowledge financial support from Tarbiat Modares University.
Conflict of Interest
Yadollah Yamini declares that he has no conflict of interest. Ali Esrafili declares that he has no conflict of interest. Mahnaz Ghambarian declares that she has no conflict of interest.
Ethical Approval
This article does not contain any studies with human participants performed by any of the authors.
Author information
Authors and Affiliations
Corresponding author
Rights and permissions
About this article

Cite this article
Yamini, Y., Esrafili, A. & Ghambarian, M. Online Injection-Based Hollow Fiber Liquid-Phase Microextraction–High-Performance Liquid Chromatography as a Fully Automatic Sample Processing for Phthalate Esters Analysis. Food Anal. Methods 9, 729–737 (2016). https://doi.org/10.1007/s12161-015-0247-y
Received:
Accepted:
Published:
Issue Date:
DOI: https://doi.org/10.1007/s12161-015-0247-y