
Abstract
The axial flow turbine applied in an overtopping wave energy convertor can continuously provide power with high efficiency and reliably. To study the rules between parameters of the turbine and flows, three different types of turbines with complete 3D flow-channel models were designed and optimized. It appears that diameter of the runner, flow rates, number of guide vanes and shape of outflow passage have a considerable impact on the performance of the whole convertor. The turbine with a diameter of 0.8 m, flow rate of 0.5 m3/s, double guide vanes and bent section in outflow passage shows the best comprehensive performance. Moreover, the results of the experiments indicate that the output power can be enhanced by increasing the wave overtopping rate.
1 Introduction
With the societies are now making great efforts to reducing their ever-increasing pollution emissions from energy supplies derived from fossil fuels which are fast depleting, the exploitation of renewable energy sources to satisfy our needs is paramount (Falcão 2010; Liu et al 2011). Ocean, which covers our earth almost 71% and has a large amount of energy of more than 2 × 10³ TW, is the most valued resource treasury of human beings (Kanemoto 2010; Li et al 2010). Among various forms of ocean energy, the energy from ocean waves is the most abundantly available and applicable in offshore areas. The waves are generated by the action of wind. As a consequence, wave is an indirect form of solar energy.
Systems for converting wave energy into usable energy are in development and have inspired numerous inventors, some of which have been utilized to generate electricity. There are wide varieties of technologies in wave energy conversion. Therefore energy can be absorbed from the waves in different ways. As for the oscillating water column (OWC) device, it typically comprises a partly submerged concrete, open below the water surface, inside which air is trapped above the water free surface. The oscillating motion of the internal free surface makes the air to flow through an air turbine which drives an electrical generator. The Ocean Swell Powered Renewable Energy (OSPREY) is a shovel-shaped submersible structure positioned on the seabed off the north coast of Scotland. It is held in place on the seabed and operates by trapping the swell of the ocean inside a vessel. As the swell rises and falls, air is pushed out and sucked in through top of the structure, turning a turbine in the process (Rusu & Guedes Soares 2009). However, the design and construction of the structure are the most critical issues in OWC technology. As for the oscillating body systems, it typically comprises offshore devices, which can be submerged or floating type. A system with a heaving buoy driving a linear electrical generator was recently developed at Oregon State University, USA (Elwood et al 2010). It consists of a deep-draught spar and an annular saucer-shaped buoy. The forces imposed on the spar by the relative velocity of the two bodies are converted into electricity by a permanent magnet linear generator. However, the problems associated with mooring and access for maintenance have hindered Oscillating body systems’ development.
Another different way of wave energy utilization is the overtopping wave energy convertor (OWEC) which has become a research topic in the world. The Tapchan (Tapered Channel Wave Power Device), a device developed in Norway in the 1980s, was built in 1985 at Toftestallen, Norway, and operated for several years (Falnes 2007). It comprises a water reservoir, a low-head water-turbine, a collector and a converter. The main function of the horn-shaped collector is to concentrate the incoming waves before they enter the converter, and the reservoir serves the purpose of providing a stable water supply to the turbine. The Wave Dragon device, an offshore converter developed in Denmark, comprises two wave reflectors focusing the incoming waves towards a doubly curved ramp, a reservoir and a set of low-head turbines (Kofoed et al 2006). Another run-up device based on the principle is the Seawave Slot-Cone Generator (SSG) developed for integration into a caisson breakwater (Vicinanza & Frigaard 2008). The concept is based on the wave overtopping utilizing a total of three reservoirs placed on top of each other and the water are run through a multi-stage hydro-turbine for producing electricity. This type of wave energy convertor has advantages such as endurance, overall stability and its high efficiency of energy conversion.
However, there is limited understanding of how the loading, power output and efficiency of water turbines are affected by the head and rate of the flows that are suitable for energy extraction. Shi et al (2013) provided the experimental study of low-head turbines applied in wave energy conversion. They designed two types of turbines and compared their difference in performance in the laboratory. Kofoed et al (2006) present a wave energy converter called Wave Dragon equipped with hydro-turbines and automatic control systems. Measuring program has been carried out for optimal design of the structure and regulation of the power take off system. Nevertheless, their results could not be completely relied upon because they only focused on the experimental performance instead of comparing them with numerical simulation or theoretical validation. Margheritini et al (2009) proposed a wave energy converter of the overtopping type made up of a number of reservoirs and low head hydro-turbines. The pilot plant is an on-shore full-scale module in three levels with an expected power production of 320 MWh/y in the North Sea. However, little research was investigated for the performance of the turbines which could be highly affected by the local water parameters.
On the numerical side, Li et al (2011) applied the boundary vorticity dynamics (BVD) method to optimize the runner blade shape of a tubular turbine. Liu et al (2007) modified the runner of the tubular turbine of FuJian DaGan water power station. Amelioration of the turbine was obtained from the point of increasing the discharge, which increased the output of the power station. However, these kinds of turbine are used as commercially based type in the head range of more than 4 m. Compared with the bulb tubular turbine, the axial flow turbine used in this article shows advantages such as simple structure, low water head required and high efficiency. Huang (2010) developed two turbine sets and several models are proposed. Based on the results of numerical simulation, the working performance of Axial-flow turbine is much better than Curved Surface Vane turbine. However, they cannot be relied upon for a complete turbine performance analysis because of their limited research on how the loading, power output and efficiency of water turbine are affected by the head and rate of the flows, together with the parameters of itself.
To resolve the problem of low efficiency and output produced by normal turbine, three different types of axial flow turbines were designed and optimized. An experimentally validated CFD model was applied in this paper to compare and analyze the flow fields under different operating conditions of the flow and turbine parameters. Therefore, research into axial-flow turbine applied in overtopping wave energy convector with low head and high efficiency is of great significance.
The objective of this paper was to indicate an experimentally validated CFD model that can be used to optimize turbine efficiency and output by improving parameters of the axial turbine. Three different types of turbines with complete 3D flow-channel models were designed and optimized, numerical flow simulations were used to investigate their overall performance, and an optimal model turbine was found. Experimental model test was conducted to make a comparison between the results of numerical simulation.
2 Working principles and preliminary design
2.1 Working principles
Figure 1 shows a profile view of the overtopping wave energy convertor which consists of the collector, converter, the water reservoir and the low-head water-turbine.

2D view of the overtopping wave energy convertor. 1 indicates the wave, 2 the collector and converter, 3 the water reservoir, 4 the low-head water-turbine.
The water that is close to the wave crest is captured and introduced by over-spilling into a reservoir’ and the average free-surface level of the surrounding sea is lower than the level of stored water in the reservoir. The potential energy of the stored water is converted into useful energy through the low-head water-turbines when water on its way to the sea. The Slope collector serves the purpose of concentrating the incoming waves before they enter the water reservoir. As a result, the wave energy is gradually transformed into the potential energy in the reservoir. The main function of the reservoir is to provide a stable water supply to the turbine. Turbines play an important and delicate role on the power takeoff of the device. They must work with very low head values (water levels in the reservoirs). An axial flow turbine is designed and optimized in this work.
2.2 Preliminary design
The device of overtopping wave energy convertor is supposed to work with a head of 1–2.5 m, and the flow rate of 0.27–8.32 m3/s after numerical simulation and model tests in previously studies (Huang 2010). In order to ensure the normal performance of the turbine, the main working parameters of the turbine were designed with a head of 1–2.5 m, the flow rate of 0.27 –2 m3/s, required output of 6 kW supplied by electric generator and a diameter of 0.8 m.
An axial flow turbine is applied in this paper because of its good performance in a low head. The turbine input power is the total flow rate through the turbine and the flow output is usually indicated by the symbol P n :
A certain energy loss occurs as the water flows through the turbine. The ratio of turbine output to water output is called the turbine efficiency with the symbol of η:
Regarding the relatively low conversion efficiency in water output of wave flow turbine, the turbine efficiency is designed with 60% and flow rate with 1 m3/s respectively. So the final working parameters of the turbine are: water output of 10 kW, turbine output of 6 kW, turbine rotating speed of 126.5 r/min, designed head of 1 m and designed flow rate of 1 m3/s.
The axial flow turbine applied in an overtopping wave energy convertor typically consists of guide vanes and runners with a vertical shaft as shown in figure 2.

Design schematic diagram of the turbine.
3 Numerical simulation
ANSYS fluid dynamics solutions are capable of offering the reliable results due to their solver robustness and advanced modeling capabilities. ANSYS is renowned for CFD analysis tools which include the widely used and well-validated ANSYS CFX that can capture virtually any type of phenomena related to fluid flow. Commercial code ANSYS CFX 14.5 has been implemented for flow field and turbine performance computations in the CFD model. The CFD model typically consists of a description of flow geometry, a set of differential equations describing the physics of the flow, boundary and initial conditions, and mesh points at which these equations are solved. The software is based on the fundamental equations of continuity, momentum, and energy equations which are solved by Euler–Lagrange approach.
3.1 Basic equations
For the fluid flow analysis of the entire axial flow turbine, the continuity equation and Reynolds-averaged Navier–Stokes equation have been used in the following form (Luo & Pedley 1996; Masters et al 2013; Saeed & Galybin 2009):
where U, ρ, ν and p is velocity, density, kinematic viscosity and pressure respectively. The renormalization group (RNG) k−ε turbulence model is used for Numerical predictions (Sierra et al 2000). The simulation was conducted with the type of steady state.
The model of RNG k−ε turbulence has access to obtaining a more accurate description of turbulent transfer relationship with the vortex scale changes or Reynolds number. As a consequence, the model is available for better dealing with the low Reynolds number zone or near the wall region (Ranade et al 2001).
3.2 Algorithm and boundary conditions
The calculation region consists of the inlet passage, guide vane part, runner, and outlet passage. The domain of runner was rotating while others were stationary and the transient rotor-stator simulation was performed using the steady-state frozen rotor as an initial guess. Meanwhile, mathematical calculation adopted an element-based finite volume method. For the computational domain, unstructured tetrahedron grid was chosen due to its flexibility when solving complex geometries.
At the boundary conditions, mass flow-rate inlet and pressure outlet set to 0 Pa were chosen with all the other boundaries of no slip wall. And the residual target of convergence criteria was set as 1.E-4. The reference pressure of the flow was 1 atm, and there are no buoyant forces taken into consideration.
4 Design and optimization
4.1 Model one
Figure 3 shows a schematic view of the 3D model of model 1 and figure 4 indicates the mesh of the runner and guide vane respectively.

3D model of model 1.

Mesh of the runner and guide vane.
4.1.1 Different diameter
Different diameter of runner has a significant impact on turbine performance. Figure 5 shows the external performance of model 1 with diameter of 0.80 m, 0.75 m, 0.70 m and 0.65 m. The flow rate was constant set as 1 m3/s.

External performance of model 1 with different diameter.
As can be seen from table 1, through computational output and efficiency of the CFD simulation, runner’s different diameters have a considerable influence on the efficiency and output of the turbine, with the same parameters of flow rate and rotating speed.
The efficiency increases with the runner blade’s diameter becoming larger. At the same time, the required head is lower. However, the output from the turbine decreases along with the increased diameter. The water turbine shows the highest efficiency with blade’s diameter of 0.80 m while the runner with diameter of 0.65 m produces the largest output.
4.1.2 Different flow rate
The flow rate through the runner was changed for the turbine’s numerical simulation with the same parameters of other flow parts and the same diameter of 0.80 m. Figure 6 indicates the external performance of model 1 with flow rate of 1.5 m3/s, 1.2 m3/s, and 1.0 m3/s.

External performance of model 1 with different flow rates.
Table 2 shows the calculation results of different flow rates while the diameter of the runner keeps constant. As can be seen from the table, the more rates flowing through the runner, the larger output was produced by turbine. Nonetheless, the efficiency of the hydraulic conversion dropped slightly and the required head rises remarkable. The hydraulic turbine displays the largest output of turbine at 10.11 kW with the flow rate of 1.5 m3/s. Consequently, the turbine output could be improved by providing more flow rate.
Through comprehensive comparison of turbine’s total performance, the turbine with diameter of 0.8 m was chosen for further optimization due to its high efficiency of hydraulic conversion. At the same time, it is an effective method to improve turbine output with high flow.
4.2 Model two
Figure 7 shows a schematic view of the 3D model of model 2 and figure 8 indicates the mesh of the double guide vanes.

3D model of model 2.

Mesh of the double guide vanes.
4.2.1 Optimization of the guide vanes
The guide vane is an important component of the flow parts. Streams flow through the guide vanes before circulation is formed which distributes itself uniformly meanwhile. And after that, the water flows into the runner.
-
(1)
Optimization of the shape
The efficiency of turbine is affected by the shape of guide vanes, two different types of which have been present by figure 9 and figure 10. Improved access to the vanes was achieved by changing the airfoil profile.
-
(2)
Double guide vanes

The guide vane before optimization.

The guide vane after optimization.
A guide vane was added below the runner for CFD simulation with the parameters of other flow parts and flow rate keeping the constant. Figure 11 gives the schematic diagram of the added guide vane.

The schematic diagram of the added guide vane.
4.2.2 Different flow rate
The flow rate ranged from 0.4 m3/s to 1.2 m3/s with the runner’s diameter of 0.8 m. Figure 12 presents the efficiency and turbine output of model 2 with double guide vanes. Eight different flow rate conditions were chosen: 1.2 m3/s, 1.1 m3/s, 1.0 m3/s, 0.9 m3/s, 0.8 m3/s, 0.7 m3/s, 0.6 m3/s, 0.5 m3/s, 0.4 m3/s. The outlet pressure was set as 0.

External performance of model 2 with different flow rates.
As can be seen from table 3, the flow rate of inlet has a great effect on the performance of the turbine, whose discipline is the same as in table 2 obtained by model 1. The turbine output improves significantly as the flow rate increases. However, higher head of water is indispensable and less hydraulic conversion of turbine comes out.
Generally, the turbine shows the best overall performance with the flow rate of 0.5 m3/s, although the turbine’s efficiency is lower than that of 0.4 m3/s flow rate, the differences are small. And the turbine output increases largely, closing to the design output. The turbine’s output capacity is improved with the flow rate, but the efficiency is low and the required head is not sufficed. Therefore, the turbine shows the best overall performance with the flow rate of 0.5 m3/s and diameter of 0.8 m.
4.2.3 Analysis of power generation performance between model 1 and model 2
Table 4 gives the calculation results for power performance with unilateral and double guide vanes. It is apparent that wave power generation with double guide vanes shows a better performance than with a unilateral guide vane located above the runner, reaching at 41.5 kW.
With double side guide vanes, hydraulic efficiency is slightly decreased. Because of the turbine’s spatial guide vanes, the water is blocked from the outlet of runner under the power generation, even though added guide vane is fully open. However, the decrease is not significant.
On the whole, the turbine with double guide vanes shows a better performance for power generation. Therefore, the model with double side guide vanes was chosen eventually.
4.3 Model three
4.3.1 Optimization of the outflow passage
The outflow passage has a significant impact on efficiency and unit output, figure 13 shows a schematic view of the modification where improved access to the shape of turbine outflow passage has been made. Outlet straight section was changed by bent section, and grid models together with the numerical simulations were also established.

3D model of model 3.
4.3.2 Analysis of power generation performance between model 2 and model 3
Table 5 indicates the CFD results for external performance with straight and bent section. The efficiency of turbine with straight section is lower but the different is quite modest. At the same time, the output of turbine experiences a considerable increase from 7.80 kW to 8.27 kW when the output passage has been optimized. Hence, the turbine with bent outlet passage has better properties in power generation.
4.3.3 Analysis of flow pattern between model 2 and model 3
-
(1)
Static pressure distribution of the blade
Figure 14 and figure 15, respectively, shows the static pressure distributions in the blades of turbine with straight and bent section. The pressures gradually decreased along the flow direction on the whole, with the pressure of front face is greater than the back one. And local high pressure is occurred on the head of both guide vanes due to the water flow striking. The shape of outflow passage has some influence on the positive pressure, but the difference was only a little.
-
(2)
Surface relative velocity distribution
Figure 14 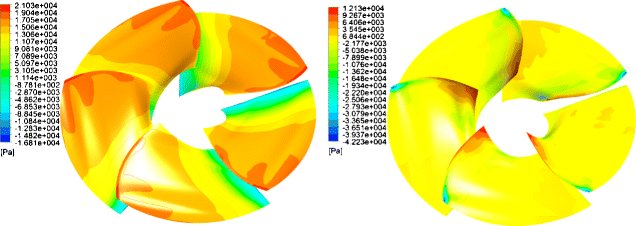
Static pressure distributions in the blades of model 2.
Figure 15 
Static pressure distributions in the blades of model 3.


Figure 16 and figure 17 show the relative velocity distribution on the front and back of runner with straight and bent section. As is clear from the figures, water flows in from inlet of blade and out from the outlet along the blade’s surface. The water flows smoothly without vortex and the flow pattern is good.

Relative velocity distribution in the blades of model 2.

Relative velocity distribution in the blades of model 3.
-
(3)
Velocity streamline in outlet passage
Figure 18 exhibits the velocity streamline in outlet passage of model 3 (left) and model 2 (right). As we can see from the velocity profile, the velocity streamline in the model 3 with bent section shows a smoother pattern than model 2. It is probably the reason why the turbine with bent outlet passage has a higher output power than the straight one as indicated in table 5. However there are some vortices at the initial region of outlet passage in model 3 which is partly due to the existence of the rotating shaft. Therefore, the shape of outflow passage has a significant effect on turbine output.

Velocity streamline in outlet passage of model 3 (left) and model 2 (right).
5 Experiments
5.1 Parameters of model turbine and test instrument
The prototype turbine was scaled down to a model turbine with a 25 mm diameter runner for the model test. The relationship between flow rate and the runner’s rotating speed was tested. A photograph of the whole model can be seen from figure 19 and figure 20.

The whole model a tested turbine.

Model test of the experiments.
The model test was based on a multifunction hydro-mechanical experimental bench at Hohai University which was used for the ‘211 Project’ key construction projects. And the test bench was designed and constructed according to standard DL446-91 Turbine Model Acceptance Tests, with an integrated test error less than 4%. The main equipment consists of the pressure tank, tail tank, electric valve, electromagnetic water pump, pipes and other components. The main parameters are as follows:
Head: H =0–20 m; | Flow rate: Q =0–1 m3/s; |
Torque: M =0–200 N ∙M; | Rotating speed :n =0–2000 rpm. |
The measuring instruments were: (1) discharge measurement: RFM4110-500 electromagnetic flow meter made by SGAIC, precision of ±0.2%; (2) head measurement: EJA110A pressure difference sensor made by CYS, precision of ±0.1%; (3) speed measurement: JCZ-200 torque meter made by XYDC, precision of ±0.1%.
5.2 Results of model test
As indicated in table 6, during the whole process of experiment, the mass of pressure flow provided by pump was able to be controlled when through the turbine. The volume of water remained constant at 0.015 m3 over time, while the passing time was varying which had been measured. Table 7 presented the experimental results from the model test and the data for the switched prototype under the operation condition. From the relationship between flow rate and rotating speed indicated by the table it appears that the runner’s rotating speed keeps going up when the flow rate through the turbine rises. It is also apparently that the rotating spend could meet the design requirement when the flow rate reaches 0.42 m3/s which is within the ranges of design flow rate.
5.3 Comparison between results of numerical simulation and prototype test
Figure 21 proposed a comparison between numerical simulation and prototype test results for this system with the rotating speed as a function of the flow rate. The rotating speed-flow rate curve reveals that, both in the numerical simulation and the prototype test, the rotating speed varies with discharge for the turbine. For the results of prototype test, the rotating speed kept going up from 23 r/min to 396.875 r/min when the flow rate increased from 0.12488 m3/s to 1.37634 m3/s. As indicated in figure 21, the curve trend of the numerical results follows that of the prototype test. The predicted flow rate values were within −1.28 ± 5.14% difference from the actual measured values, indicating that the energy characteristics of the turbine was able to be captured by the CFD model. It is possibly that the error is due to the neglecting of clearance and frictional force between the runner and runner chamber. As speculated by the curved line and data, the turbine could meet the design speed within the scope of supplied flow rate.

Comparison of numerical simulation and results of switched prototype test.
6 Conclusions
The axial flow turbine applied in an overtopping wave energy convertor can provide power with high efficiency and output continuously and reliably. Three different types of turbines have been designed and optimized by CFD simulation in this paper. Meanwhile, some rules in a single turbine and between different turbines are present. The experiments conducted by the hydraulic machinery multifunctional tests also indicate some regularity results about this special turbine. The main conclusions are as follows.
-
(1)
Diameter of the runner, flow rates, number of guide vanes and shape of outflow passage have a considerable influence on the external performance of this special turbine applied in an overtopping wave energy convertor. The efficiency increases with the runner blade’s diameter becoming larger but the turbine output suggests the opposite. The more rates flowing through the runner, the larger output is produced by turbine, the less efficiency of hydraulic conversion within the turbine.
-
(2)
The output of the turbine can be greatly improved by double guide vanes instead of a unilateral one, but the efficiency only changes a litter. Further, for the model applied in this paper, the turbine with bent section in outflow passage shows some advantages over with straight one. Taken together, the turbine with diameter of 0.8 m, flow rate of 0.5 m3/s, double guide vanes and bent section in outflow passage shows the best comprehensive performance with the flow condition provided.
-
(3)
The predicted flow rate values were within −1.28 ±5.14% difference from the actual measured values, indicating that the external performance of the turbine was able to be captured by the CFD model. It appears that the runner’s rotating speed increases with the rise of the flow rate based on experimental and numerical results. For the overtopping wave energy convertor with certain water head, the output power can be enhanced by adding the wave overtopping capacity.
Nevertheless, extensive experimental work is continuously required, at both model and prototype level, in order to get a more convinced design scheme of wave energy convector.
References
Elwood D, Yim S C, Prudell J, Stillinger C, Jouanne A, Brekken T, Brown A and Paasch R 2010 Design, construction, and ocean testing of a taut-moored dual-body wave energy converter with a linear generator power take-off. Renew. Energy 35: 348–354
Falcão A F O 2010 Wave energy utilization: A review of the technologies. Renew. Sust. Energy Rev. 14: 899–918
Falnes J 2007 A review of wave-energy extraction. Mar. Struct. 20: 185–201
Huang Y 2010 The study on hydrodynamic performance of Saucer-Like wave energy converter. Qingdao, China: PhD Thesis. Ocean University of China
Kanemoto T 2010 Dream of marine-topia: New technologies to utilize effectively renewable energies at offshore. Curr. Appl. Phys. 10: S4—S8
Kofoed J P, Frigaard P and Friis-Madsen E 2006 Prototype testing of the wave energy converter Wave Dragon. Renew. Energy 31: 181–189
Li D, Wang S and Yuan P 2010 An overview of development of tidal current in China: Energy resource, conversion technology and opportunities. Renew. Sust. Energy Rev. 14: 2896–2905
Li F C, Fan H G and Wang Z W 2011 Optimum design of runner blades of a tubular turbine based on vorticity dynamics. Tsinghua Univ (Sci & Tech) 51 (6): 836–839
Liu S H, Yang W and Wu Y L 2007 3-D steady turbulent simulation and modification of the tubular turbine. J. Hydroelectr. Eng. 26: 110–113
Liu H, Ma S, Li W, Gu H, Lin Y and Sun X 2011 A review on the development of tidal current energy in China. Renew. Sust. Energy Rev. 15: 1141–1146
Luo X Y and Pedley T J 1996 A numerical simulation of unsteady flow in a two-dimensional collapsible channel. J. Fluid Mech. 314: 191–225
Masters I, Malki R, Williams A J and croft T 2013 The influence of flow acceleration on tidal stream turbine wake dynamics: A numerical study using a coupled BEM–CFD model. Appl. Math. Model 37: 7905–7918
Margheritini L, Vicinanza D and Frigaard P 2009 SSG wave energy converter: Design, reliability and hydraulic performance of an innovative overtopping device. Renew. Energy 34: 1371–1380
Ranade V V, Perrard M, Le Sauze N, Xuereb C and Bertrand J 2001 Trailing vortices of Rushton turbine: PIV measurements and CFD simulations with snapshot approach. Chem. Eng. Res. Des. 79: 3–12
Rusu E and Guedes Soares C 2009 Numerical modelling to estimate the spatial distribution of the wave energy in the Portuguese nearshore. Renew. Energy 34: 1501–1516
Saeed R A and Galybin A N 2009 Simplified model of the turbine runner blade. Eng. Fail. Anal. 16: 2473–2484
Shi H D, Wang Z Q, Liu Y J, Xue K and Kang M C 2013 An experimental study on low-head turbine’s performance. Acta Energiae Solaris Sinica 11: 2038–2043
Sierra F Z, Mazur Z, Kubiak J, Urquiza G, Zuniga R, Marino C and Hernandez A 2000 Modelling of the flow at the last stage blade tenon in a geothermal turbine using renormalization group theory turbulence model. Appl. Therm. Eng. 20: 81–101
Vicinanza D and Frigaard P 2008 Wave pressure acting on a seawave slot-cone generator. Coast. Eng. 55: 553–568
Author information
Authors and Affiliations
Corresponding author
Additional information
Acknowledgements
The research work was supported by the following funding: Research on hydrodynamic issues in tidal power (Chinese National Foundation of Natural Science-Key Projects, No. 51339005) and the Fundamental Research Funds for the Central Universities (No. 2014B37614). The Chinese Scholarship Council supports the first author (No. 201406710029) for studying in the University of Manchester (UK), where this paper was competed.
Rights and permissions
About this article

Cite this article
ZHANG, Y., ZHENG, Y., YANG, C. et al. System design and optimization study of axial flow turbine applied in an overtopping wave energy convertor. Sadhana 40, 2313–2331 (2015). https://doi.org/10.1007/s12046-015-0447-6
Received:
Revised:
Accepted:
Published:
Issue Date:
DOI: https://doi.org/10.1007/s12046-015-0447-6