
Abstract
Garlic slices were dehydrated by convective drying (CD) and by a combined method consisting of convective pre-drying followed by vacuum-microwave finishing drying (CPD-VMFD). Drying of garlic using VMFD led to samples with high values of lightness and slightly lower values of the coordinates a* and b*. The treatment CPD-VMFD significantly decreased the drying time from 630 min for CD to 49 min and contributed to an important energy saving compared with CD (54.4–86.3 %). The total drying time was shorter when vacuum microwaves were introduced earlier and microwave power was higher. The highest temperature (114 °C) was found for samples pre-dried to a moisture content of 60 % and then dried at 360 W while showing the lowest energy consumption (98 ± 1 kJ g−1). In general, the total antioxidant capacity increased after drying of garlic slices; however, the content of total phenolic compounds showed the opposite trend, and thus other compounds, such as allicin, should be involved in the antioxidant capacity of dried garlic. Garlic slices were CP dried until 30 % of moisture content followed by VMFD at 240 or 360 W showed the best results in terms of energy consumption and antioxidant capacity.
Introduction
Garlic (Allium sativum L.) is a semi-perishable spicy herb, which has been used worldwide as seasoning, spice and herbal remedy (Ahmad 1996). Garlic is known to possess a vast variety of biological functions, such as antimicrobial (Kim 2002), anticancer (Patel et al. 2004), anticardiovascular disorders (Gorinstein et al. 2007) and antioxidant properties (Nuutila et al. 2003; Bozin et al. 2008). These properties are related with the chemical composition of garlic, and more specifically with its content of phenolic and sulfur-containing compounds (Benkeblia 2004; Benkeblia 2005; Chung 2006; Bozin et al. 2008).
Due to the complex chemistry of garlic, variations in the processing can yield quite different chemical products. For instance, Maillard reactions which take place during drying of garlic may lead to important modifications such as changes in the antioxidant activity (Moreno et al. 2006) and the presence of Amadori compounds (Cardelle-Cobas et al. 2005). Fresh garlic is consumed worldwide and allicin is considered its predominant bioactive compound (Tsai et al. 2012). Allicin is a sulfur-containing compound responsible for the pungent odor of garlic which has important antioxidant properties and significant health benefits (Yong 2006). Currently, there are many garlic based products on the market, such as dried garlic powder and slices, garlic oil, or garlic mayonnaise.
Dehydration operations have been used for decades in food processing industries for efficient long-term preservation of final products. The basic objective in drying food products is the removal of water from fresh product reaching a level at which microbial spoilage is avoided.
Although convective drying (CD) is still the most popular method applied to fruits and vegetables, however, it has several disadvantages and limitations; for instance, degradation of important flavor and nutritional compounds as well as color alteration due to the temperature used during the process. The drying time can be greatly reduced (about 75 %) (Suárez et al. 2000; Sharma and Prasad 2004; Salazar-González et al. 2012), and the quality of finished food product can be improved (Men'shutina et al. 2005) by applying microwave energy to the material instead of drying by hot air. In this way, thermal degradation of essential nutrients is substantially reduced and preservation of food quality factors, such as color, is achieved (Suárez et al. 2000). For instance, hot air drying led to darker garlic slices than vacuum microwave (VM) dried samples (Rasouli et al. 2011; Cui et al. 2003). Drying using microwave energy under vacuum is a modern, efficient method of food preservation (Durance and Wang 2002). Lowered pressures induce faster evaporation of water from the food at relativity low temperature (Figiel et al. 2010), reducing thus the chemical, sensory, and nutritional alterations in dried products (Drouzas and Schubert 1996). The vacuum-microwave drying (VMD) method is not yet common in the food industry, although recently it has been investigated as a potential method for obtaining high-quality dried foodstuffs, including fruits, vegetables, and grains (Youngswatdigul and Gunasekaran 1996; Drouzas and Schubert 1996; Figiel 2009; Calín-Sánchez et al. 2012). Starting the dehydration in a VMD system, the intensive water evaporation from vegetables and fruits may exceed the vacuum pump capacity; this requires a reduction in the raw material mass or volume being subjected to drying or application of a large vacuum installation. This problem can be overcome by pre-drying the material using CD, which will drastically decrease the mass to be loaded in the VMD system (Hu et al. 2006). Pre-drying of plant materials by convective method before vacuum-microwave finishing drying (CPD-VMFD) can have a significant contribution to the fruit processing industry by reducing the total cost of dehydration and by improving the quality of the commercial dehydrated products (Hu et al. 2006).
Energy analyses have been conducted for different drying methods and conditions for products, such as carrots (Nazghelichi et al. 2010), mushrooms slices (Motevali et al. 2011a), sour pomegranates (Motevali et al. 2011b), and red pepper (Kowalski and Mierzwa 2011). However, this is the first study dealing with the estimation of the energy consumption associated with processing conditions during CPD-VMFD of garlic slices. Therefore, the aim of this study was to determine the best conditions of the CPD-VMFD of garlic slices, minimizing energy consumption and maximizing their antioxidant capacity.
Materials and Methods
Plant Material and Processing of Samples
Fresh garlic (A. sativum L.) bulbs were purchased from a local market in Wrocław (Poland); however, they came from a different Polish city, Krakow. Fresh bulbs were purchased in their optimal stage and were immediately transported to the Institute of Agricultural Engineering (Wrocław University of Environmental Life and Sciences).
Garlic bulbs had initial moisture content (M 0) of 1.19 g of water/g of dry matter. Bulbs were manually peeled, and individual cloves were cut into slices of 5 mm thick. Garlic samples of approximately 60 g were dehydrated until three levels of final moisture content were achieved using two drying protocols:
-
1.
CD was conducted using drying equipment designed and built up in the Institute of Agricultural Engineering (Wrocław University of Environmental and Life Sciences). CD equipment enables simultaneous dehydration of six samples. Garlic samples were placed into trays of 10-cm diameter located at the top of the six pipes supplying the hot air produced by an electric fan. Convective method was operated at temperature of 60 °C with an air velocity of 1.4 m s−1.
-
2.
Combined drying (CPD-VMFD) consisted of CPD at temperature of 60 °C until M of 60, 30, or 15 % wet basis (wb), followed by VMFD with 240, 360, or 480 W (Fig. 1). VMDF was carried out in Plazmatronika SM 200 dryer (Wroclaw, Poland) connected to a vacuum system consisting of a vacuum pump BL 30P (“Tepro,” Koszalin, Poland), a vacuum gauge MP 211 (“Elvac,” Bobolice, Poland), and a compensation reservoir of 0.15 m3 (Fig. 2). Garlic samples were placed in a cylindrical container of organic glass with volume of 6.8 L. The pressure in the container ranged from 4 to 6 kPa. To avoid local over-heating of fruits, the container rotated at a speed of 6 rpm, and additionally an electric fan was installed at the bottom of the dryer producing an air stream of 22 °C at a velocity of 1 m s−1.
Fig. 1 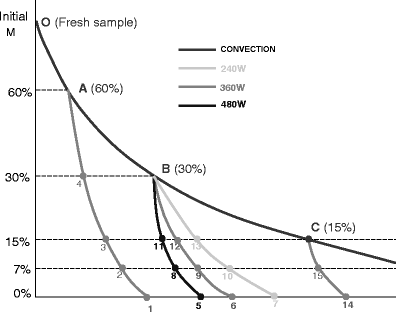
Experiments of combined drying (CPD-VMFD) consisting of CPD at 60 °C until 60, 30, and 15 % of M (wb) followed by VMFD at 240, 360, and 480 W
Fig. 2 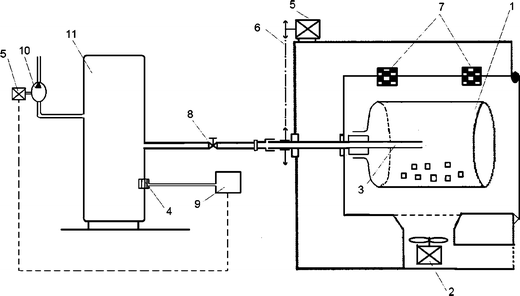
Schematic diagram of vacuum-microwave dryer SM 200: 1, vacuum-drum, 2, fan, 3, air pipe, 4, vacuum sensor, 5, electric motor, 6, transmission chain, 7, magnetrons, 8, valve, 9, vacuum gauge, 10, vacuum pump, and 11, compensation reservoir


Drying Kinetics
The drying kinetics of garlic slices was presented as the decrease of moisture ratio MR versus time of drying t. Moisture ratio MR is defined by Eq. (1), where M(t) is moisture content of garlic slices after time t, M 0 is the initial moisture content and M e is equilibrium moisture content.
The equilibrium moisture content M e is determined by the static method using saturated salt solutions (Babetto et al. 2011). However, this method is time consuming and MR usually is calculated from the simplified Eq. (2) assuming that the values of M e are relatively small compared with M (t) or M 0 (Rasouli et al. 2011):
Therefore, MR for garlic slices was calculated from Eq. (2). The values of M(t) were determined on the basis of mass losses of the garlic slices of initial moisture content M 0 determined by the vacuum oven method.
Basic and possible simple drying models (Table 1) were considered while fitting to the experimental points representing the decrease of MR with time. These models fulfilled the criteria of fitting for garlic slices dried using hot air (Rasouli et al. 2011). In our study, Newton, Page, and Verma models (Table 1) were applied to describe the drying kinetics of garlic slices entirely dehydrated in hot air. In the case of VMFD, the complex form of Verma equation was not appropriate because this phase of drying was relatively fast and did not concern the whole range of MR due to CPD. The last reason also required modifications of Newton and Page models by the introducing of parameter a. However, the modified form of Newton equation is known as Henderson–Pabis model. Therefore, only Henderson–Pabis model as well as modified version of Page model were used for describing the drying kinetics of VMFD (Table 1).
The drying models were evaluated according to coefficient of determination (R 2) and root mean square error (RMSE).
Determination of Moisture Content
The vacuum oven method was used to determine the moisture content (M) of the fresh and processed garlic slices. The slices were dried in vacuum dryer (SPT-200, ZEAMiL Horyzont, Krakow, Poland) for 24 h. The operating temperature was 70 °C. Moisture content was expressed in grams of water per grams of dry matter.
Temperature Measurement
Temperature was controlled because high values could be related to degradation of bioactive compounds. Temperature readings were taken immediately after taking garlic slices out of the VM dryer using an infrared camera Flir i50. The maximum temperature observed was recorded with an accuracy of 0.1 °C. It is expected that the local temperature within material during drying could be higher; however, a direct measurement in the drying chamber under vacuum is not practically possible because the measuring elements are heated by the microwave emission.
Energy Consumption Calculation
Energy Consumption in Convective Method
Energy E C consumed during CD (in kilojoules) was calculated according to Eq. (3):
where N f (in kilowatts) is power consumption by a fan blowing air to six pipes equipped with electric heaters of power consumption N h (in kilowatts) and t is time of drying (in seconds).
Energy Consumption in VM Method
Energy E VM consumed during VM drying (in kilojoules) was calculated according to Eq. (4):
where N M and η M are output power (in kilowatts) and efficiency of magnetrons respectively, N V is power consumption (in kilowatts) by vacuum pump and (N e ) is power consumption (in kilowatts) by electric engine rotating the container.
Determination of Specific Energy Consumption
The specific energy consumption (E′) was calculated from the universal Eq. (5), which can be applied for both CD (E′ = E′ C ) as well as for combined drying consisted of CPD and VMFD (E′ = E′ C–VM). This equation is the ratio of the sum of energy E C and E VM to the total mass of water removed from the fresh sample during drying by convective method (m C) and VM method (m VM):
For entire CD the values of E VM and m VM equal to zero, while for combined drying the values of E C and m C result from the time of convective pre-drying. The specific energy consumption was presented versus the water content, which was changing during drying. The energy savings using CPD-VMFD with respect to CD was calculated as the ratio of the difference in E’ C and E’ C-VM to E’ C (6):
Color Measurement
Color of fresh and dried garlic samples was evaluated by a Konica Minolta Chroma Meter CR-200 Reflectance System (CIEL*a*b*; Konica Minolta, Osaka, Japan). The device is a tristimulus colorimeter that measures four specific wavelengths in the visible range, specified by the Commission Internationale de l’Eclairage. Dried samples were crushed using an electric mill before measurement. The results were expressed as lightness (L*), coordinate green-red (a*), and coordinate yellow–blue (b*). The measurements of color were conducted in triplicate.
Extraction and Determination of Antioxidant Capacity and Total Phenolic Compounds
Extraction
The same extraction protocol was used for the quantification of both antioxidant capacity and total phenolic compounds. The used method was described by Wojdyło et al. (2009). Briefly, 5 g of fresh or dried garlic slices were weighed. Twenty-five milliliters of ultrapure water were added with an extracting agent consisting of MeOH/H2O (80:20) and HCl (1 %). The mixture was softly stirred and submitted to two consecutive sonication steps of 15 min each. After the sonication, the samples were left in tubes during 24 h at 4 °C. Finally, samples were centrifuged for 10 min at 15,000 rpm (centrifuge, MPW 360, Warsaw, Poland). Supernatants were collected and both antioxidant capacity and total phenolic compounds were measured in the next 24 h.
Measurement
Antioxidant capacity was measured as the radical scavenging capacity of free radicals by the ABTS spectrophotometric assay described by Re et al. (1999). Briefly, ABTS was dissolved in ultrapure water at 7 mM concentration. ABTS radical cation (ABTS·+) was produced by reacting ABTS stock solution with 2.45 mM potassium persulfate. Then, the mixture was left to stand in the dark at room temperature for 16 h before use. For the study of garlic samples, the ABTS·+ solution was diluted with ultrapure water to an absorbance of 0.700 (±0.02) at 734 nm. After the addition of 30 μL of supernatant to 3.0 mL of diluted ABTS·+ solution (A 734 nm = 0.700 (±0.02)), the absorbance was read exactly 6 min after initial mixing. All determinations were performed in triplicate. The results of the assay were expressed relative to μM Trolox/100 g of dry weight in terms of TEAC.
The total phenolic compounds assay was performed according to the method described by Wood et al. (2002) with slightly modifications. Briefly, two tubes were prepared for each extraction. In each one of the tubes, 2.5 mL of Folin-Ciocalteu reagent 1/10 (100 mL Folin + 900 mL H2O) were added. Later, 200 μL of the extract were added and then taken to a final volume of 500 μL with phosphate buffer (50 mM, pH 7.5). After 2 min, the reaction was stopped with the addition of 2 mL of Na2CO3 and the mixture was stirred again. Finally, the samples were placed in a warm water bath at 50 °C for 5 min before measurement. The absorbance was read at 760 nm in a spectrophotometer (UV–vis 2401 PC, Kyoto, Japan) and results were expressed as mg of gallic acid 100 g−1 dw.
Statistical Analysis
The program Table Curve 2D Windows v2.03 enabled mathematical modeling with the best parameters of fitting (R 2 and RMSE). The results obtained were evaluated by statistical analysis with the use of the SPSS (SPSS Science, Chicago, IL). In order to find out if the differences in the mean values estimated were statistically significant, the one-way analysis of variance was applied. Later, homogeneous groups were determined with the Duncan’s multiple range test (at significance level α = 0.05).
Results and Discussion
Drying Kinetics
Figure 3 shows the changes of the MR of garlic slices dehydrated by a combination of CPD at 60 °C followed by VMFD at three different power levels (240, 360, or 480 W), while Table 2 shows the constants of the mathematical modeling. In most cases, R 2 values were higher than 0.99, and RMSE values were lower than 0.01; these values demonstrated that the selected models were appropriate to describe the drying kinetics of garlic slices. However, only the best models were fit to the experimental data (Fig. 3).

Drying kinetics for garlic slices dehydrated using CD or combined drying (CPD-VMFD) consisting of CPD at 60 °C until 60, 30, and 15 % of M (wb) followed by VMFD at 240, 360, and 480 W
The Verma model, which in fact is an exponential equation of two terms (Table 1), was selected as the best to describe CD at 60 °C (Table 2). The mathematical structure of this model indicates that the reduction of the MR happened in two different drying periods. In the first period, the drying constant value (k) was 0.062, meaning that the decrease in the MR was faster than in the second period, which was characterized by the value of the drying constant g, 0.007. However, the range of moisture decrease in the first period was much lower than in the second period. These ranges equal to the values of coefficients a and (1-a), namely 0.2204 and 0.7796, respectively; the sum of both parameters amounts to the initial moisture ratio of the fresh garlic slices. The faster decreasing of MR in the first period of CD, indicated by the value of parameter a, was confirmed by the course of the drying rate shown in Fig. 4.

Drying rate for garlic slices dehydrated using combined drying (CPD-VMFD) consisting of CPD at 60 °C until 60, 30, and 15 % of M (wb) followed by VMFD at 240, 360, and 480 W
In the first period of CD, the drying rate decreased rapidly from the highest value of 0.0143 to 0.0082 min−1; while during the second period, the drying rate gradually decreased from 0.0082 to 0.0002 min−1. This drying behavior of garlic slices is in accordance with theoretical issues concerning water diffusivity (Crank, 1975). In this way, during the first period of drying, water easily evaporates from the surface of the dried material to the air by external diffusion (Yiotis et al. 2007). This process creates a moisture gradient inside the material, which enables transport of water to the surface by internal diffusion at slower rate typical of the second drying period (Roberts et al. 2008).
The presence of two drying periods with different drying rates (constant and falling) has been reported in many studies (Pabis 2007). In most cases, the best fitting to the experimental data was provided by Page model; this was the case of garlic (Sharma and Prasad 2004; Babetto et al. 2011), apples (Doymaz 2010), pomegranate arils (Kingsly and Singh 2007), and pumpkin slices (Alibas 2007). Also, Henderson–Pabis model was successfully used to describe drying kinetics of ginger (Thorat et al. 2012), strawberries (Doymaz 2008), as well as VMFD of beetroot (Figiel 2010) or oregano (Figiel et al. 2010).
On the other hand, the Verma model was successful in describing the drying kinetics of garlic slices (Madamba et al. 1996). This study confirmed the importance of the falling rate period, which was characterized by a low drying constant.
In this study, the drying kinetics of VMFD was better described by the modified Page model than by the Henderson–Pabis model (Table 2). For both of these models, parameter a indicated the intermediate moisture content at which the VMFD was applied. The VMFD was faster at higher microwave powers. An increase in microwave power from 240 to 480 W increased the values of parameter n from 0.5295 to 0.8925 in modified Page model and drying constant k from 0.1583 to 0.3440 in Henderson–Pabis model (Table 2). The fast drying observed at high values of microwave power resulted from high drying rates (Fig. 4). Increasing the values of microwave power from 240 to 480 W increased the initial value of drying rate from 0.047 to 0.090 min−1 for samples pre-dried until 30 %.
In the initial stage of CD, the loss of water was relatively fast; as the drying process advanced, the water loss decreased (Maskan 2000). The application of VMFD reduced considerably the total drying time (Table 2). The drying time for CD at 60 °C was 630 min; however, with the application of the combined drying, the total time was reduced to 49 min for the treatment CPD until 60 % of moisture content followed by VMFD at 360 W (60 %–360 W). With an earlier application of VMFD, the drying time was reduced approximately 5 times, from 266 min (15 %–360 W) to 49 min (60 %–360 W). Similar results were previously obtained in pears (Figiel et al. 2008) and beetroot (Figiel 2010). The high effectiveness of VM drying results from the way in which the microwave energy is transformed into heating energy. During VM drying the energy of microwaves is absorbed by the water dipoles (Tang 2005), which are located in the whole volume of the material being dried. This creates a large vapour pressure in the centre of the material, allowing rapid transfer of moisture to the surrounding vacuum and preventing structural collapse (Lin et al. 1998). As a consequence, the drying rate is considerably higher than in traditional methods of dehydration (Sharma and Prasad 2004).
Temperature
During the VMFD, an increment in the temperature was observed until a critical point of M. From this critical point of M, the sample temperature of dried garlic slices started to decrease (Fig. 5). The highest peak of temperature, 114 ± 2 °C, was obtained for those garlic samples dried starting from the higher M (60 %). The lowest peak temperature, 90 ± 4 °C, was obtained when the lowest microwave power was applied (240 W). The temperatures obtained in the case of CPD until 30 % of M followed by VMFD at 360 and 480 W and CPD until 15 % of M followed by VMFD at 360 W were similar and reached values close to 100 °C (Fig. 5). Drouzas and Schubert (1996) reported that during VMD, the highest temperature peaks were obtained in the M range of 0.5–0.8 kg kg−1 db; current results agreed and the highest temperatures were recorded in the range of 0.7–0.9 kg kg−1.

Maximal temperatures recorded during the drying of garlic slices by CPD-VMFD. †p < 0.05, temperature values followed by the same letter, within the same column, were not significantly different according to Duncan’s test
Experimental results showed that the highest temperatures were obtained in dried garlic slices when CPD was applied during shorter times until higher moisture contents. This fact could be due to the garlic slices pre-dried until a M of 60 % required longer times of microwave application for the dehydration and this higher M percentage kept more microwave energy-producing higher temperatures. Also, VM finish-dried beetroot cubes (Figiel 2010) and rosemary samples (Szumny et al. 2010) reached relatively high temperatures at shorter times of CPD. However, in the case of beetroot cubes the highest temperature was obtained by the sample subjected to VMFD after the longest time of CPD. This unexpected behavior might result from the different morphology of cellular system as well as differences in physical parameters of the dried material, such as heat conductivity, specific heat, and thus requires additional studies focused exclusively on the effect of VM drying conditions on the temperature profiles of different plant materials.
The falling in the temperature from the maximal point of temperature could be explained by two hypotheses: (1) creation of lower caloric energy due to decreasing the number of water dipoles activated by the microwaves (Tang 2005) and (2) evaporated water absorbs part of microwave energy reducing the temperature of the samples (Figiel 2009). Therefore, the temperature during VMFD was dependent (p < 0.05) on the moisture content obtained after CPD in garlic slices; higher moisture contents involved longer processes of accumulation and dissipation of microwave energy leading to high temperatures independently of the microwave power. Similar results were obtained by previous researches with rosemary (Szumny et al. 2010) and basil (Calín-Sánchez et al. 2012).
Energy Consumption During Drying of Garlic Slices
The specific energy consumption profiles (Fig. 6) represent the amount of energy per 1 g of water removed from the fresh material while reducing the moisture content. The shape of the specific energy consumption profile showed an increment in the energy required during the last stages of the drying process. This behavior is typical in vegetal products with osmotic cellular structure to protect the vegetal tissues against water loss (Sarsavadia 2007). This profile also indicated that at the end of the drying process more time is required to remove the same amount of water at the targeted power than during the initial stages. However, at the beginning of the VMFD, the specific energy consumption (E′) started to decrease due to the high effectiveness of the VM method. This behavior can be also explained by the form of Eq. 5. Namely, in the ratio of energy to mass of water removed from the sample, the values of E c and m c become constant as the CPD was completed and the contribution of m VM to denominator was higher than the contribution of E VM to numerator. Of course, at the end of VMFD the value of m VM was getting lower in relation to E VM, which resulted in a considerable increase of E′. Eventually, the final values of E′ obtained for the dried product were lower when VMFD was applied earlier and values of microwave power were higher.

Energy consumption of garlic slices drying, using CD and CPD-VMFD methods
CPD until 60 % of M followed by VMFD at 360 W led to the lowest value of specific energy consumption at the end of the drying process, 98 ± 0.8 kJ g−1; this low value was associated with the fact that the VMFD was applied earlier with the highest initial M. In contrast, the highest energy consumption was estimated for the CD at 60 °C, 718 ± 3 kJ g−1. When the VMFD was applied with an initial M of 30 %, the values of E′ ranged between 177 ± 1 kJ g−1 for 480 W and 264 ± 1 kJ g−1 for 240 W (Fig. 6). Finally, energy savings using CPD-VMFD with respect to CD were in the range from 54.42 to 86.25 % (Table 2).
Color Changes During Drying
All dried garlic samples showed significant (p < 0.001) higher values of L* (ranging from 72.1 ± 0.4 to 76.1 ± 1.2) than the fresh sample (64.7 ± 1.2) (Table 3). Regarding the coordinate green-red, a*, there were no significant differences between the fresh and CD-treated samples at 60 °C; however, the color of CPD-VMF dried samples shifted toward green colors, with values being close to 0. Finally, the coordinate blue–yellow, b*, of all samples showed positive values and then the color of both fresh and dried garlic samples had an important yellow component. Fresh garlic and samples C dried at 60 °C had statistically equivalent b* values, 21.6 ± 0.3 and 22.2 ± 0.3, respectively. Garlic slices dried by the combined method (CPD-VMFD) showed significant (p < 0.001) lower b* values than those obtained for both fresh and CD samples; these values ranged between 13.3 ± 1.1 and 19.4 ± 1.8 (Table 3).
These results suggest that CPD-VMFD produced brighter samples with colors shifted towards green and blue. These results agreed quite well with those previously obtained by Figiel (2009) and Sharma and Prasad (2004) in garlic dried under vacuum microwaves and microwaves, respectively.
Total Phenolic Compounds and Total Antioxidant Capacity of Dried Garlic Slices
Both the total phenolic compounds and the antioxidant capacity were significantly affected by the drying process (Table 4), as previously reported in strawberries (Wojdyło et al. 2009) and pomegranate (Calín-Sánchez et al. 2013). Total phenolic compounds significantly (p < 0.001) decreased after the drying process and values ranged between 13.1 ± 0.3 mg gallic acid 100 g−1 db for CPD-VMFD (60 %–360 W) and 79.7 ± 7.6 mg gallic acid 100 g−1 for the fresh samples. However, the CPD-VMFD method did not show significantly better results compared with CD. Thus, other factors such as time and energy consumption must be considered for taking the decision of selecting new alternatives to the traditional drying methods.
A completely different situation was observed for the effect of drying on antioxidant capacity. Dried samples showed significant (p < 0.001) higher antioxidant capacity compared with fresh garlic slices (Table 4) and values ranged between 11.3 ± 0.1 and 89 ± 1 μM Trolox 100 g−1 for samples dried by CD and CPD-VMFD (intermediate stage of 30 %–240W), respectively.
The antioxidant capacity in several intermediate stages of the VMFD (8, 9, 10, and 11) was significantly higher (p < 0.001) than at the beginning of the VMFD (Table 4), as previously reported by Manzocco et al. (2000). This behavior could be the result of two different factors: (1) some phenolic compounds have greater antioxidant capacity in some intermediate oxidation stages (Manzocco et al. 2000) and (2) thermal processing may induce the formation of new compounds with high antioxidant capacity (Manzocco et al. 2000); these compounds could be those formed by the Maillard reaction (Manzocco et al. 2000; Wojdyło et al. 2009; Calín-Sánchez et al. 2013).
The lack of positive correlation between antioxidant capacity and total phenolic content in could be attributed to the fact that not only phenolic compounds are the responsible of the antioxidant capacity of dried garlic. For instance, Li et al. (2007) reported an increase in the allicin during the thermal processing of garlic powder. Allicin and its derived products have been described as potent natural antioxidants (Yong 2006; Youji et al. 2006). The presence of allicin and its derived products could be responsible, at least partially, of the high antioxidant capacity of dried garlic slices.
Conclusions
Drying kinetics of garlic slices dried by the convective method was described by a two-term exponential model (Verma model), while drying kinetics of VMFD garlic was described by a one-term exponential function (modified Page model). The highest temperatures of the dried material were recorded when the VMFD was applied earlier. Drying of garlic slices by CPD-VMFD required less energy consumption than drying using the traditional CD. VMFD samples pre-dried until 60 % followed by VMFD at 360 W showed the lowest specific energy consumption of all studied drying treatments, 98 ± 0.8 kJ g−1. The energy savings of CPD-VMFD was very important compared with CD and ranged between 54.42 and 86.25 %. The total phenolic content was not significantly improved by the used of the combined drying method compared with the CD. However, a decrease in the M produced an increment in the antioxidant capacity of garlic slices. Dried garlic showed even higher antioxidant capacity than fresh samples. The highest antioxidant capacity was obtained for samples dried using CPD until 30 % of M and VMFD at 240 W. Results suggested that phenolic compounds and other chemical compounds, such as allicin, were responsible for the antioxidant capacity of dried garlic slices. Thus, the final recommendation considering both energy consumption and antioxidant capacity was that the best treatment for drying garlic slices was: CPD at 60 °C until a M of 30 % followed by VMFD at 240 or 360 W.
Abbreviations
- a, n :
-
Function parameter (in kilograms per kilogram db)
- CD:
-
Convective drying
- CPD:
-
Convective pre-drying
- db:
-
Dry basis
- Ec :
-
Energy consumption in convective method (in kilojoules)
- E VM :
-
Energy consumption in vacuum microwave drying (in kilojoules)
- E′:
-
Specific energy consumption (in kilojoules per gram)
- Es :
-
Energy savings (in percent)
- exp:
-
Experimental data
- fw:
-
Fresh weight
- k, g :
-
Drying constants (in minutes)
- m :
-
Mass (in grams)
- M :
-
Moisture content (in kilograms per kilogram db)
- M 0 :
-
Initial moisture content (in kilograms per kilogram db)
- M e :
-
Moisture content at equilibrium (in kilograms per kilogram db)
- MR:
-
Dimensionless moisture ratio
- \( \overline{\mathrm{MR}} \) :
-
Mean dimensionless moisture ratio
- N :
-
Power consumption (in kilowatts)
- η m :
-
Efficiency of magnetrons
- pre:
-
Predicted data
- R 2 :
-
Coefficient of determination
- RMSE:
-
Root mean square error
- rpm:
-
Revolutions per minute
- t :
-
Time (in minutes)
- VM:
-
Vacuum microwave
- VMFD:
-
Vacuum microwave finishing drying
- wb:
-
Wet basis
References
Ahmad, J.-I. (1996). Garlic—a panacea for health and good taste? Nutrition and Food Science, 96(1), 32–35.
Alibas, I. (2007). Microwave, air and combined microwave-air-drying parameters of pumpkin slices. Lebensm-Wiss Technology, 40, 1445–1451.
Andres, A., Bilbao, K., & Fito, P. (2004). Drying kinetics of apple cylinders under combined hot air-microwave dehydration. Journal of Food Engineering, 63, 71–78.
Babetto, A.-C., Freire, F.-B., Barrozo, M.-A.-S., & Freire, J.-T. (2011). Drying of garlic slices: kinetics and nonlinearity measures for selecting the best equilibrium moisture content equation. Journal of Food Engineering, 107(3–4), 347–352.
Benkeblia, N. (2004). Antimicrobial activity of essential oil extracts of various onions (Allium cepa) and garlic (Allium sativum). Lebensm-Wiss Technology, 37, 263–268.
Benkeblia, N. (2005). Free-radical scavenging capacity and antioxidant properties of some selected onions (A. cepa L.) and garlic (A. sativum L.) extracts. Brazilian Archives of Biology and Technology, 48(5), 753–759.
Bozin, B., Mimica-Dukic, N., Samojlik, I., Goran, A., & Igic, R. (2008). Phenolics as antioxidants in garlic (A. sativum L., Alliaceae). Food Chemistry, 111(4), 925–929.
Calín-Sánchez, A., Figiel, A., Hernández, F., Melgarejo, P., Lech, K. & Carbonell-Barrachina, A.-A. (2013). Chemical composition, antioxidant capacity, and sensory quality of pomegranate (Punica granatum L.) arils and rind as affected by drying method. Food and Bioprocess Technology. doi:10.1007/s11947-012-0790-0.
Calín-Sánchez, A., Lech, K., Szumny, A., Figiel, A., & Carbonell-Barrachina, A.-A. (2012). Volatile composition of sweet basil essential oil (Ocimum basilicum L.) as affected by drying method. Food Research International, 48, 217–225.
Cardelle-Cobas, A., Moreno, F. J., Corzo, N., Olano, A., & Villamiel, M. (2005). Assessment of initial stages of Maillard reaction in dehydrated onion and garlic samples. Journal of Agricultural and Food Chemistry, 53, 9078–9082.
Chung, L.-Y. (2006). The antioxidant properties of garlic compounds: allyl cysteine, alliin, allicin, and allyl disulfide. Journal of Medical Food, 9(2), 205–213.
Crank, J. (1975). The mathematics of diffusion (2nd ed., p. 414). London, UK: Oxford University Press.
Cui, Z.-W., XU, S.-Y., & Sun, D.-W. (2003). Dehydration of garlic slices by combined microwave-vacuum and air drying. Drying Technology, 21(7), 1173–1184.
Doymaz, I. (2008). Convective drying kinetics of strawberry. Chemical Engineering and Processing, 47(5), 914–919.
Doymaz, I. (2010). Effect of citric acid and blanching pre-treatments on drying and rehydration of Amasya red apples. Food and Bioproducts Processing, 88, 124–132.
Drouzas, A.-E., & Schubert, H. (1996). Microwave application in vacuum drying of fruits. Journal of Food Engineering, 28(2), 203–209.
Durance, T.-D., & Wang, J.-H. (2002). Energy consumption, density, and rehydration rate of vacuum-microwave and hot-air convection-dehydrated tomatoes. Journal of Food Science, 67(6), 2212–2216.
Figiel, A. (2009). Drying kinetics and quality of vacuum-microwave dehydrated garlic cloves and slices. Journal of Food Engineering, 94(1), 98–104.
Figiel, A. (2010). Drying kinetics and quality of beetroots dehydrated by combination of convective and vacuum-microwave methods. Journal of Food Engineering, 98(4), 461–470.
Figiel, A., Szumny, A., Gutierrez-Ortiz, A., & Carbonell-Barrachina, A.-A. (2010). Composition of oregano essential oil (Origanum vulgare) as affected by drying method. Journal of Food Engineering, 98(2), 240–247.
Figiel, A., Wojdyło, A., Juszczyk, P. & Carbonell-Barrachina, A.-A. (2008). Drying of pears by a combination of convective and vacuum-microwave methods. In: Proceedings of the 16th International Drying Symposium, Hyderabad, India.
Gorinstein, S., Jastrzebski, Z., Namiesnik, J., Leontowicz, H., Leontowicz, M., & Trakhtenberg, S. (2007). The atherosclerotic heart disease and protecting properties of garlic: contemporary data. Molecular Nutrition & Food Research, 51(11), 1365–1381.
Hu, Q.-G., Zhang, M., Mujumdar, A.-S., Xiao, G.-N., & Jin-Cai, S. (2006). Drying of edamames by hot air and vacuum microwave combination. Journal of Food Engineering, 77(4), 977–982.
Kim, J.-Y. (2002). Alliinase-independent inhibition of Staphylococcus aureus B33 by heated garlic. Journal of Food Science, 67(2), 780–785.
Kingsly, A.-R.-P., & Singh, D.-B. (2007). Drying kinetics of pomegranate arils. Journal of Food Engineering, 79, 741–744.
Kowalski, S.-J., & Mierzwa, D. (2011). Hybrid drying of red bell pepper: energy and quality issues. Drying Technology, 29, 1195–1203.
Li, Y., Xu, S.-Y., & Sun, D.-W. (2007). Preparation of garlic powder with high allicin content by using combined microwave–vacuum and vacuum drying as well as microencapsulation. Journal of Food Engineering, 83, 76–83.
Lin, T.-M., Durance, T.-D., & Scaman, C.-H. (1998). Characterization of vacuum microwave, air and freeze dried carrot slices. Food Research International, 31(2), 111–117.
Madamba, P.-S., Driscoll, R.-H., & Buckle, K.-A. (1996). The thin-layer drying characteristics of garlic slices. Journal of Food Engineering, 29, 75–97.
Manzocco, L., Calligaris, S., Mastrocola, D., Nicoli, M.-C., & Lerici, C.-R. (2000). Review of non-enzymatic browning and antioxidant capacity in processed foods. Trends in Food Science and Technology, 11(9–10), 340–346.
Maskan, M. (2000). Microwave/air and microwave finish drying of banana. Journal of Food Engineering, 44(2), 71–78.
Men'shutina, N.-V., Gordienko, M.-G., Voinovskii, A.-A., & Kudra, T. (2005). Dynamic criteria for evaluating the energy consumption efficiency of drying equipment. Theoretical Foundations of Chemical Engineering, 39(2), 158–162.
Moreno, F.-J., Corzo-Martínez, M., Del Castillo, M.-D., & Villamiel, M. (2006). Changes in antioxidant activity of dehydrated onion and garlic during storage. Food Research International, 39, 891–897.
Motevali, A., Minaei, S., & Khoshtaghaza, M.-H. (2011a). Evaluation of energy consumption in different drying methods. Energy Conversion and Management, 52, 1192–1199.
Motevali, A., Minaei, S., Khoshtaghaza, M.-H., & Amirnejat, H. (2011b). Comparison of energy consumption and specific energy requirements of different methods for drying mushroom slices. Energy, 36(11), 6433–6441.
Nazghelichi, T., Kianmehr, M.-H., & Aghbashlo, M. (2010). Thermodynamic analysis of fluidized bed drying of carrot cubes. Energy, 35(12), 4679–4684.
Nuutila, A.-M., Puupponen-Pimia, R., Aarni, M., & Oksman-Caldentey, K.-M. (2003). Comparison of antioxidant activities of onion and garlic extracts by inhibition of lipid peroxidation and radical scavenging activity. Food Chemistry, 81(4), 485–493.
Pabis, S. (2007). Theoretical models of vegetable drying by convection. Transport in Porous Media, 66, 77–87.
Patel, J., Buddha, B., Dey, S., Pal, D., & Mitra, A.-K. (2004). In vitro interaction of the HIV protease inhibitor ritonavir with herbal constituents: changes in P-gp and CYP3A4 activity. American Journal of Therapeutics, 11(4), 262–277.
Rasouli, M., Seiiedlou, S., Ghasemzadeh, H. R., & Nalbandi, H. (2011). Convective drying of garlic (Allium sativum L.): part I: drying kinetics, mathematical modeling and change in color. Australian Journal of Crop Science, 5(13), 1707–1714.
Re, R., Pellegrini, N., Proteggente, A., Pannala, A., Yang, M., & Rice-Evans, C. (1999). Antioxidant activity applying an improved ABTS radical cation decolorization assay. Free Radical Biology & Medicine, 26(9/10), 1231–1237.
Roberts, J.-S., Kidd, D.-R., & Padilla-Zakour, O. (2008). Drying kinetics of grape seeds. Journal of Food Engineering, 89(4), 460–465.
Salazar-González, C., Martín-González, M.-F.-S., López-Malo, A., & Sosa-Morales, M.-E. (2012). Recent studies related to microwave processing of fluid foods. Food and Bioprocess Technology, 5(1), 31–46.
Sarsavadia, P.-N. (2007). Development of a solar-assisted dryer and evaluation of energy requirement for the drying of onion. Renewable Energy, 32, 2529–2547.
Sharma, G.-P., & Prasad, S. (2004). Effective moisture diffusivity of garlic cloves undergoing microwave-convective drying. Journal of Food Engineering, 65(4), 609–617.
Suárez, C., Viollaz, P.-E., Rovedo, C.-O., Tolaba, M.-P., & Haros, M. (2000). Improved drying techniques and microwave food processing. In S. M. Alzamora, M. S. Tapia, & A. López-Malo (Eds.), Minimally processed fruits and vegetables (pp. 175–188). Gaithersburg: Aspen.
Szumny, A., Figiel, A., Gutiérrez-Ortíz, A., & Carbonell-Barrachina, A.-A. (2010). Composition of rosemary essential oil (Rosmarinus officinalis) as affected by drying method. Journal of Food Engineering, 97(2), 253–260.
Tang, J. (2005). Dielectric properties of foods. In: The microwave processing of foods. Boca Raton: CRC Press, pp. 22–40.
Thorat, I.-D., Mohapatra, D., Sutar, R.-F., Kapdi, S.-S., & Jagtap, D.-D. (2012). Mathematical modeling and experimental study on thin-layer vacuum drying of ginger (Zingiber Officinale R.) slices. Food and Bioprocess Technology, 5, 1379–1383.
Tsai, C.-W., Chen, H.-W., Sheen, L.-Y., & Lii, C.-K. (2012). Garlic: health benefits and actions. Biomedicine, 2(1), 17–29.
Wojdyło, A., Figiel, A., & Oszmiański, J. (2009). Effect of drying methods with the application of vacuum microwaves on the bioactive compounds, color, and antioxidant activity of strawberry fruits. Journal of Agricultural and Food Chemistry, 57(4), 1337–1343.
Wood, J.-E., Senthilmohan, S.-T., & Peskin, A.-V. (2002). Antioxidant activity of procyanidin-containing plant extracts at different pHs. Food Chemistry, 77(2), 155–161.
Yiotis, A.-G., Tsimpanogiannis, I.-N., Stubos, A.-K., & Yortsos, Y.-C. (2007). Coupling between external and internal mass transfer during drying of a porous medium. Water Resources Research, 43(W06403), 12. doi:10.1029/2006WR005558.
Yong, C.-L. (2006). The antioxidant properties of garlic compounds: allyl cysteine, alliin, allicin, and allyl disulfide. Journal of Medicinal Food, 9(2), 205–213.
Youji, O., Kaoru, T., Eisuke, S., & Haruo, O. (2006). Kinetic and mechanistic studies of allicin as an antioxidant. Organic and Biomolecular Chemistry, 4(22), 4113–4117.
Youngswatdigul, J., & Gunasekaran, S. (1996). Microwave vacuum drying of cranberries. I. Energy use and efficiency. Journal of Food Processing and Preservation, 20(2), 121–143.
Acknowledgments
This work was supported by the Polish Ministry of Science and Higher Education under grant No. N312 031 32/2036. A.C.S. was funded by a grant of the Becas Faro Fellowship Programme from the Spanish Ministry of Education.
Author information
Authors and Affiliations
Corresponding author
Rights and permissions
About this article
Cite this article
Calín-Sánchez, Á., Figiel, A., Wojdyło, A. et al. Drying of Garlic Slices Using Convective Pre-drying and Vacuum-Microwave Finishing Drying: Kinetics, Energy Consumption, and Quality Studies. Food Bioprocess Technol 7, 398–408 (2014). https://doi.org/10.1007/s11947-013-1062-3
Received:
Accepted:
Published:
Issue Date:
DOI: https://doi.org/10.1007/s11947-013-1062-3