
Abstract
In a teaching experiment carried out at the secondary school level, we observe the students’ processes in modelling activities, where the use of graphic calculators and connectivity software gives a common working space in the class. The study shows results in continuity with others emerged in the previous ICMEs and some new ones, and offers an analysis of the novelty of the software in introducing new ways to support learning communities in the construction of mathematical meanings. The study is conducted in a semiotic-cultural framework that considers the introduction and the evolution of signs, such as words, gestures and interaction with technologies, to understand how students construct mathematical meanings, working as a community of practice. The novelty of the results consists in the presence of two technologies for students: the “private” graphic calculators and the “public” screen of the connectivity software. Signs for the construction of knowledge are mediated by both of them, but the second does it in a social way, strongly supporting the work of the learning community.
1 Introduction
In recent years, we have a new generation of technology at our disposal for teaching and learning in addition to technologies already present (computers and calculators). We are referring to a technology that enables us to work together, share the products of our problem-solving strategies, discuss on a theme and give or receive feedback on our work in real time: in a word, to be a community of practice (Wenger 1998) or, to be more precise, a learning community (Bielaczyc and Collins, 1999). In a learning community, the goal is to advance the collective knowledge and in that way to support the growth of individual knowledge. The defining quality of a learning community is that there is a culture of learning in which everyone is involved in a collective effort of understanding, while the goal of a community of practice can be different from an educational one.
A community of learners is something more than a community of practice, because the members do not interact spontaneously; rather, they are induced by an educational aim. This community has the aim to socially construct knowledge and to share the process of construction. Namely, people involved in it are active together (in a synchronous or an asynchronous way) and have common objectives. For example, we can consider a class of students or teachers as a learning community (Jaworski et al. 2007). This kind of community can work via distance learning, as reported in literature (Borba and Zulatto 2006; Jonassen 2007), in the class with face-to-face interaction (Dougherty and Hobbs 2007; Robutti et al. 2009; Hivon et al. 2008) or in a blended approach (face-to-face and distance). The differences among the approaches include the kind of involvement of the participants, extent of participation in the interaction and the amount of synchronous versus asynchronous work done. The common feature is the use of a new technology, which is not neutral in the construction of mathematical knowledge. In fact, this technology can change not only the class work, but also the relationships between pupils and mathematics, between teachers and pupils and among pupils themselves (Hivon et al. 2008). As Borba writes: “if process is considered, I believe that we may be on the way to discovering a qualitatively different medium that, like the “click and drag” tool of the dynamic geometry, offers a new way of doing mathematics that has the potential to change the mathematics produced” (Borba 2005, p. 175, emphasis added). Borba refers in his article to the use of a platform to carry out an online course for teachers in his country. These teachers interact through the platform utilities such as chat rooms, forums and the use of geometry software. The integration of what he calls “old” information and communication technology and “new” one (considering the platform, e-mail and Internet for distance courses) is the difference between the usual technology and a new tool that forces the community to work together, with the coordination of a university professor. The intriguing challenge to mathematics education is in introducing and managing these utilities, “which are no longer ‘simple’ tools but new working systems” (Hivon et al. 2008, emphasis added). So, my interest lies in exploring the ways in which connectivity software such as TI-Navigator is new, with respect to the usual technology a class has used until now, such as computers or calculators. In fact, even if calculators connected to a public display in the classroom (thanks to TI-Navigator), are different from a platform, e-mail or Internet, their use is similar to some Web-based courses. In both cases, connectivity among students and with the teacher, working together, sharing results and observing others’ processes are possible.
The hypothesis presented in this study is that this connectivity software is new in comparison to calculators, in the same way as social networks are new in comparison to a static Web site. This is because it supports the activation of a learning community in a class, where participation, sharing and the interaction of all students form the basis of their activities. The new tool consists of a set made of the following: graphic calculators for the students, the teacher’s computer with connectivity software installed and a fire-wire connection between the students’ calculators and the teacher’s computer, made by specific hubs linked to them. The hubs and the software carry out the connection between the calculators and the teacher’s computer. The possibility of sharing the work done on the calculators in the classroom gives a new resource to construct mathematical knowledge by a community of learners.
A second research hypothesis is that the software is not only a novelty from a technological point of view, but also from a cognitive perspective. In fact, students’ processes are different from those present in a usual class working only with calculators or computers, because there is the possibility to share results and discuss them in real time. This technology provides an opportunity for students to do mathematics together and to look at each other’s work, while performing their own activity. This plural interaction between learners supported by this technology constitutes the main difference in comparison with calculators alone, used by individuals or small groups.
2 Teaching experiment and methodology
The research group that I belong to has two teacher researchers (Silvia Ghirardi and Marialuisa Manassero), a master’s student (Maria Teresa Ravera) and myself. We conducted two teaching experiments at the secondary school level (two tenth grade classes), one of which is described in this study. The students solved modelling activities, working in small groups with graphic calculators TI-84® (Texas Instruments) and the connectivity software TI-Navigator® (Texas Instruments).
In TI-Navigator, the public display consists of a common Cartesian plane (called Activity Center), to which each student and the teacher can give their personal contribution, inserting mathematical objects as points, lines, etc. (Fig. 1) from their calculators, thanks to the connectivity. Another environment is the Screen Capture (Fig. 2), through which all the students’ screens are simultaneously captured and visible on the teacher’s screen. Both the environments can be projected on a big screen if the teacher’s computer is connected to a video projector. In this study, I show protocols referring to the first environment (Fig. 1), even if we use both of these environments. The use of these two environments was made in the function of the activities.

Activity center

Screen capture
This software is substantially different from the standard equipment, which is made up of computers or calculators and is used by groups (or individuals), who follow their calculator screens without information about what is happening in the other groups. With the usual equipment, if the teacher wants information on the processing done by the students he or she has to pass from one group to the other, discussing with each of them without involving other groups. If students want to share their results with the rest of the class, they have to describe them in a class discussion. With Navigator, each group may follow his work and simultaneously also the work of other groups by looking at the big screen. In this way, group work and discussion are more integrated together. The teacher herself/himself may therefore remain in a central position, following every job on the big screen, discussing with a single group or guiding a class discussion where everyone can take part, because information is shared among all the students.
The methodology of the teaching experiments follows the approach of mathematics laboratory, developed in the Italian mathematics education community and presented at ICME10 in various ways: discussion group (Chapman and Robutti 2008), CD-ROM, presentations and a booklet on recent Italian mathematics education research. A mathematics laboratory is a methodology based on various and structured activities, and aimed at the construction of meanings of mathematical objects. A mathematics laboratory activity involves people, structures, ideas, as well as a Renaissance workshop, in which the apprentices learn by doing, seeing, imitating and communicating with each other, namely practicing. In the activities, the construction of meanings is strictly bound, on one hand, to the use of tools, and on the other, to the interactions between people working together.
The students work together in small groups (two or maximum three members); each group uses one graphic calculator connected to a network hub, which communicates with the teacher’s computer via a wireless connection. The option of giving one calculator to each group and not one per student is made to encourage collaborative work among pupils. Each group has to complete one worksheet on paper, containing questions about the activity that is being solved. Each activity is carried out in a class equipped with the following technology: a computer connected to a projector directed onto a big screen, the calculators and the hubs. The connectivity software supports the exchange of data between the teacher and the groups.
The activities are followed by collective discussions conducted by the teacher, with the modality of mathematical discussion (Bartolini Bussi 1996). The alternation between group activities and discussions among the whole class was done to share results immediately (in the same room, in the same unit of lesson) among the community of learners.
The role of the teacher is to coordinate social activity to lead the construction from subjective meanings towards objective cultural meanings without giving responses, but rather by letting the students feel free to discuss, compare, conjecture, imagine and connect various ideas and concepts. A university master’s student is present in the class to record all the activities with a video camera. A researcher (the author) is present during the activity and helps the teacher in observing the groups or guiding the discussion.
The teacher and researcher planned the activities together and introduced them into the class curriculum for the year. In the classroom, they worked together with synergy, not giving students the right answers, but posing questions to help them in case of difficulties, making arguments, inviting observation of all the elements of the problem, supporting conjectures and considering mistakes as occasions to learn. Namely, their role is to help and support students, not to judge or to penalise them. In this way, all students could participate in the task, solving problems and constructing meanings of mathematical objects, considering themselves as part of a community of practice.
The topic developed in the teaching experiment was related to the so-called mathematics of change (Kaput and Roschelle 1998), with the aim of developing competences related to the number sense (Sowder 1992), the graph sense (Robutti 2006) and the symbol sense (Arcavi 1994) in an integrated approach, as in other studies I have conducted at various school levels (Robutti 2007; Robutti 2009). At the tenth grade, one component of the curricula is: functions of first and second degree, with their representations. As cognitive roots (Tall 1989) for the description of a function, we choose the qualitative concept of invariance and the quantitative concept of slope (as ratio of increments) and its variation. Related to these roots, we also use other concepts such as: domain, sign, intersection, zero, parallelism, etc. The activities are centred on families of functions, principally linear, quadratic and exponential, and the construction of meaning starts from modelling problems.
The table shows the plan of activities in the teaching experiment in Silvia Ghirardi’s class.

There are two key elements of this teaching experiment: the integration of different technologies, managed by students and teacher, and the collective construction of meanings and solutions. The different tools used are: paper and pencil, calculators with various environments (graphs, numerical tables and calculations) and software with Screen Capture and Activity Center. During discussion, another tool is the catalyst of attention and the mediator for the collective construction of meaning: the big screen. The big screen contains the work done by all the groups and supports comparison among solutions, the invariance of methods and results or the visibility of errors. It also provides the teacher with the possibility of guiding the discussion, referring to some particulars of the solutions projected with gestures, words or other signs, and so enlarges the semiotic activity in the class. With the production of the group at their disposal, teacher and students can refer not only to products, but also to processes of solution and construction of meanings, focusing their attention on what is projected on the screen and not having to describe it on a blackboard.
Data of the teaching experiment are: written materials (worksheets), the calculator screens or teacher’s computer screen, and videos. These data are analysed in terms of students’ semiotic resources (language, signs, gestures, actions on artefacts), their introduction and evolution.
3 Calculators in mathematics education
According to the main issues of the Rome ICMI Symposium 2008, we can say that every tool introduced in the classroom influences the students, while constructing mathematical meanings, and mediates this construction at a cognitive level. This is confirmed by a range of studies (e.g., Bartolini Bussi and Mariotti 2008; Borba and Villarreal 2005; Noss et al. 1997). Traditionally, from the Dienes blocks to the first calculators, from the programming languages of computer science (Logo, Pascal or Fortran) to the mathematics software such as CAS, from the spreadsheets to the microworlds, the use of technology in mathematics has mostly been by individuals or reserved to small groups (two–three students for each of these) (e.g., Ferrara et al. 2005; Laborde et al. 2006). Of course, it does not mean that the activity cannot be discussed in the class in a collective way, managed by the teacher, but that everyone’s work is not visible to everybody. In some cases “the personal or private use of the tool in fact served to breakdown group communications” (Leung 2008, p. 228). The main difference between this use of technology and the one described in the study is the affordability of the new technology being used, which “acts” in a new way, because of the new interface that allows public display of students’ work and connectivity among students.
The use of calculators for doing mathematics is recent: in the last 10–15 years, lots of experiments have been carried out to investigate the impact of these tools on learning mathematics with different methodologies, mainly at the secondary school level. In previous ICMEs, there have been several studies, from various perspectives, on computers and calculators and their impact on learning mathematics. They described the kind of tool used, the possible mediation in constructing meanings, the methodology induced by tools and the use of relevant theoretical frameworks to analyse the role of technology in teaching and learning. For example, Lagrange, in ICME8, reports on teaching experiments made in France to observe different mediation of CAS in algebra activities, comparing the work done by a class on computers in a laboratory and on calculators in the classroom. His results show that (Lagrange 1997):
-
Computer sessions are less frequent, because the laboratory facility is shared among several classes. Therefore, the computer laboratory sessions have to be alternated with sessions in the classrooms, carried out with traditional tools and methodology. In contrast to using calculators, students can decide at any time to use computer algebra system during each algebra session in the classroom.
-
In a computer laboratory, it is difficult to focus the students’ attention on a whole class activity, whereas in the classroom the students can participate in a class discussion and pay attention to the work being done on the blackboard, even if they use portable devices. “Very often, the discussion started about the output on the screen of a pupil’s device, when he compared with the screen of the teacher as displayed on the wall, and the other students participated actively” (Lagrange 1997, p. 116–117).
-
“The sessions in a computer room were quite long periods of autonomous problem solving. The teacher could very hardly control the advancement of the research in every team. Therefore, the work of the students often had not the significance that the teacher expected. Also, the students could rarely make clear this significance. Therefore, the collective discussion about this work, that took place in the next session, was very necessary to give the findings of the students a mathematical meaning. With the TI-92, the research steps were much shorter, and students’ attention was constantly directed towards the collective advancement of the task. Therefore, the students sometimes could not give this research enough application and reflection, because they were pressed to advance it” (Lagrange 1997, p. 117). In this situation, the teacher can easily follow, redirect, and guide the work done by the students, more than in a computer session.
Other issues that have been raised at ICMEs have been the use of computer or calculators for looking at real phenomena and modelling them through graphs, making motion experiments with sensors and calculators and investigating on graphs, making prevision and checking conjectures, describing shapes and relating graphs and number tables of physical quantities, using graphic calculators to investigate on families of functions, and describing the changing of graphs related to the changing of parameters in the equation. Common features of these teaching experiments are that students work in small groups, observing experiments on video or making them by themselves, collecting data and inferring on models of motion, or solving problems posed by the teacher or by themselves in certain cases. For example, Hudson (1997) refers on “the quite exceptional power of the medium to support and sustain collaborative learning. The fact that groups of 14-year-olds consistently interacted with each other and the system for thirty minutes at a time to sketch, reflect on and discuss graphs of motion, in relatively unsupervised conditions, almost came to be taken for granted during the classroom trials” (Hudson 1997, p. 109). His evidence is consistent with other results, reported by Teasley and Roschelle (1993), namely the fact that in ordinary circumstances, one cannot imagine two 15-year-olds sitting down for 45 min to construct a rich shared understanding of velocity and acceleration. The author shows with examples of protocols the importance of feedback (positive or negative) and the high level of interaction existent in students’ groups, not made only of words and actions on the computers, but also of gestures for pointing to parts of the screen or for showing shapes and ideas (Hudson 1997).
Other authors refer to the use of graphic calculators for exploring and solving problems on the theme of functions. For example, Borba (1997) at ICME8 discussed the possibilities for graphic calculators to enhance the mathematical discussion in the classroom, reorganising the way knowledge is produced. In the teaching experiment, students use calculators to solve investigation problems (for example, the role of parameters in the equation of a parabola) and then discuss together, coordinated by the teacher. First, students use their calculator to explore an open problem in small groups, then intensively discuss their findings, using gestures and language, and project the screen of their calculator through a data-projector to show their work and results. The author shows in his study that calculators support an intensification of the discussion in the classroom: “In a sense the calculators represented a new ‘authority’ in the classroom, in addition to the teacher, as the students found strong support for their positions in the graphical results of their experimentation” (Borba 1997, p. 59). They pursue different paths of inquiry and facilitate more independent investigations and generations of conjectures, contributing to a certain sense of ownership that may also partially explain the intense discussions. As also suggested in other studies (Sutherland 1993), students feel more comfortable when they can develop their investigation without emotional pressure from teachers.
Other authors refer to the use of graphic calculators for modelling situations of motion or of other phenomena involving physical quantities (e.g., pressure, acceleration, temperature). These experiments take place in a laboratory in the classroom or outside, for example in an amusement park, measuring atmospheric pressure on a big wheel (Arzarello et al. 2007). Here, the mathematics laboratory is intended to be a “room without walls”, in the sense that methodology is what makes the difference and it is not important where the experiment takes place. However, what is important are perceptuo-motor activities, learning by doing and interacting, observing and collecting data, and then interpreting them in tables or graphs. The experiments are generally conducted with students divided in small groups; they experience a phenomenon and model the relations between the quantities involved, using various kinds of devices. The analysis of students’ cognitive processes is made with post-Vygotskian perspectives, along with new theoretical elements such as embodiment, analysis of gestures and role of imagination. An important issue is that body, language and instruments mediate and support the transition of students from the perceptual facts to the symbolic representation, which is also supported by the production of metaphors during the activity (Arzarello et al. 2007).
The frameworks used by researchers in the past decades have provided a basis for investigation right up to the present day. Some of them aid in the analysis of gestures and other signs, in a cultural-semiotic perspective (e.g., Arzarello et al. 2009; Edwards 2009; Radford 2009), while others analyse the double process of instrumentation and instrumentalisation, following the instrumental approach introduced by Rabardel (e.g., Trouche and Hivon 2009).
The studies described above show that:
-
the use of technological devices, such as calculators, has been made in individuals or in small groups of students;
-
the use of discussion among students, coordinated by the teacher, has been considered essential to share results and solution processes;
-
sometimes portable devices are more useful than computers, since they are constantly accessible, not just during particular hours of the week;
-
the various environments given by the calculators are catalysts of the students’ attention, for many reasons;
-
the role of feedback is essential (it can reinforce an idea or help in understanding a mistake), since it gives reasons for the work done, without requiring the teacher’s intervention.
In the next section, some theoretical approaches are presented in an integrated way, to use their features for analysing the perspective of this study: first of all, the frame of humans-with-media and then the multimodality of production. They are described and used in the perspective of social interaction in a community of practice, where technology is considered part of it and all modes of communication are taken into consideration for a semiotic analysis of students’ production.
4 Integrating theoretical perspectives
Having a community of practice in a classroom, with students working together, is possible because of this kind of activity, teacher’s support and methodology. Mathematics education research gives examples in this sense, particularly oriented towards the so-called learning community, namely groups of students (or teachers), oriented on a common task in which they are engaged and have the possibility of learning (Jaworski et al. 2007). In fact, communities of practice are formed by people who engage in a process of collective learning in a shared domain of human endeavour: they share a concern or a passion for something they do and learn how to do it better as they interact regularly. So, a community of practice is not merely a club of friends or a network of connections among people, rather it has an identity defined by a shared domain of interest. In pursuing their interest in their domain, members engage in joint activities and discussions, help each other and share information. They build relationships that enable them to learn from each other. A Web site in itself is not a community of practice, because it does not imply interactions. In fact, members of a community of practice are practitioners, who interact developing a shared repertoire of resources: experiences, stories, tools and ways of addressing recurring problems (Wenger 1998).
Calculators combined with software Navigator are a support to create a community of practice in the classroom. Some research groups have experienced the use of this software, producing findings that emphasise the role of the teacher in orchestrating more instruments in the class (Hivon et al. 2008), recognising a strong involvement of the teacher in governing complexity and a sure advantage for students in collaborative work, supported by the software and by the methodology of discussion (Robutti et al. 2009). In particular, the role of the public screen is recognised as a catalyst of attention by students and teachers, not only as a traditional blackboard (that is seen as a “inert intermediary between the speaker and his/her advisory”, according to Legrand (1993)), but actually as a dynamic, and not inert, space of mutually exchanging information flow in the class.
I will introduce two approaches to describe the interaction in classroom: humans-with-media and multimodality of production. Humans-with-media is a theoretical approach that takes both the subjects and the tools involved in a mathematical activity into account (Borba and Villarreal 2005). It is based on two ideas: first, the construction of knowledge is made in a social way by subjects working together; second, the media involved are part of this construction, because they collaborate to reorganise thinking, with a different role than the one assumed by written or oral language. This point of view focuses on the community of learners (small groups, as well as the whole class or bigger groups), along with the tools and overcomes the traditional dichotomy between humans and technology. It suggests that learning is a process of interaction among humans as a group, including tools, which are seen as “actors” in collective thinking, in the sense that they are carriers of a historical-cultural heritage and mediate the construction of knowledge. Therefore, media interact with humans, in the double sense that technologies transform and modify humans’ reasoning, as well as that humans continuously transform technologies according to their purposes.
Studies in neuroscience tell us that the sensory-motor system of the brain is multimodal rather than modular (Gallese and Lakoff 2005): “an action like grasping… (1) is neurally enacted using neural substrates used for both action and perception, and (2) the modalities of action and perception are integrated at the level of the sensory-motor system itself and not via higher association areas.” (Gallese and Lakoff, p. 459). “Accordingly, language is inherently multimodal in this sense, that is, it uses many modalities linked together—sight, hearing, touch, motor actions, and so on. Language exploits the pre-existing multimodal character of the sensory-motor system.” (Gallese and Lakoff, p. 456). If the sensory-motor system of human brain is multimodal, also human activity is multimodal, and we can analyse all the modalities to understand cognitive processes (Arzarello and Edwards 2005). During the mathematical activities with media, students produce a variety of signs as words, gestures and actions on the tools, interactions and written or oral signs of whatever nature.
These two approaches are the basis for my analysis of the process of knowledge construction through a semiotic-cultural frame, as developed in my research group (Arzarello et al. 2009). The experience of learning together (learning to be with others in mathematics, as written by Radford (2006)) with the use of a technological tool can be described by a frame, which takes the multimodal production of the students into account, as well as the teacher and the technology itself. In this approach, learning mathematics is a matter of being in mathematics (Radford 2006), living in a classroom as a community (Jaworski et al. 2007), working together and sharing activities and results.
In this study, I analyse the cognitive activity of the students, describing the signs involved: gestures, words, gazes, actions on the paper, in the air, on the artefacts, interactions with the teacher, and whatever sign they use in their activity (Arzarello et al. 2009). In doing this, I make use of the semiotic bundle as a model, which takes the multimodality of production of signs by the students or the teacher during an activity into account (Arzarello 2006). The semiotic bundle of a group of subjects must not be considered as a juxtaposition of signs, but a systemic structure to describe the activity of the group, in terms of the signs used and their relationships. This structure is dynamic and shows the evolution of subjects’ activity over time, showing the variety of signs involved, their relationships and their transformation. The relationships concern signs produced at different times: for example, a sign made by a subject can influence the sign made by another subject, a sign is transformed into another sign (think of a gesture converted into a written sign on the paper) by the same subject, or two signs are made simultaneously by the same subject or by two different subjects. This description passes through dynamic elements of evolution in time of the signs used (description as a movie), along with the complex interaction at certain instants (description as a picture), giving reason for the multimodal aspects of the learning processes (Arzarello 2006). Some of these signs are particularly significant, because they introduce new elements (previously not present) for the construction of meaning: in this sense, they are considered as semiotic means of objectification (Radford 2006).
With signs, we also include those from technology, considering not only the community of students and teacher, but also the media (Borba and Villarreal 2005). Using the semiotic bundle, we can describe the multimodality at an instant of the activity (in a static way, as a picture), or the evolution over time of signs and their mutual relationships (in a dynamic way, as a movie). Within this framework, it is interesting to describe when and how the students, during a group activity, make something visible, which was not visible before, namely, how they introduce a new piece of meaning in the construction of knowledge.
We know that students’ processes evolve both individually and collectively, but we are particularly interested in those that evolve collectively. With this in mind, some research questions of this study are as follows:
-
What are the social ways to produce knowledge in this teaching experiment?
-
What are the features of technology, which influence and support the collective production of knowledge?
-
What are the teacher’s uses of technology to support collective production?
-
Is there an “added value” to the teaching/learning processes, due to the new technological devices (connectivity software and calculators), with respect to traditional technological equipment (only calculators)?
-
How do the rhythms change with respect to a more traditional activity?
Considering that the software is not a mere technological novelty, but rather also a cognitive novelty, in the sense that it has a deep impact on the students’ cognitive productions, I will analyse the elements of this novelty. In fact, these elements can influence not only research into mathematics education, but also teaching methods and learning ways. Therefore, it may be possible to discover new and different features in the use of calculators combined with connectivity software: they deal with communication, sharing, working together, sign production, practices in a community and rhythms of working.
5 Activities and discussion
The activity presented here is one of the first of the teaching experiment, after an introduction of the software and some exercises with the environments of the calculator. The students have to find the various terms of this sequence as coordinates of points and to send them to the public screen, where they are represented altogether (Fig. 3).

The activity center
Consider the point P 0 (0, −1). Find the coordinates of P 1, by adding 1 to the abscissa of P 0, 2 to its ordinate. Represent the point on the Cartesian plane. Find P 2, adding 1 to the abscissa of P 1, 2 to its ordinate and represent P 2. Now find P 3, P 4 and so on. Write the sequence of the points P 0,…, P 6. How do you pass from one point to the subsequent? What are the coordinates of P 10? Explain how to determine P 100 and what the rule is.
The aim of the activity is the model (linear) of the situation, expressed not only in a recursive form (x n = x n−1 + 1, y n = y n−1 + 2; with x 0 = 0, y 0 = −1), where each element of the sequence is written as function of the previous element, but also with a formula (x n = n, y n = 2n − 1), where each element of the sequence is determined as function of its position in the sequence. Both the symbolic expressions, as well as the meaning of the relation among the abscissas and ordinates of the points in the sequence, are important.
The students, divided into small groups (of two or three), carry out the activity with one graphic calculator connected to the public screen and one sheet of paper to be filled in. At the end of the group work, a discussion takes place. First, the discussion has the aim of writing the formula (this is the last question on the sheet of paper), then of describing the model from a graphical point of view. In the group session, nothing particularly new in the construction of learning is introduced with respect to other experiences described in #3. During the class discussion, students and teacher refer to the Activity Center (Fig. 3, projected on a big screen) to which each group had previously sent the results (coordinates of the points of the sequence).
The Activity Center is the catalyst of gazes, gestures and words of the students during the discussion, and it supports the teacher in the mediation of meaning construction. The teacher starts the discussion with attention to the objects on the Cartesian plane (Fig. 3). In the following, Th means teacher, St a group of students answering together, and other names denote particular students.
-
1.
Th: What do you observe in the points you found?
-
2.
Ca:They are a straight line (Fig.3).
-
3.
Th: Yes, they are a straight line. Except that one, which seems to be out of its place. Why is it out of place?
-
4.
Ma: We calculated incorrectly.
-
5.
Th: You calculated incorrectly. Which coordinates does that point have? The one which seems out of place?
-
6.
Ma: (6,13).
-
7.
Th: Why doesn’t it work?
-
8.
Ma:Because I added… I had to put (6,14), then it resulted to be more in this direction. [with a gesture he shows the direction, which is wrong (Fig. 4)].
Fig. 4 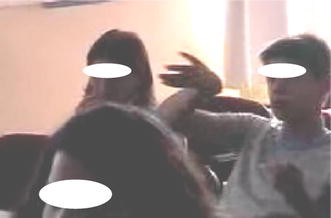
Gesture in the discussion
-
9.
Th: (6,14) do you agree? Also you put (6,14)?

The teacher went back to the first point of the sequence, to understand the process Ma and his classmate followed to obtain a wrong value (6,13). Along with the class, the teacher came to the point: Ma and Ba always added 2 to the abscissa and 1 to the ordinate, but exchanged x and y, obtaining a wrong table of numbers, with a pattern in itself that made sense even if not correct (Fig. 5).

Ma’s wrong table
Let me now attempt to analyse the elements of the semiotic bundle, which are important in correcting the answer given by the student. When examining the group work, there are two more variables during the discussion: the teacher involved in the discussion and the public screen (Activity Center). For this reason, the multimodality involves also the teacher’s production, and the community of humans-with-media include all the students, the teacher and the technologies (calculators and software) used.
The public screen offers the environment to share previous experience, where every group worked with the calculator without knowing what the other groups were doing. Therefore, the discussion is a process of sharing results and justifying them with a rule, a pattern the students choose to send such points. The teacher has the role of a mediator in this discussion and supports the students’ evolution in sharing and justifying. In this way, the description of the semiotic bundle takes into account this evolution and looks at the signs that mark its various steps.
At the beginning of the discussion, the teacher’s question (#1) seeks attention to the public screen, where the graph shows the points of the sequence sent by the groups. The students answer looking at these signs (the points) and introduce a new sign, the word: “a straight line” that represents a pattern through the points, which marks the first step in the construction of knowledge. Another sign is remarked by the teacher, who says that one of the points seems to be “out of place” (#3). The group responsible for this point says that it is not correct (#4), because they calculated it wrongly. The graphical representation on the public screen actually gives feedback that can be used by the teacher not to remark upon the mistake, but to ask why it was out of the pattern (#3, 5 and 7).
Another sign marks the second step: Ma’s gesture that correctly identifies the direction of the point to be moved, in order to have it in the right place (Fig. 4). Because of the public screen that represents all the points given by the groups, the student is aware of his mistake and makes this gesture to correct the mistake. In fact, he compares the different positions of his points with respect to the points of other groups. Then, he makes a gesture in the correct direction (the correct point should be aligned with the others), but wrong in coordinates. The student was influenced, in fact, by the process followed during the group activity. This is the reason of the new mistake. Here, the signs introduced by the teacher were strategic: to understand why the point was wrong.
The third step begins with a question directed to the class as a whole: “do you agree?” (#9). This question, along with the repetition of the wrong coordinates (6,14), and the word “why” later, are the signs introduced by the teacher into the semiotic bundle that marks the beginning of a new reasoning. In a process of going back, till arriving at the first point of the sequence, the teacher supports the students in comparing the correct with the wrong coordinates and discovering the pattern followed by Ma and Ba. This comparison is not only useful to this pair of students, but also to the others, who can also be aware of the processes.
In the semiotic bundle, the first signs are the straight line and the point “out of place” in the graph on the public screen. This one is transformed into Ma’s gesture (Fig. 4), to “put the point into place” aligned with the others, and this gesture is then replaced by the coordinates (6,14) of the new point (#8). These coordinates claim an explanation rich in signs (words, numbers, Ma’s table (Fig. 5), which lead the class to understand why Ma sent them and why they were wrong. So the semiotic bundle is made of gestures, words and mathematical signs that are written, spoken and represented on the screen. These signs are related to each other, because one is substituted by another or is transformed into another. The role of the public screen is strategic, to make the contributions of all the groups visible, with the possibility of discussing them immediately. The signs coming from the public screen are part of the semiotic bundle, as well as those introduced by the teacher. Therefore, its presence is not neutral, and it gives the students the possibility of sharing results, having immediate feedback and introducing new signs (the straight line or the point not aligned). The differences between the group results offer the teacher the occasion to discuss why there are such differences and to analyse the students’ processes in obtaining them. With the calculators alone, without the connectivity software, this sharing would have been more difficult to obtain due to reasons of time and space.
The discussion continues with two aims: first, to have a symbolic way of writing the pattern of points; and second, to find a general way of representing a straight line, linking its graphical and symbolic features. Students are able to say this expression: “you always add 1 to x and 2 to y”, calculate some specific points and write the rules in symbols. After those results, the teacher guides the discussion towards a formula that gives the coordinates of whatever point, knowing its place in the sequence. She introduces the sign tot (a generic point P tot), to give generality to the reasoning, then she asks for the coordinates of a particular point P 15. The strategies followed by the students are twofold: to add to the abscissa of the point, the abscissa minus one, or to double the abscissa and then subtract 1. The final strategy used by most of students is: “The double minus 1”. The passage from natural language to symbolic expression (Fig. 6) is shared, and the formula applied to various sets of points.

The formula written by a group
The discussion continues, focusing the students’ attention onto the public screen, where the representation of the points is projected. The aim is now to transfer the construction of meaning on the graph itself, in relation to the formula discovered previously (Fig. 7). The discussion begins with some considerations about the number of conditions to give, in order to identify a unique straight line. The students themselves say that they need two points or one point and a rule, as seen below.

The activity center with the sequence of points
-
118.
Th: To identify this straight line, we gave you some information…
-
119.
Lo: How x and y increase…
-
120.
Th: How they increase. So, you see, to identify a unique line we can give you two points, and through two points there exists only one straight line, or we can say: “I give you one point and how x and y increase”. So, how do x and y increase?
-
121.
Ma:How the line is traced [with his hand he traces the line in the air (Fig. 8)].
Fig. 8 
Ma’s gestures for the straight line
-
122.
Th: Right. This gesture you made is important, why?
-
123.
Lu: How the straight line continues.
-
124.
Th: Another similar gesture by him. How the straight line continues.
-
125.
Th:You made this gesture [increasing line], not that one [decreasing line]. Why?
-
126.
Ma:Because, being positive, it is oriented in this way [he repeats the previous gesture to show the direction of the line].
-
127.
Th: Right. And how can I understand that it is positive?
-
128.
Ma: From the numbers.
-
129.
Th: From the positive numbers or from the kind of calculation I do?
-
130.
St: Because I always add positive numbers…
-
131.
Th: Add, it is the right word. While I add to x, I add to y. Otherwise, if I add to x and subtract to y…
-
132.
Ma:It is like this [he shows the new direction, decreasing, with a gesture].
-
133.
Th: Why?
-
134.
Ma:Because the x is going here [he shows with the hand the right direction] and the y is going there [he shows the bottom direction with his hand] and so it becomes this one [he traces the line in the air]. The x increasing goes to the right, while the y decreasing goes to the bottom.

The straight line (not present on the public screen) is the pattern students recognise in the points represented on the public screen (Fig. 7). Teacher’s question determines Lo’s words: “How do x and y increase” (#119) are the first signs of the semiotic bundle, starting a chain of other signs. This sign is re-used by the teacher, with a question: “How do they increase?” Ma introduces the second sign: an iconic gesture for a line, also repeated later, to show “how” (Fig. 8). This gesture is then substituted with a word: “positive”, which should explain “how”. But it needs more explanation, and so the teacher asks for the meaning of “positive”. Some students introduce other words about “positive”: “Because I always add positive numbers”. These words are captured by the teacher, who outlines them and remarks them in the semiotic bundle, to distinguish between an increasing and a decreasing straight line. Again, Ma introduces a gesture in the semiotic bundle, corresponding to a decreasing straight line (#132). Linking the increment of x and y, Ma gives the starting point for a new discussion, centred on the meaning of slope of a straight line to recognise the “rule” followed by all the points on the line. His gestures correspond perfectly with the meaning of increment, respectively, positive or negative, and make it possible to distinguish between a positive or negative slope for a straight line.
6 Conclusions and open problems
I believe that this paper can show how new technology not yet analysed at ICMEs can make different contributions than those previously presented.
The protocols analysed above give evidence for a new tool that has a profound effect on the interactions in the mathematics class. We can describe some new elements in comparison with a laboratory, which includes calculators only.
-
(a)
The students work in this mathematics laboratory with two resources: the “private” screen of the calculator in the groups and the big public screen; in a laboratory, with calculators or computers only, they have at their disposal only the private screen.
-
(b)
Both of these resources, private and public, give signs for the semiotic bundle, but the second does it in a social way. So, one of the social ways to produce knowledge is through the public screen (to answer the first research question). This is a new development, compared with those which only have calculators in the class, where signs are produced in small groups or individuals in front of their private screens and then eventually shared in a class discussion.
-
(c)
The class discussion can be intrinsically intertwined with the group work, because at any moment the public screen gives information on what students do on their private screens.
-
(d)
The teacher introduces signs, referring not only to what groups are doing on their private screens, but also to what appears in the public screen, giving comments, posing questions, supporting the discussion and the construction of meanings, with particular attention to the students’ processes.
-
(e)
The use of the public screen is a new tool in the classroom, because it shows the work done by all the groups in real time and gives feedback by itself, with the possibility of making comparisons and connections among works of different students or groups.
-
(f)
The way to interact in the class is in a “blended” manner, not in the sense of merging activities face to face with activities at distance, but in the sense of a blended collaboration among students, namely at the level of small groups (mediated by calculators) and at the level of the whole class (mediated by calculators and connectivity software). This interaction adds new opportunities for students to learn by comparing, sharing, discussing and arguing, if appropriately guided by the teacher. So, by including the connectivity software and the graphic calculators in the community of subjects interacting in the classroom (Borba and Villarreal 2005), and adding the signs coming from the technology to the multimodal production of the students (Arzarello et al. 2009), the semiotic bundle becomes very rich. We observe this fact in the last protocols when gazes, gestures and words often are influenced by the public screen. This is mainly due to the fact that the public screen contains the work done by all the groups and so the students can compare results and share the production of the groups. The straight line, introduced as model of the points, is the main sign that determines various other signs: the point not aligned, the gesture to align it (Fig. 4), the idea of direction, slope, gestures and words related to them, and the recursive law and its symbolic representation. This is possible, due to the immediate sharing of results on the public screen.
-
(g)
This multimodal production of signs is not only more efficient than the use of calculators alone in sharing results in the learning community, but also the rhythms of work are faster. This velocity in exchanging signs is due to the presence of the public screen that decreases the time usually necessary to describe the solution of a group to the audience. These elements are present and evident to everybody on the public screen; therefore, the public screen is a space where everybody can contribute simultaneously to the activity. This space gives cognitive support in the construction of meanings in new ways. For these reasons, this kind of technology introduces new supports to a learning community.
As these results show, an improvement from the simple use of calculators in learning and teaching to use also for research is possible. Every student receives a feedback, which reinforces an idea or evidences a mistake; every group shares its production with the others. The class community has a public screen, which is the catalyst of attention; the teacher refers to the work done by every group in real time on the public screen.
There are several further possibilities for interesting new research into the kinds of software, which introduce new ways of learning mathematics in the classroom and support new didactical methodology. For example, the role of the teacher is not subordinated to the use of technology. In fact, if she has more time and energy for the students (because the public screen let the students share results and speeds up feedback), she also has to dedicate time for managing the technology and simultaneously guiding a discussion. Therefore, new questions should be investigated in the future, such as: what are the changes in the teaching processes with this technology? How can we support teachers in introducing these media in the classroom, along with more traditional tools? How should we change the tasks with the use of these tools? And what are its implications on the curricula? Are we beginning new trends in mathematics education, in studying the mediation of these new media?
Although it is not possible to read this study from an instrumental perspective, it would be interesting to develop this study in the frame of orchestration of instruments (Trouche 2004). This frame describes the setting of the classroom with the positions of devices, students, teachers and screen of projection. It is then possible to analyse how different ways of orchestration (Drijvers et al. 2009) can influence instrumental genesis.
References
Arcavi, A. (1994). Symbol sense: Informal sense-making in formal mathematics. For the Learning of Mathematics: An International Journal of Mathematics Education, 14(3), 24–35.
Arzarello, F. (2006). Semiosis as a multimodal process. RELIME, Revista Latinoamericana de Investigación en Matemática Educativa, Numero Especial (pp. 267–299). Editores Comité Latinoamericano de Matemática Educativa.
Arzarello, F., & Edwards, L. (2005). Gesture and the construction of mathematical meaning. In H. L. Chick & J. L. Vincent (Eds.), Proceedings of the 29th conference of the international group for the psychology of mathematics education (Vol. 1, pp. 123–154). Melbourne: PME.
Arzarello, F., Pezzi, G., & Robutti, O. (2007). Modelling body motion: An approach to functions using measuring instruments. In W. Blum, P. L. Falbraith, H.-W. Henn, & M. Niss (Eds.), Modelling and applications in mathematics education, the 14th ICMI studies (Vol. 10, 3.3.1, pp. 129–136). USA: Springer.
Arzarello, F., Robutti, O., Sabena, C., & Paola, D. (2009). Gestures as semiotic resources in the mathematics classroom. Handbook: Educational Studies in Mathematics, 70(2), 97–109.
Bartolini Bussi, M. G. (1996). Mathematical discussion and perspective drawing in primary school. Educational Studies in Mathematics, 31(1–2), 11–41.
Bartolini Bussi, M. G., & Mariotti, M. A. (2008). Semiotic mediation in the mathematics classroom: Artefacts and signs after a Vygotskian perspective. In L. English et al. (Eds.), Handbook of international research in mathematics education (2nd ed., pp. 746–783). Mahwah, NJ: Lawrence Erlbaum Associates.
Bielaczyc, K., & Collins, A. (1999). Learning communities in classrooms: A reconceptualization of educational practice. In C. M. Reigeluth (Ed.), Instructional-design theories and models. A new paradigm of instructional theory (pp. 269–292). Mahwah: Lawrence Erlbaum Associates.
Borba, M. C. (1997). Graphing calculators, functions and reorganization of the classroom. In M. C. Borba, T. A. Souza, B. Hudson, & J. Fey (Eds.), Proceedings of working group 16 at ICME8, Seville, Spain, 1996 (pp. 53–60). Sao Paulo, Brasil: UNESP.
Borba, M. C. (2005). The transformation of mathematics in on-line courses. In H. L. Chick & J. L. Vincent (Eds.), Proceedings of the 29th conference of the international group for the psychology of mathematics education (Vol. 2, pp. 169–176). Melbourne: PME.
Borba, M. C., & Villarreal, M. E. (2005). Humans-with-media and the reorganization of mathematical thinking: Information and communication technologies, modeling, visualization and experimentation. USA: Springer.
Borba, M. C., & Zulatto, R. B. A. (2006). Different media, different types of collective work in online continuing teacher education: Would you pass the pen, please? In J. Novotná, H. Moraová, M. Krátká, & N. Stehlíková (Eds.), Proceedings of the 30th conference of the international group for the psychology of mathematics education (Vol. 2, pp. 201–208). Prague: Charles University, Faculty of Education.
Chapman, O., & Robutti, O. (2008). Current problems and challenges in upper secondary mathematics education. In M. Niss (Ed.) Proceedings of ICME10, Copenhagen, 4–11 July 2004 (pp. 514–518). Denmark: IMFUFA, Department of Science, Systems and Models, Roskilde University.
Dougherty, B. J., & Hobbs, M. (2007). The effects of the TI-Navigator system on student achievement and attitude in algebra. In Proceedings of the 8th international conference on technology in mathematics teaching, 1–4 July 2007. Hradec Králové.
Drijvers, P., Doorman, M., Gisbergen, S., & Reed, H. (2009). Teachers using technology: Orchestrations and profiles. In Proceedings of the PME33 conference, Tessaloniki, Gereece, July 2009 (in press).
Edwards, L. (2009). Gestures and conceptual integration in mathematical talk. Handbook: Educational Studies in Mathematics, 70(2), 127–141.
Ferrara, F., Pratt, D., & Robutti, O. (2005). The role and uses of technologies for the teaching of algebra and calculus. In A. Gutiérrez & P. Boero (Eds.), Handbook on research on the psychology of mathematics education. past, present and future (pp. 237–273). Rotterdam/Taipei: Sense Publishers.
Gallese, V., & Lakoff, G. (2005). The brain’s concepts: The role of the sensory-motor system in conceptual knowledge. Cognitive Neuropsychology, 21, 1–25.
Hivon, L., Pean, M., & Trouche, L. (2008). From a network of calculators to collaborative knowledge construction in the class, Repères IREM no. 72, http://educmath.inrp.fr/Educmath/lectures/dossier_mutualisation/crome-english.pdf. Accessed 17 June 2009.
Hudson, B. (1997). Group work with multimedia: An example of classroom use and some suggestions for future development. In M. C. Borba, T. A. Souza, B. Hudson, & J. Fey (Eds.), Proceedings of working group 16 at ICME8, Seville, Spain, 1996 (pp. 105–112). Sao Paulo, Brasil: UNESP.
Jaworski, B., Fuglestad, A. B., Bjuland, R., Breiteig, T., Goodchild, S., & Grevholm, B. (2007). Learning communities in mathematics. Bergen, Norway: Caspar Forlag As.
Jonassen, D. H. (2007). Engaging and supporting problem-solving in online learning. In R. Luppicini (Ed.), Online learning communities (pp. 109–127). Charlotte, NC: Information Age Publishing.
Kaput, J. J., & Roschelle, J. (1998). The mathematics of change and variation from a millennial perspective: New content, new context. In C. Hoyles, C. Morgan, & G. Wodhouse (Eds.), Rethinking the mathematics curriculum (pp. 155–170). New York: Routledge.
Laborde, C., Hollebrands, K., Kynigos, C., & Strässer, R. (2006). Teaching and learning geometry with technology. In A. Gutiérrez & P. Boero (Eds.), Handbook on research on the psychology of mathematics education. past, present and future (pp. 275–304). Rotterdam/Taipei: Sense Publishers.
Lagrange, J.-B. (1997). Using a computer algebra system in the mathematics classroom: In a computer room or with hand held calculators? In M. C. Borba, T. A. Souza, B. Hudson, & J. Fey (Eds.), Proceedings of working group 16 at ICME8, Seville, Spain, 1996 (pp. 113–118). Sao Paulo, Brasil: UNESP.
Legrand, M. (1993). Débat scientifique en cours de matheématique et spécificité de l’analyse. Repères-IREM, 10, 123–158.
Leung, F. K. S. (2008). P: Information and communication technology in mathematics education. In M. Niss (Ed.) Proceedings of ICME10, Copenhagen, July 4–11 2004 (pp. 228–243). Denmark: IMFUFA, Department of Science, Systems and Models, Roskilde University.
Noss, R., Healy, L., & Hoyles, C. (1997). The construction of mathematical meanings: Connecting the visual with the symbolic. Educational Studies in Mathematics, 33(2), 203–233.
Radford, L. (2006). The anthropology of meaning. Educational Studies in Mathematics, 61, 39–65.
Radford, L. (2009). Why do gestures matter? Sensuous cognition and the palpability of mathematical meanings. Handbook: Educational Studies in Mathematics, 70(2), 111–126.
Robutti, O. (2006) Motion, technology, gesture in interpreting graphs. Digital technologies in mathematics education: selected papers from ICTMT. International Journal for Technology in Mathematics Education 13(3):117–126
Robutti, O. (2007). Interactions in classroom with technologies: Signs and meanings, La matematica e la sua didattica. Anno, 20(1), 39–50.
Robutti, O. (2009). Space–time representations in young children: Thinking through gestures in motion experiments. In C. Andersen, N. Scheuer, M. del Puy, & L. Pérez Echeverría, E. Teubal (Eds.), Representational systems and practices as learning tools in different fields of knowledge (pp. 59–75). Rotterdam/Taipei: Sense Publishers.
Robutti, O., Ravera, M. T., Ghirardi, S., & Manassero, M. (2009). What students want: An environment where learning to be in mathematics. In Proceedings of CIEAEM 59, Dobogoko, Hungary, 23–29 July 2007.
Sowder, J. T. (1992). Estimation and number sense. In D. A. Grouws (Ed.), Handbook of research on mathematics teaching and learning (pp. 371–389). New York: Macmillan.
Sutherland, R. (1993). Consciousness of the Unknown. For the Learning of Mathematics, 13(1), 44–46.
Tall, D. (1989). Concept Images, Generic Organizers, Computers and Curriculum Change. For the Learning of Mathematics, 9(3), 37–42.
Teasley, S. D., & Roschelle, J. (1993). Constructing a joint problem space: The computer as a tool for sharing knowledge. In S. P. Lajoie & S. J. Derry (Eds.), Computers as cognitive tools. Mahwah, NJ: Lawrence Erlbaum Associates.
Trouche, L. (2004). Managing complexity of human/machine interactions in computerized learning environments: Guiding students’ command process through instrumental orchestrations. International Journal of Computers for Mathematical learning, 9, 281–307.
Trouche, L., & Hivon, L. (2009). Connectivity: New challenges for the ideas of webbing and orchestrations. In J.-B. Kagrange & C. Hoyles (Eds.), ICMI conference mathematical education and digital technologies: Rethinking the terrain, Hanoi (in press).
Wenger, E. (1998). Communities of practice: Learning, meaning, and identity. Cambridge: Cambridge University Press.
Acknowledgments
This study was conducted within the project PRIN 2007B2M4EK (Instruments and representations in the teaching and learning of mathematics: theory and practice) and jointly funded by MIUR and Università di Torino.
Author information
Authors and Affiliations
Corresponding author
Rights and permissions
About this article
Cite this article
Robutti, O. Graphic calculators and connectivity software to be a community of mathematics practitioners. ZDM Mathematics Education 42, 77–89 (2010). https://doi.org/10.1007/s11858-009-0222-4
Accepted:
Published:
Issue Date:
DOI: https://doi.org/10.1007/s11858-009-0222-4