
Abstract
Stock market plays a key role in economical and social organization of a country. Stock market forecasting is highly demanding and most challenging task for investors, professional analyst and researchers in the financial market due to highly noisy, nonparametric, volatile, complex, non-linear, dynamic and chaotic nature of stock price time series. Prediction of stock market is a crucial task and prominent research area in financial domain as investing in stock market involves higher risk. However with the development of computational intelligent methods it is possible to reduce most of the risk. In this survey paper, our focus is on application of computational intelligent approaches such as artificial neural network, fuzzy logic, genetic algorithms and other evolutionary techniques for stock market forecasting. This paper presents an up-to-date survey of existing literature on stock market forecasting based on computational intelligent methods. In this article, the selected papers are organized and discussed according to six main point of view: (1) the stock market analyzed and the related dataset, (2) the type of input variables investigated, (3) the pre-processing techniques used, (4) the feature selection techniques to choose effective variables, (5) the forecasting models to deal with the stock price forecasting problem and (6) performance metrics utilized to evaluate the models. The major contribution of this work is to provide the researcher and financial analyst a systematic approach for development of intelligent methodology to forecast stock market. This paper also presents the outlines of proposed work with the aim to enhance the performance of existing techniques.
1 Introduction
Stock market is an open market in which equity securities or shares of company are traded publically to raise money for research and development, introducing new products, entry into new markets, financial growth, acquiring competitors etc. A share is the part of ownership of company. Economics and social organization of a country are strongly linked and heavily affected by the performance of the stock market. Stock market play a crucial role in world economy as economic development of many countries is influenced by various financial activities [1]. The up side of stock market is that it gives higher profits than other financial market and down side of stock investment is that it involves higher risk but smart decision can reduce most of the risk. So prediction of stock market is an emerging task before investing into it. Stock price time series forecasting is highly demanding and most challenging tasks for the investors and professional analyst in the time series and computational intelligence literature [2]. Successful and accurate prediction of stock market would yield significant profit for investors.
There are numbers of approaches that are utilized for forecasting of stock market. These approaches have been categorized into four classes (1) fundamental analysis, (2) technical analysis, (3) traditional statistical methods, (4) soft computing methods. Fundamental analysis and Technical analysis are two most commonly used approaches for analyzing and forecasting stock market behavior [3]. In the former approach the investors focus on various metrics that reflect the health of the company before purchasing its stock. Fundamental analyst study various metrics like turnover, expenses, annual and quarterly reports, profit and loss, income statements, assets and liabilities, balance-sheet etc. The fundamental analysis is mostly favored by long-term investors. Technical analysis is based on the study of statistics generated by market itself. The technical analyst believes that stock price already comprises all the fundamentals that affect it and model the historical behavior of stock market as a time series. Analyzing the shape of financial time series allows the technical analyst to predict future behavior based on past behaviors of time series believing that history may repeat in future [4].
Stock market’s fluctuations are influenced by various macro-economical factors including economic condition of company or country, bank rate, currency exchange rate, commodity price, gold price, movement of other stock market, investors’ expectations, political events, companies’ policies, psychology of investors etc. [5,6,7]. In the past several years, many other different approaches have been suggested to forecast stock market and to provide intelligent decision making system. Two most commonly used approaches that are used to predict stock price time series are statistical methods and soft computing approaches [8]. Traditional statistical forecasting methods like, autoregressive moving average (ARMA), exponential smoothing (ES), autoregressive integrated moving average (ARIMA), autoregressive conditional heteroskedasticity (ARCH) and generalized autoregressive conditional heteroskedasticity (GARCH) predicts the future stock prices on the basis of past stock prices [9]. These models are based on the assumption that financial time series under investigation are generated from linear process [10] and attempt to model the time series process in order to forecast the future value of series. However stock time series data are highly noisy, non-linear, complex, dynamic, nonparametric, and chaotic in nature [11, 12]. Therefore, traditional statistical techniques cannot be used to model the complexity and non-stationary nature of stock markets. So, several soft computing techniques have been proposed and used for stock market trend forecasting. Artificial neural networks (ANNs) and support vector machines (SVMs) are the extensively used algorithms among these techniques [13, 14].
The aim of this work is to review the recent computational intelligence approaches applied to solve stock market forecasting problem. This study is useful for guiding research scholar, investors and financial analyst for building an intelligent stock market forecasting methodology.
2 Previous Related Work
We started the survey by reviewing the existing literature by different authors that provided the review of relevance of computational intelligence techniques in financial market problems.
Atsalakis and Valavanis [15] have surveyed scientific articles that make use of neural and neuro-fuzzy techniques to solve stock market forecasting problem. In that study, each article was discussed with respect to five key perspectives (1) the stock market surveyed, (2) the input variables investigated in each model, (3) techniques and parameters utilized to build the prediction model, (4)different model comparisons, and (5) the performance measures used to measure accuracy of each model. Although this article provides the valuable contribution in organizing the literature in stock market forecasting using soft computing techniques but it is limited to particular class of soft computing. In contrast, our study investigate several area of computational intelligence applied in stock market forecasting. Primary studies from 2009 to 2015 examined by Cavalcante et al. [16], which illustrate the use of computational intelligence techniques in financial market. In this article the selected primary studies has been classified into five main aspects (1) application of soft computing in financial market, (2) the financial market examined, (3) the input variables used, (4) the intelligent trading system proposed and (5) whether the work discussed helps in development of trading system. They investigated the major financial problems such as forecasting of stock price, commodity price, exchange rate, electricity prices, and financial distress prediction among others. The other main contribution of this work was presentation of basic concepts mainly fundamental and technical analysis, pre-processing techniques, traditional statistical and soft computing approaches used for solving financial problem, and challenges and future scope of the related research. Although this survey covers the wide area of computational intelligence and financial market but it is relatively old and many advances have been made since 2016. Hence, our work presents an up-to-date survey of recent article in computational intelligence and stock market forecasting domain. Also some primary studies that have applied text mining approaches to extract qualitative information about companies and use these mined knowledge to predict the future behavior of stock prices based on the quality of the companies’ news are presented by Nikfarjam et al. [17]. A comparative analysis of various text mining approaches proposed in this article also discussed according to some characteristics of the primary studies: (1) the feature selection methods, (2) the feature representation approach, (3) the news source utilized, (4) the classification techniques applied, (5) the number of categories or target classes and (6) the directional accuracy. Our study also includes various text mining approaches for forecasting stock market but we provide the latest discussion in contract to this literature survey. Li and Ma [18] have reviewed the application of artificial neural networks in different financial markets. They examined some primary research work that implement ANN to forecast the future value of exchange rates, stock market, and forecasting of banking and financial crisis. In that short article, authors have provided no details of which ANN architectures or learning algorithms were used in the surveyed literature and have limited scope as they investigated only one class of class of computational intelligence. In contract, our survey has broader scope. Rivera et al. [19] presented the survey of application of evolutionary computation approaches to solve various financial problems. The evolutionary techniques based on Darwinian approach such as Genetic Programming (GP), Learning Classifier Systems (LCSs), Genetic Algorithm (GA), Multi-Objective Evolutionary algorithms (MOEAs), Co-evolutionary optimization scheme and competent evolutionary algorithm have been considered in this article. This review is more restricted to Darwinian approaches, since it has presented few evolutionary methods. Our study has a broader scope as we have discussed most of the nature inspired optimization techniques used in literature. Agrawal et al. [20] surveyed the existing techniques for forecasting of Indian stock market and discussed the related parameters, various advantages and limitations of these methods. In this article, authors have provided the brief introduction of fundamental and technical analysis used for stock market forecasting. Kumar and Ravi [21] reviewed research articles from 2000 to 2016 which deals with application of text mining in financial domain and highlight some of the issues, research gaps, key challenges in financial domain and future direction in related field. Soni [22] also reviewed the use of ANNs in stock market prediction. In this article author has provided the brief introduction of ANN and discussed the importance of ANN in prediction. Before presenting the survey of previous studies that use ANNs to solve the stock market prediction problem, author has presented some basic concepts of stock market.
3 Basics Terminology of Stock Market and Computational Intelligence (CI)
This section presents the basic terminologies of stock market like what is stock market, Stock exchange, stock index, stock market forecasting and computational intelligence approaches that will act as foundation for the remainder of this article.
-
1.
Stock Market Stock market also called as equity market or share market is a publicly owned market for selling and buying the shares of company that issues them at an agreed price [22]. Selling and buying of shares is known as trading. A share is a portion of ownership of company and a stock is collection of shares. By owning a share means that one can share the part of company’s profit and loss. A stock is a type of security which is a financial instrument that has some monetary value and can be purchased or traded [23]. Securities may be private or public. If only selected individual can invest in stock it is known as private securities and if anyone can invest in them it is known as public securities. Individuals who invest in stock market must follow the rules and regulations of regulatory body that govern investors and investment. In India the rules for publicly traded securities are set and enforced by the Securities and Exchange Board of India (SEBI). It is the duty of the SEBI to ensure that investors are dealt fairly and that all investments have done honestly and inside the market there is no illegal dealing. Prices of share depend on supply and demand. If a stock have high demand, its price will increase, whereas stock that have low demand or heavily sold results in decrease in price. Companies that are allowed to trade in stock market are called listed companies [24].
-
2.
Stock Exchange A stock exchange is a place where shares of firm are traded. Stock exchange provides a marketplace which can be a corporation or mutual organization where stocks or other securities are traded by members of organization [22]. Shares are directly supplied by company through Initial Public Offer (IPO) or can be bought from stock exchange. Most of the world’s largest economic powers have their own stock exchanges. The New York Stock Exchange (NYSE) and NASDAQ are the two world’s largest stock exchanges. In India, there are 21 stock exchanges. Bombay Stock Exchange (BSE) and National Stock Exchange (NSE) are the two largest Indian stock exchanges. To trade the shares of company on certain stock exchanges, it has to be listed on particular stock exchange [24].
-
3.
Stock Index An index is a statistical measure of performance of group of companies. An index Company choose a limited number of stocks of company that represent the performance of entire market, or particular sector within the market and average their performance to find a number that investors can use to analyze the performance of the market, or compare it with other stocks [23]. Dow Jones Industrial Average (DJIA), the Standard & Poor’s 500 (S&P 500) and the NASDAQ Composite are the three major stock indexes of US. Just like individual company stock, each stock index has its own chart which shows the opening price, closing price, low price, high price, average volume and number of shares traded. S&P BSE Sensex and Nifty 50 are two major stock indices of BSE and NSE respectively of Indian stock market. Instead of stock market index, another popular index given by Chicago Board Options Exchange (CBOE) known as Cboe market volatility index (VIX index) is an indicator of market’s expectations of future volatility in US equity market [25]. It is based on options of S&P 500 index and is considered as measure of global US stock market [25]. Volatility is a measure of frequency and magnitude of price movement both up-side and down-side, of financial instrument over given interval of time. The VIX index is recognized as investors fear gauze as low VIX readings indicates that investors are confident about future market rather than fearful and high VIX values implies that investors recognized higher risk and perceive that market would fluctuate frequently in either directions [26]. National stock exchange of India (NSE) offers its own volatility index based on Nifty index option pricing namely India VIX (INDIAVIX or Nifty VIX) which gauze the expected market volatility of Nifty 50 over next 30-days. Figure 1 shows the co-movement of Nifty 50 index and India VIX for period of one financial year from 2 April, 2018 to 29 March, 2019.
Fig. 1 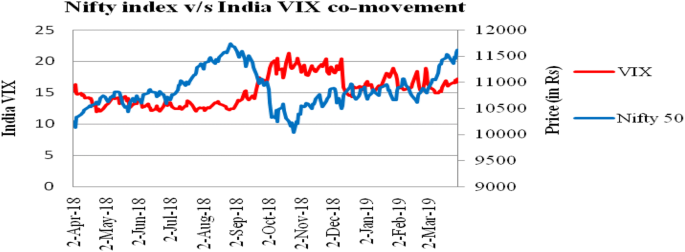
Nifty 50 and India volatility index co-movement chart
-
4.
Kinds of stock There are numerous ways to classify stocks into different classes but usually stocks are classified by sector, and by market cap. In sector investing, investors buy stock in one industry, known as sector. For example some might invest in healthcare companies or IT sector, automobile sector, telecom sector and many others. In market cap investing stocks are classified according to company size by using formula called market capitalization (market cap) which is given by multiplying Current price of a single share and number of shares available on the market. Companies are classified according to their market cap by using different figures but the rule of thumb is: $50 million or less: nano cap, $50 million to $300 million: micro cap, $300 million to $2 billion: small cap, $2 billion to $10 billion: mid cap, $10 billion or more: large cap (also known as blue chip) [23]. Figures 2 and 3 depicts the 9 year performance comparison of three sectors of NSE and two sectors of BSE of Indian stock market. Sector indices capture the performance of companies that are listed in particular index. The Nifty IT index gauzes the performance of Indian IT companies such as TCS Ltd., Wipro Ltd., Infosys Ltd. etc. and S&P BSE oil and Gas index is designed to measure the performance of oil and gas companies of India such as ONGC, GAIL, Petronet LNG etc. Total return is the amount of profit in percentage, earns by investors from a security over certain period of time and it is a strong measure for analyzing the historical performance of companies [27]. Average daily return is the average amount an investor earns daily over specific period of time [28].
Fig. 2 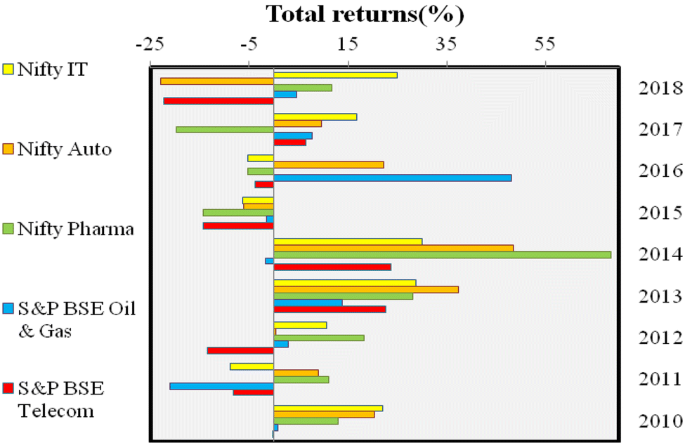
Performance comparison of sector indices based on total returns
Fig. 3 
Performance comparison of sector indices based on average daily returns
-
5.
Stock Market Forecasting Stock market forecasting is the process of predicting the future prices of stock market on the basis of previous historical data. Stock price time series is generally used for prediction task. Predicting stock market is an emerging task for investors, professional analyst and researchers as investing in stock market involve higher risk.
-
6.
Time Series A time series is a set of observations generally collected at successive point of time such as: xt = {xt ∈ R|t = 1, 2, 3… N} where t is temporal index and N is the total number of observations and these observations are recorded at regular time interval such as daily, monthly, quarterly, and annually [29]. Figure 4 shows the stock price time series of closing price of two Indian companies namely Tata Consultancy Services Ltd. (TCS) and Reliance Industries Ltd. (RIL) for period of 10 years. Time series are usually plotted by line charts. Examples of time series are stock price, gold price, currency exchange rate, commodity price, oil price, monthly sale of company, population of country measured at regular point of time etc. Time series are used in diverse application such as econometrics, weather forecasting, signal processing, control engineering, earthquake prediction, pattern recognition, statistics, stock market prediction and other financial market prediction [30]. The main aim of time series forecasting techniques is to forecast the future values of the series on the basis of regular pattern present in past observations of the series itself.
Fig. 4 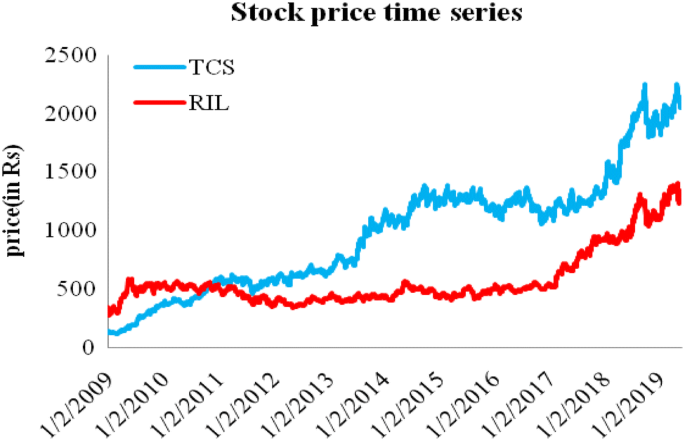
Indian companies stock price time series
-
7.
Fundamental Analysis Fundamental analysis is performed on the basis of economic data of companies and it involves forecasting stock markets using economic data of companies this is published at regular period of time for example price to earnings (P/E) ratio, turnover of company, profit and loss, annual and quarterly reports, assets and liabilities, balance sheet, income statements [3, 31]. It simply involves analyzing the performance of company based on certain fundamentals of company.
-
8.
Technical Analysis Technical analysis is in accordance with the time series data and it involves forecasting stock market using charts or technical indicators [3, 31]. It relies on the hypothesis that all information about the market is present in real time stock prices. Technical analysts use charts and modeling techniques to determine trends in stock price and it depends on previous data in order to predict future stock prices. It involves forecasting of the future stock price on the basis of past patterns of the stock through time-series analysis [32].
-
9.
Computational Intelligence (CI) It is collection of techniques that are applied to imitate the human thinking power in order to deal with complex problems of real world [33]. The taxonomy of CI is given in Fig. 5. Fuzzy logic, neural networks, genetic algorithms and other evolutionary computing techniques are collectively used in CI for representing knowledge and for simulating the decision-making and reasoning capability of human [34]. CI techniques have been applied in many applications such as pattern recognition [35], communications [36], heavy current system [37], intelligent speech recognition system [38], signal processing area [39], design and manufacturing [40], prediction and forecasting [14] and many diverse applications.
-
9.1
Artificial Neural Networks (ANNs) ANNs are massively parallel distributed system inspired by human brain [41]. It is a network of units known as artificial neuron that have a capability of processing and storing experiment knowledge. ANN imitate the human brain in two aspects (1) knowledge learned by the network using past experience(historical data) through learning process and (2) strength(synaptic weight) of connection between neurons is used to store the acquired knowledge. It is a connectionist model consists of three layers (1) input layer (2) hidden layer (3) output layer. Input is transmitted between layers by means of connection links. Each links posses an associated weight (connection strength) which is multiplied with the input coming from input layer to compute the net input (sum of all inputs at particular node). The net input is provided to the activation function to produce the output of the network. Connection models such as ANN are well suited for soft computing where connection weights are optimized to improve the performance of a network. Backpropagation algorithm (BP) is mostly used in artificial neural network to train the network [42, 43].
-
9.2
Fuzzy Logic Fuzzy Logic (FL) is an expansion of classical set theory and was proposed by Lotfi A. Zadeh and Dieter Klaua in 1965. Fuzzy logic is a method of representing human knowledge that is imprecise in nature in a particular area of application and in reasoning with that knowledge to take useful decision or make inferences [34, 44]. Fuzzy logic provides computational power to CI. In fuzzy logic, the knowledge is represented through if–then rules involving linguistic variables. Figure 6 shows the basic architecture of fuzzy logic system. The fuzzification interface translates the crisp input data into fuzzy linguistic data. In fuzzy logic system, fuzzification is necessary because existing data sources provide input in the form of crisp values. The inference engine uses the fuzzy input and fuzzy rules to generate fuzzy output. The defuzzification interface produces the crisp output action [33].
Fig. 5 
Core CI approaches for stock market forecasting
Fig. 6 
Basic architecture of fuzzy logic system [33]
-
9.3
Genetic Algorithm GA was invented by John Holland in the 1960s [34]. GA is derivative-free, parallel, adaptive and dynamic optimization method, which is inspired by biological evolution [33, 45]. It belongs to class of evolutionary computing. Evolutionary computing has the three main properties [34]: (1) it is population based stochastic search techniques as it is based on multiple searching points (2) it uses biological operations such as crossover and mutation to generate optimal solution (3) it is based on probabilistic operations. The basic process of genetic algorithm involves following steps:
-
1.
Initialization, where searching start with initial population which is created randomly.
-
2.
Evaluation, where each elements of population is evaluated and fitness of the members are computed using fitness function.
-
3.
Selection, where the members that fit the desired requirement are selected based on value of the fitness function.
-
4.
Crossover, where new generation known as offspring is generated by combining the best of the existing parents [46].
-
5.
Mutation, where a single bit within individual is changed to keep the diversity of population [46].
-
6.
In the next step, next generation is produced by changing the current population by newly generated off-springs.
-
1.
-
9.1


The process of evaluation–selection–reproduction is repeated until an optimal solution or near optimal solution is obtained or termination condition is satisfied.
4 Forecasting Work Flow
Stock market forecasting is an important research area. Developing an intelligent system that can forecast stock price is an emerging area of research for investors and financial analyst. Figure 7 depicts the generalized workflow for stock market forecasting adopted by different authors in the literature reviewed. Each chosen article is organized and investigated according to five main categories as shown below.

Generalized framework for stock market forecasting
A Systematic approach for forecasting the stock market comprised of following operational steps (1) selection of input variables, (2) data pre-processing, (3) feature selection and extraction, (4) training using prediction/classification model and (5) evaluating proposed model performance. The first step in forecasting process of stock market consists of selection of input features to be modeled by CI methods and output to be predicted. In the context of stock market forecasting various fundamental and technical input variables are available. Selection of input variables is main issue in the stock market forecasting and decision of which input variables to be used is not an easy task. Next step in the process is pre-processing of data selected in first step. Data is preprocessed in order to increase the prediction capability of models. Preprocessing mechanism can be used for noise removal, outlier detection, dealing with missing value and normalizing data. In the third phase, various feature selection or extraction techniques are applied to get the best representative variables of input data in order to reduce the dimensions of input data and reducing computational complexity of the model. In the next phase consists of determining the CI methods to be used for forecasting and training the model using training data. The last phase performance evaluation comprises selection of appropriate performance metrics and measuring the accuracy of model and taking the right decision. In this article each selected paper has been discussed according to generalized framework for stock market forecasting.
4.1 Stock Market Surveyed
In this section we have presented list of various stock market authors have investigated and acquired data for evaluating the performance of their models along with corresponding stock exchange, stock index and sources of dataset as shown in Table 1. Reza et al. [47], Thakur et al. [48] and Wang and Wang [49] model DAX index of German stock market traded in Frankfurt stock exchange. Lu [50], Thakur et al. [48], Asadi et al. [51], Chang and Liu [52] and Esfahanipour and Aghamiri [53] has taken TAIEX stock index of Taiwan of stock exchange for case study. Dai et al. [54], Qiu and Song [55], Qiu et al. [56], Liu et al. [57], Cheng and Yang [58] and Lei [59] attempted to predict NIKKEI 225 index of Tokyo stock exchange. Kara et al. [60], Boyacioglu and Avci [61] and Yolcu and Lam [62] studied the ISE national index of Turkey stock exchange. The BSE Sensex and Nifty 50 indices of Indian stock market are forecasted by Thakur et al. [48], Patel et al. [63], Pathak and Shetty [64], Senapati et al. [65], Chopra et al. [66], Rather et al. [67], Patel et al. [68], Dash and Dash [69, 70], Rout et al. [71], Pradeepkumar and Ravi [72], Pal and Kar [73] and Rajab and Sharma [74]. The DJIA S&P 500, IXIC and SPDR S&P 500 indices of New York stock exchange (NYSE) and NASDAQ of USA market are most common studied indices among the studies surveyed in this article by Niall and Madden [75], Asadi et al. [51], Wang and Wang [76], Liu and Wang [77], Chien and Chen [78], Zhang and Wu [79], Niaki and Hoseinzade [80], Hu et al. [81], Kazem et al. [82], Chien and Chen [83], Zhong and Enke [84], Chiang et al. [85], Liu et al. [57], Dash and Dash [69, 70], Sheta et al. [86], Sadaei et al. [87], Jiang et al. [88], Chang et al. [89], Rout et al. [71], Fischer and Krauss [90], Nayak et al. [91], Pradeepkumar and Ravi [72], Xiong et al. [92], Wang and Wang [49], Seo et al. [93], Lei [59], Rajab and Sharma [74] and Zhou et al. [94]. de Oliveira et al. [95] and Brasileiro et al. [96] examined Petrobras stock PETR4, traded in BM&FBOVESPA for case study. Asadi et al. [51], Esfahanipour and Aghamiri [53], Hadavandi et al. [97], Rezaee et al. [98] and Ghasemieh et al. [99] forecasted Tehran stock exchange. The major indices of China stock market are forecasted by Dai et al. [54], Wang and Wang [76], Liu and Wang [77], Wang et al. [100], Pang et al. [101], Tan et al. [102], Mo et al. [103], Pal and Kar [73], Lei [59], Yang et al. [104], and Zhou et al. [94]. Vanstone et al. [105] and Lei [59] predicted the ASX200 index of Australian stock market. Pullido et al. [106] have performed the prediction of Mexican stock exchange time series of Mexico stock market. Inthachot et al. [107, 107] attempt to predict the trend in SET50 index of Thailand stock exchange. Gocken et al. [108] model the BIST100 index of Turkish stock market. Wang et al. [100], Kim et al. [109] and Chung and Shin [110] attempt to forecast the Korean stock market. The Financial times stock exchange (FTSE) index of London stock market is forecasted by Nayak et al. [91] and Wang and Wang [49]. From south central European country Croatia’s Zagreb stock exchange was examined by Svalina et al. [111]. The Athens stock exchange (ASE) general index of Greece was studied by Chouemouziadis et al. [112].
Table 2 includes the articles that focus on forecasting of price of individual stocks instead of particular stock market indices. Ticknor [121] and Chang et al. [89] shows the ability of network to predict the major stocks of US. Mabu et al. [122] selected 16 main companies with high market capitalization from Tokyo stock exchange in Japan. Fazel et al. [123] evaluated the capability of proposed model by applying it on daily stock price data collected from IBM and Dell Corporation of IT sector and British airways and Ryanair of airline sector. Pang et al. [101] predicted the stock price of Petroleum and Chemical Corporation of China stock market. Xiong et al. [92], Shynkevich et al. [124], Laboissiere et al. [125], Pimenta et al. [126], Weng et al. [127], Gocken et al. [128], Zhang et al. [129], Shah et al. [130] and Chander [131] attempted to predict stock prices of varying number of companies instead of stock indices.
4.2 Input Variables
The first stage in stock market forecasting is selection of input variables. In the literature different authors have utilized varying number of input variables. Two most common types of features that are widely used for predicting stock market are fundamental indicators and technical indicators. Benjamin Graham used the fundamental analysis in 1928 and mentioned that investors have to analyze various fundamental factor of a firm before investing into it, like size of company, assets, liabilities, profit, loss, price-earnings ratio, capitalization, turnover, annual reports and other financial factors that reflect the overall health of company [132]. Technical analysis does not depend on the intrinsic and extrinsic fundamental attributes of the company in the field of stock market forecasting. According to technical analyst most of the fundamentals that affect the stock market are reflected in the stock price itself [4]. Technical analyst model stock prices as time series and try to identify future patterns on the basis of past values of time series. Teixeira et al. [133] used technical indicators which are determined by applying mathematical formulas to stock prices such as open price, close price, low price and high price and try to find future stock prices. Tsinaslanidis and Kugiumtzis [134] used various technical indicators viz. moving averages, relative strength index, momentum, rate of change, on balance volume, directional movement indicators among others factors for stock market prediction. Table 1 summarizes the input variable used by various authors in their article along with period and number of instances of dataset. Articles in Table 1 have been divided into various classes. The first class includes articles that utilize stock prices as input data, the second class focuses on articles that use stock prices and volume of shares traded. Third category comprises papers that use stock prices with Google trends, fourth category includes articles that use fundamentals indicators as input, fifth category consists of articles that use technical indicators as input variables, sixth category of articles use technical indicators with stock prices and last category includes articles that use both, fundamental and technical indicators. Wang and Wang [76], Kazem et al. [82], Senapati et al. [65], Yolchu and Lam [62] and Zhou et al. [94] used the daily stock price such as open price, high price, close price and low prices as input variables for proposed prediction model. The price at which a share is traded upon the opening of a stock exchange on a given trading day is known as open price. The closing price is the last price at which a share is traded on the closing of an exchange on a given trading day. High and Low prices are the daily highest and lowest price at which a share is traded on a specific trading day. Reza et al. [47] have used quarterly data for period of 40 years from April, 1972 to July, 2012 containing 163 instances. Lu [50] have used daily data for a period from Jan 2,2003 to Feb 27,2006 for TAIEX index comprising 781instances and Feb 2,2004–Feb 29,2008 for NIKKEI index containing 1000 instances Liu and Wang [77] and Chander [131] have selected open, close, high, low prices and volume of share traded as input to the model. Hu et al. [81] and Zhou et al. [94] utilized Google trend with and without open price, high price, closing price and lowest price and volume of share traded to develop prediction model.
Figure 8 shows the OHLC (open-high-low-close) chart of S&P BSE sensex for period of one financial year from April 2018 to March 2019 and depicts the movement in stock price over given time period. In OHLC chart, open-high-low-close prices are represented by two types of bar namely up-bar and down-bar. Each bar comprises of two horizontal lines and one vertical line. The bottom and top value in up-bar represent lowest and highest stock price and lowest and upper horizontal line represent daily opening and closing price on a given trading day and in down-bar, close price is lower than high price.

Open-high-low-close price of S&P BSE Sensex index
Vanstone et al. [105] have applied four fundamental indicators namely price earnings ratio (P/E), dividend payout ratio return on equity (ROE) and book value for forecasting of Australian stock market. Boyacioglu and Avci [61] used 6 macro-economic factors such as consumer price index, interest rates on deposits, US Dollar exchange rates, industrial production index, republic gold selling price, interest rates on Treasury bill and closing price of 4 indices namely DJI, ISE National 100. DAX and BOVESPA and Niaki and Hoseinzade [80] have used 27 economical and financial factors as input and select 20 factors that have considerable effect on movement of S&P 500 index. Rezaee et al. [98] used 7 fundamental variables belongs to Tehran stock exchange market such as total debt by total assets (TDTA), cash flow divided by total assets (CFTA), current liabilities divided by total assets (CLTA), working capital divided by total assets (WCTA), earnings before interest and taxes divided by total assets (EBTA) and net income divided by total assets (NITA), current assets divided by total assets (CATA) as input for the proposed prediction model for six consecutive years. Qiu et al. [56] have used 71 financial and macroeconomic indicators to develop a prediction model of Nikkei 225 index. The entire dataset comprises 237 monthly observations for a period from November 1993 to July 2013. Kara et al. [60] use 10 technical indicators viz. Simple 10-day moving average, Momentum, weighted 10-day moving average, Stochastic K%, Relative strength index (RSI), Stochastic D%, Moving average convergence divergence (MACD), A/D (Accumulation/Distribution) Oscillator, Larry William R%, and CCI (Commodity Channel Index) for a period of 11 years containing 2733 working days. Thakur et al. [48] have used a combination of fifty-five technical indicators as input variables to forecast the future movement of stock indices over the period from January 2008 to December 2013. Niall and Madden [75] investigated the capability of using external indicators like commodity prices and currency exchange rates with other technical indicators to foresee the movements in the Dow Jones Industrial Average (DJIA) index. Patel et al. [63] and Zhang and Wu [79] have chosen ten technical indicators as inputs to the proposed prediction models. Bisoi and Dash [135] in the proposed model used normalized data of four stocks for a period from 3rd Jan 2005 to 13th August 2008. Dai et al. [54] have applied four indicators such as low price, close price, previous day’s cash market high, and today’s opening cash index for forecasting Nikkei 225 closing index and B-share stock index’s closing price. Ticknor [121] have used 6 technical indicators namely 5 day and 10 day exponential moving average (EMA), stochastic K%, Stochastic D% relative strength index (RSI) and William R%, along with three daily stock prices namely open, high and low prices for a period of 2 years comprising 734 instances. Chien and Chen et al. [78] make use of 10 technical indicators including Moving Average (MA), Relative Strength Index (RSI), Stochastic Oscillator (K, D), Williams Overbought/Oversold Index (WILLIAM%R), Moving Averages Convergence and Divergence (MACD), Directional Movement Index (DMI), Commodity Channel Index (CCI), Rate of Change (ROC), and Average Directional Movement Index (ADX). Qiu and Song [55] performed the comparison of two types of input variables named as Type I and Type II to predict the movement of stock market index. Type I input comprised of 12 technical indicators and Type II input consists of 9 technical indicators. Experiment results show that Type II inputs variables generates higher prediction accuracy as compared to Type I input variables. In this article, authors have suggested that it is possible to enhance the accuracy of prediction model by choosing the appropriate input variables. Inthachot et al. [107] utilized 11 technical indicators for finding 44 input variables, where each technical indicator is represented by 4 different indicators on the basis of past 4 time spans as 3, 5, 10 and 15 days. Bisio and Dash [135], Chiang et al. [85], Cheng and Yang [58] and Chung and Shin [110] used technical indicators along with stock prices. Reza et al. [47], Niall and Madden [75], Zarandi et al. [136] and Weng et al. [127] employed both fundamental and technical indicators to provide the inputs to the model. de Oliveira et al. [95] have combined technical analysis, analysis of time series and fundamental analysis and to predict price and use monthly observations of PETR4 index containing a total of 144 observations (Table 3).
In this survey work, it is depicted that authors have used different types of input variables for prediction models. Figure 9 shows the distribution of different input variables used in the surveyed articles. Among various input variables, technical indicators are found to be used most often, followed by stock prices, fundamental indicators, technical indicators and stock prices, combination of technical and fundamental indicators and stock prices with volume and Google trends.

Input variables used in surveyed articles
4.3 Data Pre-processing
In stock market prediction quality of data is main factor because accuracy and reliability of prediction model depends upon the quality of data. In many soft computing applications real world data prone to be incomplete, noisy and contains outliers [138]. Any unwanted anomalies in the dataset are known as noise. Outliers are the set of observations that does not obey the general behavior of dataset [139]. Presence of noise and outliers may results in poor prediction accuracy of forecasting models. The data must be prepared such that it covers the range of inputs for which the network is going to be used. Data pre-processing techniques attempt to reduce error and removing outlier, hence improving the accuracy of prediction models. One of the data pre-processing techniques is data transformation. Transformation of data from one scale to another is useful in most heuristic approach especially when solving prediction problems [140]. Transformation or mapping of data from one scale to another is known as data normalization. It is necessary to retransform the pre-processed data to original scale for obtaining actual results using post-processing techniques [51]. In the literature, authors have used various kinds of normalization techniques for transforming data from one scale to another. Reza et al. [47] authors have used various data preprocessing techniques like min–max normalization for normalizing data and three statistical based information criteria(IC) such as Bayesian information criteria (BIC), Schwarz Bayesian information criteria(SBIC) and Akaike information criteria (AIC) for lag selection because stock market feature show their effects with lag of time. Lu [50] presented an integrated independent component analysis (ICA) to remove noise contained in dataset. The output of ICA containing less noise is used as input of backpropagation neural network (BPN) to create forecasting model. Asadi et al. [51] and Hadavandi et al. [97] have used Min–Max normalization for mapping the data in the range [− 9, 0.9]. Normalization of data in neural network is necessary to avoid learning of irrelevant pattern in data [51]. If the input to artificial neural network (ANN) is not scaled in small range, then the network may not give useful results or cannot converge on training [141]. Dai et al. [54] original time series is processed by the logarithmic data smoothing technique for removing noise. Wang and Wang [76], Liu and Wang [77], Qiu et al. [56], Senapati et al. [65], Chopra et al. [66], Wang et al. [100], Chiang et al. [85], Dash and Dash [69, 70], Pang et al. [101], Chang et al. [89], Rout et al. [71], Wang and Wang [49], Chung and Shin [110] and Chander [131] in order to minimize the impact of noise in stock market data and to increase the accuracy, have normalized original dataset in the interval [0, 1] using Min–Max normalization techniques. Wang et al. [8] suggested hybrid forecasting model called Wavelet De-noising-based Back Propagation (WDBP) by combining wavelet transform (WT) for removing noise as pre-processing step and back propagation neural network (BPNN). WT is a technique for removing noise from dataset before training the model. In this study WT decompose the closing price time series into low frequency component and high frequency component. The high frequency component has been discarded as it represents noise and low frequency component is used as input to WDBP for predicting future stock price. Hu et al. [81] and Inthachot et al. [107] mapped original dataset into interval [− 1 1] using min–max normalization techniques. Kazem et al. [82] in the preprocessing phase of their study, firstly applied mutual information (MI) function is utilized to identify the time delay constant, secondly, false nearest neighbors (FNN) is used to find out minimum embedding dimension and then using the best time delay and embedding dimension they reconstruct the time series phase space to show its hidden dynamics and at last they applied min–max normalization technique to transform the data in the range [0 1]. Zhong and Enke [84] presented the stock price time series forecasting model by employing three dimensionality reduction techniques namely principal component analysis (PCA), kernel-based principal component analysis (KPCA) and fuzzy robust principal component analysis (FRPCA) with artificial neural network (ANN). In this article, authors first preprocessed the raw data to handle missing values, mismatched samples and outliers. They used the average of existing values on both sides of Table’s cell consisting of missing values to fill missing values. To deal with outliers, authors have defined an interval and a value that lies outside the interval is regarded as outlier. In that study, from 60 financial and economic factors, 36 most influential and correlated variables are selected by three version of PCM. Chiang et al. [85] used wavelet transformation to smoothed stock prices and volume of stock before providing data to proposed model. Wavelets are useful techniques for mining information from different types of data. Zarandi et al. [123] applied self-organizing map neural network method as a preprocess step for forming cluster of input data. Ghasemieh et al. [99] used two normalizing methods namely linear normalization and stochastic normalization to map data in the interval [− 1 1]. Nayak et al. [91] and Gocken et al. [128] applied sigmoid function to normalize the data in the interval [0 1]. Pimenta et al. [126] employed locally weighted scatterplot smoothing (LOWESS) mechanism to detect and remove outliers from stock market dataset. According to him, outliers in stock price time series are the observations which show abnormal variations of the stock price that indicates the presence of extrinsic factor which could not be modeled without the availability of restricted information and these outliers need to be removed as these observations can lead to serious problem in training phase.
4.4 Feature Selection and Extraction
Feature selection simply means choosing important features and discarding irrelevant ones. Feature selection is applied to choose best optimized features and it is the key issue in stock market forecasting task [142]. The emphasis of feature selection approaches is to choose subset of features from the input dataset which can effectively represent the input data while minimizing the impacts of noise or irrelevant variables and still produce good prediction results and minimizing computational complexity such as running time [143]. Selection of irrelevant and incorrect feature can result in model which cannot predict the real behavior of stock market. Feature selection algorithms determine a reduced set of important features that can be used as input in prediction model for minimizing the error and selected features are best representatives of data [51]. These methods results in lower accuracy and involves higher computational scalability.
Feature extraction method which is different from feature selection method involve mapping from original higher dimensional feature space to lower dimensional feature set which is more informative with respect to the task performed [144]. The advantage of feature extraction techniques is that hidden information in the original dataset can be retrieved. Based on the operation both method, feature selection and feature extraction method are classified into filter method and wrapper method [142]. According to Lee [143] filter methods are those which accomplish the selection of key variables independent of any classification or regression method. These methods simply analyze the input data on the basis of some statistics and determine some key features. On the other hand wrapper methods depends on accuracy measure of given soft computing method and involves high computational costs but perform better [145]. Correlation, F-score, stepwise regression, principal component analysis (PCA) and many others have been utilized in literature to select optimum set of features.
Lee [143] developed a hybrid feature selection approach by combing filter and wrapper methods to forecast stock market trend in two stages. In the first stage they used F-score statistics as filter to determine the optimum subset from given set of features. In the second stage, they applied support vector machine (SVM) classification technique as wrapper prediction method to generate set of key features. Kao et al. [146] developed a stock price prediction approach by applying non-linear independent component analysis (NLICA) for extracting key features known as independent components (IC) from input dataset and using extracted IC as input to support vector regression (SVR). NLICA is a feature extraction method which is based on the assumption that data are nonlinear aggregation of latent source signal and is used to find independent component which contains hidden information and is more suitable for stock price forecasting. Reza et al. [47] have used cross correlation feature selection technique for choosing important features from 20 features and select 13 features that are appropriate for predicting stock market. Thakur et al. [48] proposed four hybrid prediction models by combining four different feature selection approaches for selecting optimal set of indicators such as Linear Correlation (LC), Regression Relief (RR). Rank Correlation (RC) and Random Forest (RF), with proximal support vector machine (PSVM) classifier for trend (bullish or bearish) forecasting in stock market. They evaluated the performance of the proposed model for 12 different stock indices, on the basis of certain number of performance metrics. The performance obtained on a set of stock market indices from several international markets demonstrate that all hybrid models show good performance than the individual PSVM prediction technique. The comparison among the proposed models shows RF-PSVM outperforms all other prediction approaches. The highest accuracy on S&P BSE Sensex dataset is achieved when 48 technical indicators are selected. de Oliveira et al. [95] developed a neural network model for the prediction of stock’s close price future behavior. They have conducted the market analysis to find the parameters that governs the stock market and found 46 total variables and performs the cross-correlation of all the variables with closing price to find the optimized subset of variables containing 18 variables. Asadi et al. [51], Esfahanipour and Aghamiri [53], Hadavandi et al. [147, 97], Hsieh et al. [148] and Chang et al. [89] employed stepwise regression analysis (SRA) for choosing the important variables that have increased the accuracy of forecasting model of stock market. SRA technique finds a set of input variables that have most effects on output variables. Chang and Liu [52] applied stepwise regression analysis and K-means clustering techniques for enhancing the performance of proposed model. Dai et al. [54] used Nonlinear independent component analysis (NLICA) to transform the time series data into the feature space comprises of independent components (ICs) describing key information of the original data. After that, the ICs are used as the input of the neural network to construct prediction model named as NLICA-BPN. Simulation results show that the proposed prediction model has improved the performance of the neural network and also outperforms the PCA–BPN, LICA–BPN and single BPN approach. Wang and Wang [76] proposed the use of principal component analysis (PCA) in combination of stochastic time effective functional neural network (STNN) for analyzing stock price time series. In the proposed model they first implied PCA for to withdraw principal components (PC) from input dataset and then use these components as input to STNN. They compared the result of PC–STNN model with backpropagation neural network (BPNN) model, PC–BPNN model and STNN and show that prediction performance of proposed model is better than others. Niaki and Hoseinzade [80] employed a factorial design and concept of grouping to conduct a design of experiment in order to determine most influential factors among 27 financial and economical variables. The statistically significant factors selected through design of experiments are used as input to artificial neural network (ANN) to foresee the daily movement of S&P 500 index. Results from study shows that proposed methodology perform effectively better than buy and hold approach. Qiu et al. [56] utilized fuzzy surfaces for extracting effective set of input variables from original variables set. Inthachot et al. [107] used genetic algorithm to find the effective subset of features from a set of 44 features and used the optimized set of features as input to neural network. Zahedi and Rounaghi [149] performed the prediction of Tehran stock exchange by applying ANN model and principal component analysis (PCM). PCM is used in this study for extracting key features from 20 accounting variables. Gocken et al. [108] utilized genetic algorithm (GA) and harmony search (HS) for selecting the most appropriate features for Turkish stock market forecasting model. In this study, they firstly considered 45 technical indicators and at the end selected 26 and 23 variables by GA and HS model respectively. Tan et al. [102] and Weng et al. [127] utilized PCA to reduce dimensionality of the original dataset and obtaining various components which provides more valuable information. Laboissiere et al. [125] proposed the combined use of correlation analysis and multi-layer perceptron (MLP) model to learn the input features that have most impact on stock market to deal with the problem of forecasting maximum and minimum daily stock prices of three Brazil power distribution companies. Lei [59] proposed an integrated method by combining rough set (RS) and wavelet neural network (WNN) to enhance the accuracy in predicting stock market trend. In that work, firstly RS is applied to reduce the dimensions of input features set in addition to determine the optimal architecture of WNN. Then selected features are provided as input to optimized WNN prediction model to forecast the trend in five stock market indices. The simulation results show that by reducing the attributes through RS the prediction accuracy of WNN can be significantly improves to model the forecasting problem. Pimenta et al. [126] proposed a features selection approach on the basis of trading rules generated from technical indicators in his research work using genetic programming.
4.5 Forecasting Models
Forecasting stock price time series is one of the challenging task in time series and CI domain [2]. Forecasting models depends on the choice of task performed by authors’ i.e. whether they want to forecast trend (up or down) in stock market which is modeled as classification task or prediction of numeric value i.e. stock price or stock index which is modeled as regression task. In the past several years, a number of approaches have been proposed that can be applied for stock market time series forecasting. In this survey paper, our focus is on core CI approaches such as neural network, genetic algorithm, fuzzy logic and other evolutionary computing approaches.
4.5.1 Artificial Neural Networks (ANNs)
ANN is one of the efficient techniques to forecast stock market as it does not comprised complex formulas as compared to traditional liner and non-linear models [150]. ANNs have become popular technique used for forecasting stock market forecasting since last decade. The wide use of ANNs for forecasting stock market time series is due to capability of ANNs for handling data that are characterized by nonlinearity, high-frequency polynomial components and discontinuity [77]. ANNs are self-organizing, data-driven and self-adaptive techniques that have capability to adopt nonlinearity of time series without considering any statistical assumption about data [151]. Many types of ANNs have been employed in literature for forecasting stock market time series. Kara et al. [60] perform the prediction of upward and downward trend in ISE National 100 index using artificial neural network (ANN) and support vector machine (SVM). On comparing the performance of these techniques and showed that prediction accuracy of ANN model is higher than SVM model. In the experiments presented in Niall et al. [75], feed-forward neural network has been used to predict the next day DJIA index close price. They started the experiment by feeding neural network with current day opening price and previous 5 day opening price of DJIA. Then they gradually increase the input by introducing 10-day and 30-day moving average (MA), Previous 5 days’ daily gradients of DJIA, crude oil price, crude oil price and currency data, crude oil, currency data and gradient of DJIA. Experiment results show that neural network trained on 31 variables including external factors resulted in a return on investment (ROI) of 23.5% per annum at a time when the DJIA index increased by 13.03% per annum. Dhar et al. [152] use an ANN to foresee 1 day ahead closing stock price of Indian stock market. They used back propagation algorithm to train three layer neural networks. In this article, aim of the authors was to find the best ANN parameters by performing multiple experiments with different combinations of ANN parameters such as number of hidden layers, and number of nodes in each layer and learning rate. Vanstone et al. [105] employed multilayer Perceptron (MLP) to develop automatic trading system for Australian stock market. They used four fundamentals indicators such as return on equity (ROE), book value, dividend payout ratio and price to earnings ratio (P/E) as input for MLP. The output of neural network is a signal whose strength gives the expected return in 1 year time frame. Ticknor [121] implemented feedforward neural network (FFNN) combined with Bayesian regularization to foresee the movement in stock market. In Bayesian network the weight between the layers of network is considered as random variable and thus their density functions are represented using Bayes rule. During training, weights are adjusted by finding the probability density function of each weight. The proposed prediction technique minimizes the impact of overfitting and overtraining and improves prediction accuracy and generalization of network. Mabu et al. [122] investigated the use of ensemble learning paradigm by combining a rule based evolutionary technique and artificial neural network to take buy or sell decision in stock trading. In this article, a genetic network programming has been used for generating large number of stock rule pool and multilayer Perceptron (MLP) is used to select the best rule for making good decision in stock market. Guresen et al. [150] assess the performance of different neural network model for stock market index prediction. In that study, they have used multi-layer perceptron (MLP), dynamic artificial neural network (DAN2) and hybrid neural network by combining autoregressive conditional heteroscedasticity (GARCH) and exponential autoregressive conditional heteroscedasticity (EGARCH) with MLP. Liu and Wang [77] have presented a predictive approach for forecasting price fluctuation in stock market which is based upon Legendre neural network and random time strength function (LNNRT). They have also introduced the Brownian motion in proposed model to model the effect of random movement. Adebiyi et al. [153] compared the prediction capability of ANN approach with conventional Box–Jenkins autoregressive integrated moving average (ARIMA) and ANN model for the prediction of New York stock exchange. The experiment results reveal that neural network model perform better than ARIMA model. Chopra et al. [66] examined the capability of ANN to predict the Indian stock market before and after demonetization. In this article, backpropagation neural network (BPNN) is trained by Levenberg–Marquardt algorithm. Patel et al. [68] perform the comparison of four trend prediction techniques namely artificial neural network (ANN), naive-bayes classifier, random forest, and support vector machine (SVM) to predict the direction of movement of two stocks and two indices of Indian stock market. In this study, they considered two scenarios for input. In the first scenario, they used ten technical indicators and in the second scenario they represent these technical indicators as trend deterministic data. Zhong and Enke [84] applied artificial neural network (ANN) along with three version of principle component analysis (PCM) as a classification model to forecast the daily movement of stock market return. Wang et al. [100] developed a prediction model (ST-ERNN) which integrate Elman recurrent neural network (ERNN) with stochastic time effective function to predict stock market indices. In this article, they have analyzed the proposed model with the complexity invariant distance (CID), linear regression and multi-scale CID (MCID) and compared the result of prediction model with backpropagation neural network (BPNN), Elman recurrent neural network and the stochastic time effective neural network (STNN). The experiment results reveal that proposed model give the superior performance among other neural networks in stock price time series forecasting. Dash and Dash [70] developed a decision support system by combining learning capability of computational efficient functional link artificial neural network (CEFLANN) with the set of rules created from technical indicators for generating trading signals. In this article, extreme learning machine (ELM) method is used to train the CEFLANN network instead of traditional backpropagation algorithm and forecasting ability of proposed method has been compared with other machine learning techniques. Kristjanpoller and Minutolo [120] developed a hybrid volatility forecasting model by combining artificial neural network (ANN), generalized autoregressive conditional heteroskedasticity (GARCH), technical analysis and principal component analysis to forecast price volatility of bitcoin. Sheta et al. [86] explored the application of artificial neural network (ANN), support vector machine (SVM) and traditional multiple linear regression model (MLR) to build a prediction model for prediction of S&P 500 stock index and compared the performance of three approaches. In this study, the SVM outperforms MLR and ANN models. Pang et al. [101] developed an innovative neural network approach by proposing the deep long short-term memory neural network (LSTM) with embedded layer and the long short-term memory neural network with automatic encoder for stock market prediction. In this paper, they introduced the idea of stock vector in which input is not a single stock index but group of stock indices. In the two models embedded layer and automatic encoder are used to form vector of the stock market data. Simulation results demonstrate that deep LSTM with embedded layer provide better prediction accuracy than LSTM with automatic encoder. Fischer and Krauss [90] deployed long short term memory (LSTM) networks, a class of recurrent neural networks whose network structure is composed of at least one cycle and hidden layer is characterized by memory cell to predict the directional movement in financial time series. Prediction results of proposed method and memory- free classification techniques such as deep neural network, random forest and logistics regression classifier reveal that LSTM networks provide superior accuracy. Shynkevich et al. [124] utilized artificial neural network (ANN), K-nearest neighbor (KNN) and support vector machine (SVM) classifiers to investigate the impact of input window length on the future stock price trends. Input window length is a time span parameter which indicates how many past values in stock price time series can be utilized to compute the technical indicators which are provided as input to forecasting models for predicting the direction of future stock market. Results depict that maximun forecasting performance is achieved when the window length is approximately same as forecast horizon i.e. n-days ahead. Wang and Wang [49] suggested the use of stochastic time strength neural network (STNN) in combination with empirical mode decomposition (EMD) to enhance the prediction accuracy of stock price movement. In this research, EMD which is processing technique is used to extract all the oscillatory components present in stock price time series by decomposing original time series into various high and low frequencies subseries known as intrinsic mode functions (IMFs). The STNN forecasting model is applied for each IMF to obtain predicted value of each subseries and the predicted value of each subseries is aggregated to obtain the prediction of original stock price time series. Seo et al. [93] combined artificial neural network with different versions of generalized autoregressive conditional heteroscedasticity models (GARCH) and Google domestic trends (GDTs) to foresee the volatility of stock price time series. A Google domestic trend is open source services provided by Google to analyze the various sectors of finance and economics. In this work, the authors firstly estimated the volatility using family of GARCH model and then used output of GARCH family and GDTs as input to neural network for accurate forecasting of volatilities of S&P500 index. Mo et al. [103] introduced an exponent type connection into back propagation neural network (BPNN) to create an exponent back propagation neural network (EBPNN) for forecasting cross correlations between Chinese shanghai stock exchange (SSE) and Shenzhen stock exchange (SZSE) composite indexes in China stock market. In EBPNN information is processed by performing the dot product of exponent of input vector and weight vector. This research is motivated by concept that exponential type function captures more fluctuations in non-stationary data. The experiments result reveals that the EBPNN outperforms BPNN. Weng et al. [127] developed an expert system based on ensemble of machine learning methods such as artificial neural network, support vector regression, boosted regression tree and random forest regression that utilizes the features from multiple online sources to predict short term stock prices. The key idea of this work is to incorporate data from various sources such as historical stock prices, technical indicators, articles about given stocks published in news, Google search about given stocks and number of visited Wikipedia pages for related stocks. After data collection and preprocessing, the authors have applied principal component analysis to take off the effective features which are used as input to forecasting model. Results showed that use of features from online sources improved the accuracy of ensemble methods. Gocken et al. [128] combined harmony search (HS) with the architecture of artificial neural network (ANN), extreme learning machine (ELM), Jordan recurrent neural network (JRNN), recurrent extreme learning machine (RELM), regression tree (RT), generalized linear model (GLM), and Gaussian process regression (GPR) for short term and middle term stock price prediction. In this work, HS is utilized for feature selection and tuning the parameters of various proposed hybrid model. The parameters to be optimized are transfer function, number of hidden and context neurons in different models. Zhou et al. [94] developed a two-stage novel strategy based on empirical mode decomposition (EMD) and factorization machine based neural network (FNN) named as EMD2FNN to forecast the stock market trend. In the first stage, an efficient method to deal with non-stationary data namely EMD is used to bread down the original stock price time series data into number of components known as intrinsic mode functions (IMFs) which contains an oscillatory components within narrow range. In the second stage, each extracted IMF is provided as input to FNN to predict future stock price. Experiment result of proposed model provide better performance with respect to other models such as neural network (NN) model, the factorization machine based neural network (FNN) model, the wavelet de-noising- based back propagation (WDBP) neural network model, the empirical mode decomposition based neural network (EMD2NN) model.
4.5.2 Fuzzy Logic
Fuzzy logic approaches have been applied by many authors with relatively high success rate for modeling and forecasting stock price time series. Hadavandi et al. [147] proposed a combined approach by integrating genetic fuzzy system (GFS) and artificial neural network (ANN) to create an intelligent system for stock price prediction. They applied stepwise regression analysis for determining key features that have most influence on stock price and selected features are categorized into multiple clusters using self-organizing map (SOM). Finally all the clusters are used as input to GFS for extracting rule base. Results showed that the proposed model depicts better performance as compared to other approaches like ARIMA and ANN. Chang and Liu [52] developed a Takagi–Sugeno–Kang (TSK) type fuzzy rule based approach for stock market forecasting. They applied simulated annealing (SA) for determining the set of best parameters of fuzzy system. To justify the prediction accuracy they showed that TSK fuzzy rule system performs better than back propagation neural network (BPNN) and multiple regression technique. Esfahanipour and Aghamiri [53] implemented Neuro-Fuzzy inference system by adopted on a TSK type fuzzy rule base system for stock market forecasting and applied Fuzzy C-Mean clustering for determining number of rules. Boyacioglu and Avci [61] examined the capability of adaptive network based fuzzy inference system (ANFIS) for predicting stock market return. The experiments results show that ANFIS can be efficiently used for solving stock market prediction problems. Pathak and Shetty [64] generated fuzzy rule base for forecasting stock faith (high or low) which is strength of recommendation for buying or selling stocks. The proposed model has been implemented in three modules. In the first module, they used machine learning algorithms for predicting close price of stock. In the second module, they obtain sentiment value of latest news headlines about each stock. In the third module, outputs from both the modules are used as input to fuzzy logic module for generating fuzzy rule base. Zarandi et al. [136] applied a type-2 fuzzy system for stock price prediction by using both fundamental and technical indicators as input to the proposed model. In this study, the parameters of membership function are refined by genetic algorithm. Liu et al. [57] investigated the benefit of type-2 neuro-fuzzy system to model the stock price prediction problem. In this article, the given dataset is segmented into clusters using self-constructing clustering method and then a rule base of type-2 TSK rule is generated from each cluster. The parameters associated with type-2 neuro fuzzy model are tuned by particle swarm optimization and least square estimation. Zarandi et al. [123] presented a four-layer fuzzy multiagent system (FMAS) to create a hybrid intelligent system that combines the multiple intelligent agents to predict the next day stock price. The first layer is used to collect relevant information about the problem domain using expert knowledge. The second layer is dedicated to feature selection and cluster formation. The role of third layer is to build a model for all clusters using genetic fuzzy system and optimizing the built model to select the best fuzzy system for every cluster. The aim of fourth layer is analyzing the model and knowledge representation. Svalina et al. [111] created a prediction model which employs an adaptive neuro-fuzzy inference system (ANFIS) for prediction of close price of stock market, 5 days in advance, individually for each day. Dash and Dash [69] proposed a self evolving recurrent fuzzy inference system (SERFIS) for enhancing the prediction power traditional neuro-fuzzy system. The model is created by using the first order Takagi–Sugeno–Kang (TSK) type fuzzy system with two variant of feedback connection i.e. by providing the firing strength of the fuzzy rule back to it and introducing time delay feedback loops in the output layer. In this article, authors proposed a modified differential harmony search (MDHS) to optimize the feedback loop, antecedent and consequent parameters of proposed approach. In order to compare the result of proposed model, another network namely recurrent functional link artificial neural network (RCEFLANN) is also presented in this paper. Su and Cheng [116] presented a novel stock price prediction model by employing adaptive neuro fuzzy inference system (ANFIS) and integrated nonlinear feature selection (INFS) techniques. This study used INFS method to select the key technical indicators which are utilized as input to ANFIS forecasting model to obtain primary forecasted value and at last, adaptive expectation model is used to further increase the performance of prediction model. Sadaei et al. [87] initially used differential fuzzy time series logic to forecast trend in stock market data and then introduced a novel evolutionary technique namely imperialist competitive algorithm (ICA) to further enhance forecasting accuracy of initial model by optimizing the model parameters. Chouemouziadis and Chatzoglou [112] presented a short term trading fuzzy model by using Mamdani fuzzy system and mixture of commonly used and rarely used technical indicators for generating trading signals in stock market. Jiang et al. [88] presented an interval type-2 fuzzy logic system (IT2FLS) to forecast stock indices on the basis of fuzzy time series and a fuzzy logic relationship map (FLRM). In this article, proposed model works in five steps. First step involves finding the variation within time series. Second step includes fuzzification of time series and defining fuzzy set. In the third step, input interval type-2 fuzzy sets (IT2FSs) and output intervals of interval type-2 fuzzy logic system (IT2FLS) are defined. Fourth step includes creating fuzzy logic relationships (FLRs) and the fuzzy logical relationship map (FLRM) and finally foresee the future values. Zang et al. [118] suggested a novel approach based on fuzzy logic and combination of visibility graph and link prediction to enhance the accuracy of time series prediction problem. In the proposed method, time series is firstly transformed into visibility graph then link prediction technique is applied to obtain initial prediction and finally fuzzy logic is utilized to further enhance prediction accuracy by determining fuzzy rules based on relationship between historical data. On the basis of comparison between previous studies, authors showed that proposed method have better predictability. Cheng and Yang [58] proposed the use of fuzzy time series model and rough set rule induction to forecast stock index. In this work, the authors have applied rough set rule induction algorithm namely LEM2 (Learning from Examples Module version 2) to extract forecasting rules of selling or buying from time series to obtain initial forecast. After that, the adaptive expectation model is utilized to enhance forecasting performance of initial forecast. The adaptive expectation model is a reasonable forecast model in time series forecasting. In stock price time series forecasting, by using adaptive expectation model the future stock prices are generated by the past single period of stock price and forecasting error for last one period. Chander [131] formulated the stock price time series prediction model based on fusion of wavelet transform (WT) with adaptive neuro fuzzy inference system (ANFIS). In this work Haar wavelet transform is utilized to split the normalized time series data into two components viz. approximation components and detail coefficients to construct feature vector which is provided as input to ANFIS model to generate future stock price as outcome of proposed model. Results from comparison of proposed model with ANN and hybrid of ANN with wavelet transform show the superiority of the model.
4.5.3 Genetic Algorithms (GA)
GA has been effectively used in literature to enhance the forecasting accuracy of prediction models. Shahrokh et al. [51] suggested a genetic algorithm (GA) based paradigm to construct a classification model that can find trading rules from technical indicators. They used GA for optimizing initial weights of neural networks and Levenberg–Marquardt backpropagation algorithm (LMBP) for training feed forward neural network. The outcome shows that proposed forecasting model has a capability to deal with the fluctuations of stock market and gives good prediction results. Chang et al. [78] build an associative classifier by proposing genetic algorithm (GA) approach for generating sell and buy signals. The proposed model determine trading rule from technical indicators. Lee and Tong [154] developed a hybrid forecasting model by combining Autoregressive integrated moving average (ARIMA) with Genetic Programming (GP) to foresee non-linear time series. ARIMA is applied to handle the linear portion of time series and GP is utilized to handle the non-linear portion of time series to increase the accuracy. To test the accuracy of proposed hybrid model, authors have used three time series and shows that hybrid model can be best utilized for time series forecasting problems. Chang et al. [155] developed a novel model by using genetic algorithm to tune the connection weight of partially connected neural network to forecast trend in stock market. Huang [156] developed a paradigm for stock selection problem using support vector regression (SVR) and genetic algorithm (GA). In this study, SVR is used for prediction of return of collection of stocks and top performing stocks are selected for portfolio creation. GA is used to obtain the best parameters of SVR. Chien et al. [83] build a genetic algorithm (GA) based associative classification rules (ACR) classification model for discovering trading rules from technical indicators which generates buy or sell signal. Chang and Lee [115] incorporated Markov decision process and genetic algorithm to create a decision support system for best stock investment strategy. In this study, Markov decision process is used to assist investors for choosing right timing and trading strategies for selling or buying stocks and genetic algorithm is used to help investors for selecting the stocks optimally and capital allocation. These two strategies are combined to deal with portfolio problem and providing high return on investment to investors. Mabu et al. [122] applied a graph based evolutionary algorithm namely genetic network programming (GNP) for extracting significant number of stock trading rules from technical indicators. These stock trading rules are used to make decision about the best time for selling or buying stocks. In this article, multi-layer perceptron (MLP) is used to select the effective rule pools for stock trading from several rule pools generated by GNP. Kim et al. [109] developed an intelligent hybrid trading system to find out the trading rules applying rough set analysis and genetic algorithm (GA). In this study, rough set extract the trading rule from given technical indicators and GA is used to look for optimal cut points for data discretization and to find subset of attributes to discover the sub-optimal trading rule. These optimal trading rules are utilized to generate the buy or sell trading signal. Pimenta et al. [126] formulated an automated investing method based on technical analysis, feature selection, outlier filtering, genetic programming (GP) and ensemble to take three investment decisions such as to buy or to sell or to stay shares of company. In this work, Firstly, outlier filtering is employed to detect and remove the observations that don not obey the general characteristics of given stock market data and then GP is used to generate purchase rules and sale rules from association of selected technical indicators and generated rules are used to create ensemble and finally ensemble is applied to identify one of the three trading decision.
4.5.4 Hybrid Prediction Model
In hybrid prediction techniques, combining core CI approaches has become a useful procedure to enhance the accuracy of prediction model by combining advantages of individual approaches and avoiding drawback of certain individual techniques. Cheng et al. [157] recommended that hybrid algorithms are more efficient in improving the accuracy of individual base learner. In this section we have presented various hybrid prediction models applied for forecasting stock market.
4.5.4.1 Hybrid ANN
In this section we have presented various articles that are based on hybridization of artificial neural network with other techniques. Reza et al. [47] proposed hybrid bat neural network multi agent system (BNNMAS) to forecast stock price. In this article, proposed model works in 4 layer multi-agent scenario. In the first layer data collection and data-preprocessing task has been performed. In second layer cross correlation technique and lag selection has been used to choose relevant feature and best time lag. Out of 20 fundamentals and technical indicators, 13 important features have been selected for prediction task. In the third layer bat algorithm (BA) has been used as learning algorithm of three layer neural network and radial basis function (RBF) as activation function for hidden layer and fourth agent is used for validation testing. The performance of BNNMAS has been compared with other methods viz. genetic algorithm neural network (GANN) and generalized regression neural network (GRNN). The mean absolute percentage error (MAPE) statistic shows superiority of BNNMAS over other methods. Patel et al. [63] proposed two stage fusion approaches. In the initial stage, Support Vector Regression (SVR) is used to predict future value of technical indicators. Artificial Neural Network (ANN), SVR and Random Forest (RF) are used in last stage of fusion resulting into SVR–ANN, SVR–SVR and SVR–RF fusion prediction models to predict the future value of closing price. The prediction accuracy of proposed hybrid models has been compared with the single stage scenarios where ANN, SVR and RF are used individually. The experiments result shows that two stage prediction models outperform the single stage prediction models. Bisoi and Dash [135] presented a Infinite impulse response (IIR) based dynamic neural network to forecast stock price index from 1 day before to 30 days in advance of four distinct stocks, namely Bombay stock exchange(BSE), IBM stock, RIL stock and oracle corporation stock. To train the DNN four different learning algorithms such as real time recurrent learning algorithm (RTRL), differential evaluation (DE), unscented kalman filter (UKF) and a hybrid approach DEUKF has been used. From the result it is concluded that DEUKF shows high performance for all stock market indices in comparison with DE, UKF and RTRL. The effectiveness of DNN and DEUKF has been compared with other modified neural network techniques like local linear wavelet neural network (LLWNN), the local linear RBFNN (LLRBFNN) and the Laguerre FLANN. Shen et al. [158] have applied radial basis functional neural network (RBFNN) for training the stock market historical data of Shanghai stock exchange and employed the artificial fish swarm algorithm (AFSA) to optimize the parameters of RBFNN. In this article, to increase the prediction accuracy they have used AFSA for optimizing width and weight of centre of K-means clustering algorithm while training RBFNN. To demonstrate the effectiveness of proposed model, authors have compared the prediction results with the RBFNN, back propagation (BP) algorithm, ARIMA and support vector machine used individually and other hybrid models of genetic algorithm (GA) and particle swam optimization (PSO) with RBFNN. Results depict that proposed model outperforms other models. Pullido et al. [106] developed a hybrid method comprised of particle swarm optimization (PSO) and ensemble neural network with fuzzy aggregation for complex time series forecasting. In this article, PSO is employed to tune the parameters of neural networks and to determine the optimize number of individual neural network used to create ensemble neural network. They used type-2 fuzzy for combining the output of individual neural network which form the ensemble. Abdul-Sal et al. [137] performed the comparisons of differential evolution algorithm (DE) and particle swarm optimization (PSO) in optimizing the parameters of feedforward neural network (FFNN) which is utilized to predict daily stock prices. Comparison between the two optimization techniques has been made on the basis of prediction accuracy, convergence speed and generalization ability. Result from this study shows that both the optimization techniques avoid the problem of local minima. DE technique converges to global minima more rapidly than PSO and DE perform better than PSO. Zhang and Wu [79] integrated the backpropagation neural network (BPNN) and improved bacterial chemotaxis optimization (IBCO) to establish a forecasting model that can efficiently predict stock index of S&P 500 index. The proposed model has been used for both short term (next day) and long term (15 days) stock index prediction. The mean square error computed from the experiment reveals that BP-IBCO model outperform the traditional BPNN model. Feng and Chou [113] developed an artificial neural prediction approach by combining stepwise regression analysis (SRA), radial basis function neural network (RBFNN) and recursive based particle swarm optimization (RPSO). SRA is used for data filtering i.e. for determining important features and RPSO which is hybrid learning algorithm build by combining PSO and recursive least square (RLS) learning algorithm has been applied for extracting the appropriate parameters of RBFNN prediction technique. Hsieh et al. [148] proposed an integrated approach by combining wavelet transform (WT), recurrent neural network (RNN) and artificial bee colony (ABC) algorithm for stock market prediction. In this study, they used the WT for de-noising stock market time series and ABC algorithm is employed to tune the RNN weight and biases. Hongping et al. [81] presented the improved sine cosine algorithm (ISCA) to tune the parameters of back-propagation neural network (BPNN) for forecasting the direction of opening stock price of two US stock indices namely S&P 500 and DJIA. In this article, they have performed two variant of prediction i.e. Type I prediction without considering Google trend data and Type II prediction by taking into account Google trend data. Experiment results reveal that Google trends can be efficiently used for predicting the trend in stock market index. Senapati et al. [65] presented an intelligent hybrid model for forecasting stock price by applying adaline neural network and modified particle swarm optimization. In this article, PSO is employed to obtain the optimized weights of adaline neural network. The performance of proposed model has been compared with other hybrid model such as Bayesian-ANN, interval measurement and chaotic multi swarm particle swarm optimization (CMS-PSO). Results from the study show the superiority of proposed model. Chiang et al. [85] developed an adaptive stock index trading decision support paradigm which integrates the particle swam optimization (PSO) with artificial neural network for forecasting the direction of stock index movement. This model is used to fit stock price time series of several stocks instead of specific stock by adapting both the inputs and the prediction model. Simulation results show that traders can generate higher profits using proposed decision support system. Rout et al. [71] adopted various evolutionary optimization techniques like particle swarm optimization (PSO), differential evolution (DE) and hybrid moderate random search based PSO (HMRPSO) to optimize weight of different variants of functional link artificial neural network (FLANN) such as computationally efficient FLANN (CEFLANN) and its recurrent version computationally efficient recurrent FLANN (RCEFLANN) for predicting the stock market indices over the course of different time span ranging from 1 to 30 days ahead. In this article, authors have compared the performance of several FLANN trained with various evolutionary learning techniques and show that recurrent FLANN trained with DE provide better accuracy with respect to other FLANN approaches. Nayak et al. [91] presented an artificial chemical reaction neural network (ACRNN) which uses a population based metaheuristic optimization technique namely artificial chemical reaction optimization (ACRO) for training the multi-layer perceptron (MLP) model to forecast the stock indices of seven fast growing stock markets for short term, medium term and long term. ACRO has the power to handle the problem of overfitting, convergence and parameter optimization. Pradeepkumar et al. [72] proposed a novel approach namely particle swarm optimization trained quantile regression neural network (PSOQRNN) to predict volatility in financial time series and compared it with conventional volatility forecasting models viz. generalized autoregressive conditional heteroskedasticity (GARCH), general regression neural network (GRNN), random forest (RF) multi-layer perceptron (MLP), group method of data handling (GMDH) and two quantile regression (QR) based hybrid model i.e. quantile regression neural network (QRNN) and quantile regression random forest (QRFF). PSO is used to obtain optimal weight and bias of QRNN. The mean square error calculated from the result depicts that proposed PSOQRNN outperformed other models. Xiong et al. [92] developed a forecasting model by combining the fully complex-valued radial basis function neural networks (FCRBFNNs) and two evolutionary computation methods namely PSO and discrete PSO (DPSO) for interval forecasting of time series. In this article, daily high price and low price of shares has been used to obtain the interval and then lower and upper bound of interval represent the real and imaginary part of complex number to form a complex-valued interval which is modeled by FCRBFNN. To enhance the accuracy of FCRBFNN, the network topology and parameters are simultaneously optimized by the PSO and DPSO. Yang et al. [104] presented a novel hybrid stock selection method composed of two main steps: stock prediction and stock scoring. In the first step, stock returns for the next time period are predicted by using emerging computational intelligence technique namely extreme learning machine (ELM) that is special class of single-hidden layer feedforward neural networks (SLFNs) based on random generation of hidden neurons to resolve the local optima problem in iterative learning process. In the second step, predicted returns in the previous step and various fundamental factors are collectively used to formulate a linear weighted stock scoring mechanism to assess the value of each stock and finally, highly valued stocks are chosen to frame an equally weighted portfolio as the final output of proposed model. In the stock scoring mechanism the weight terms of linear model are optimized by utilizing a population based heuristic optimization technique viz. differential evolution (DE). Shah et al. [130] presented a Quick Gbest Guided artificial bee colony (QGGABC) optimization algorithm for tuning the parameters of feedforward neural network (FFNN) model to predict the trends in the stock market. In this work, the proposed model is based on bio-inspired learning algorithm viz. artificial bee colony (ABC) which is extended by authors in this work using various strategies such as global best process of particle swarm optimization (PSO) i.e. gbest guided ABC and simulating the intelligent foraging behavior of honey bee to give quick ABC to develop QGGABC learning algorithm.
4.5.4.2 Hybrid Genetic Algorithm (GA)
In this section we have discussed the articles that focus on hybrid GA. Khan and sahai [159] have used three population based stochastic optimization techniques such as bat algorithm (BA), Genetic algorithm (GA), Particle swarm optimization (PSO) and two gradient based algorithm viz. Back propagation (BP) and Levenberg–Marquardt (LM) algorithm for training feedforward neural network and showed that BA performs better than others optimization techniques. Hasan et al. [160] proposed a hybrid model by combining Hidden Markov Model (HMM), Genetic Algorithm (GA) and Artificial Neural Network (ANN) for forecasting stock market behavior. GA is utilized to tune the initial parameters of HMM and ANN and they showed the advantages of hybrid model over individual models. Ferreira et al. [161] build a hybrid intelligent model by combining standard neural network with modified genetic algorithm to deal with stock price time series forecasting problem. The proposed model efficiently searches for minimum time-lag of time series sufficient to solve forecasting problem, best neural network configuration and best training algorithms. Hadavandi et al. [97] developed an evolutionary neural network incorporating genetic algorithm with feed forward neural network for stock exchange forecasting. Experiment results demonstrate that proposed hybrid paradigm is able to deal with fluctuation of stock price time series and is efficient to predict the TEPIX stock index. Hsu [114] proposed a hybrid model by integrating self-organized map (SOM) neural network and genetic programming (GP) to forecast stock price. The SOM neural network is applied to generate clusters of input data and GP is utilized to predict the closing price of each cluster. Qiu and Song [55] build a hybrid model GA-BPNN by applying GA to obtain optimized parameters for BPNN for prediction of Japanese Nikkei 225 index. Qiu et al. [56] developed a hybrid technique which is based on two global search approaches i.e. genetic algorithm (GA) and simulated annealing (SA) to increase the prediction accuracy of BPNN for predicting the return of Japanese Nikkei 225 index. In this study, authors have introduced new set of input variables for improving accuracy of proposed model. Inthachot et al. [107] combined the intelligence of ANN and GA for trend prediction of Thailand’s SET50 stock index. In this article, they have used GA as feature selection techniques for determining the effective subset of features. Gocken et al. [108] examined the underlying correlation between technical indicators and stock market by proposing a hybrid model which combines capabilities of harmony search (HS) and genetic algorithm (GA) with artificial neural network (ANN). In the proposed model, they used the HS and GA for extracting the relevant technical indicators which serve as input for ANN and for tuning the parameters of ANN. Experiments result reveals that HS based ANN model outperforms GS based ANN model for forecasting Turkish stock market. Rather et al. [67] created a hybrid model composed of two linear models viz. autoregressive moving average (ARMA) model and exponential smoothing (ES) and one non-linear model namely recurrent neural network (RNN). In this study, proposed hybrid model combines the prediction results from these three prediction model to generate output and used genetic algorithm (GA) to obtain the optimal weights of hybrid model. Prediction results reveal that proposed hybrid model outperforms the recurrent neural network. Ghasemieh et al. [99] proposed a hybrid artificial neural network based on metaheuristic optimization algorithms namely cuckoo search (CS), improved cuckoo search (ICS), genetic algorithm (GA), improved cuckoo search genetic algorithm (ICSGA) and particle swarm optimization to predict stock indices and performed comparative study of different hybrid model. Simulation results reveal that PSO has high performance as compared to other model and can be used efficiently for stock price prediction. Inthachot et al. [107] proposed hybrid intelligence approach by the use of artificial neural network and genetic algorithm to predict trend in Thailand stock market index. This study have applied 11 technical indicators to compute 44 input features on the basis of different time span viz. 3, 5, 10 and 15 days. In this article, genetic algorithm is used to choose the effective subset of input variables for artificial neural network to enhance the prediction accuracy. Ahmadi et al. [162] proposed two hybrid models for forecasting stock market trading signals on the basis of Japanese candlestick technical analysis by employing support vector machine (SVM) and two heuristic optimization algorithms viz. imperialist competition algorithm (ICA) and genetic algorithm (GA). In the first hybrid model, SVM and ICA are combined to build hybrid model in which ICA is applied to obtain the optimized parameters of SVM. In the second hybrid model, SVM and GA are integrated where GA is utilized for selecting effective features as well as for optimizing SVM parameters. Here the input data to proposed model are generated on the basis of raw-based approach which focuses on raw input data of Japanese candlestick comprising of open, close, low and high prices of share and Signal-based approaches where focus is on Japanese candlestick’s reversal signals like Harami, Morning star, Inverted hammer and many others. Results showed that SVM-ICA outperforms SVM-GA. Chung and Shin [110] proposed the application of genetic algorithm (GA) to determine the best network topology and time window size of long short term memory (LSTM) network to enhance the forecasting accuracy of stock market forecasting model. GA is used to optimize various parameters of LSTM network like number of hidden layer, number of neuron per hidden layer, number of time lags and others. Since the learning capability of LSTM is dependent on past information so it is important to choose the optimal time window in this work.
4.5.4.3 Hybrid Fuzzy Logic
In this section we have presented articles that combined fuzzy logic with other models to create hybrid approach. Mustafa et al. [98] proposed a hybrid approach by assembling fuzzy C-means (FCM), artificial neural network (ANN) and data envelopment analysis (DEA) for forecasting the financial performance of various corporations in Tehran stock market when data are collected at different intervals of time. In this article, FCM is applied for clustering homogeneous data using fuzzy logic to generate dynamic clusters. After that DEA is utilized to evaluate efficiency of each cluster members by computing weighted output to weighted input ratio and then neural network is trained for predicting future performance of companies. Yolcu and Lam [62] introduced a robust fuzzy time series prediction model which is based on integration of single multiplicative neuron model (SMNN), particle swarm optimization (PSO) and M-estimators to improve the prediction accuracy of stock price time series affected by outliers. This model does not require defuzzification as input is composed of both crisp values and membership values and training of SMNN is performed by PSO. Chang et al. [89] developed a novel hybrid method by aggregating Takagi–Sugeno (TS) fuzzy rule based technique with support vector regression (SVR) technique for identifying turning points of trading signal in US stock market data. SVR is used to determine the trading signals from the technical indicators and TS fuzzy rule based model is used to accurately identify right time to trade stocks by determining the turning point in stock market data. In this article, to illustrate the excellence of proposed model, results are compared with traditional linear regression and artificial neural networks. Yolcu and Alpaslan [119] created a hybrid fuzzy time series approach by combining the capability of fuzzy c-means clustering (FCM), single multiplicative neuron model (SMNM) and particle swarm optimization (PSO) to predict the Taiwan stock market index. In general, fuzzy time series prediction model is composed of three separate processes: fuzzification, identification of fuzzy relations and defuzzification and total error in the model is the sum of errors arise in each steps. The main focus of this article is to reduce the model error by constituting the solution process of fuzzy time series model in single optimization process concurrently. In this paper, FCM approach is utilized for fuzzification and SMNM model is applied to identify fuzzy relation and there is no defuzzification step as proposed model produced output as real observation of time series. Moreover, the relevant parameters of FCM and SMNM are determined by PSO. Cai et al. [117] developed a hybrid approach by integrating fuzzy time series (FTS) and genetic algorithm (GA) to forecast stock market. Genetic algorithms operations such as selection, crossover and mutation are employed to obtain accurate partition of universe. Experiments result of proposed model has been compared with three conventional fuzzy time series model. Pal and Kar [73] proposed the use of double genetic algorithms: GA1 and GA2 with fuzzy time series forecasting system. GA1 is applied for effective partitioning of fuzzy time series to determine the unequal intervals as forecasting accuracy is always affected by the length of interval and GA2 is employed to tune the parameters of fuzzy logic relationship model and establishing the relationship among consecutive data points to build stock price time series forecasting model. Tan et al. [102] created a hybrid model by using adaptive network based fuzzy inference system (ANFIS) and a swarm intelligence optimization technique namely fruit fly optimization algorithm (FOA) to predict stock market volatility. FOA is implemented in ANFIS for adaptively changing the inference rules in fuzzy system. Results from comparison of proposed model with conventional ANFIS reveals that proposed model can be successfully applied to forecast stock market volatility. Rajab and Sharma [74] presented an interpretable neuro-fuzzy approach based on Pearson’s correlation coefficient, subtractive clustering, constrained optimization and rule base reduction techniques to predict stock price with an aim to deal with interpretable-accuracy trade-off. The interpretability of proposed model is ensured by compact rule base and optimal fuzzy set parameters in proposed forecasting model. In this work, firstly Pearson’s correlation coefficient is employed to select the effective technical indicators, secondly generated the rule base of neuro-fuzzy system using subtractive clustering and then selected the best fuzzy rules to generate compact rule base on the basis of high rule performance and finally to ensure high performance and highly interpretable rule base of proposed model utilized constrained learning algorithm to achieve the best parameters of neuro-fuzzy model. Simulation results from comparison reveal that proposed model provide better balance between interpretability and accuracy with respect to adaptive neuro-fuzzy inference system (ANFIS), ANN, generalized autoregressive conditional heteroscedasticity (GARCH) and multiple regression analysis (MRA).
4.5.4.4 Other Evolutionary Hybrid Models
In this section we have presented the papers that are based on hybridization of evolutionary computing techniques. Brasileiro et al. [96] developed a hybrid intelligent system by combining a nature inspired optimization technique namely artificial bee colony (ABC) with K-nearest neighbor (KNN) algorithm and its variant called Adaptative Classification and Nearest Neighbor (A-k-NN). The classification algorithms are applied to determine the right time to buy or sell shares. ABC has been applied to optimize the parameter of KNN classifier and to choose to best lime lag. Kazem et al. [82] developed a model that is based on chaotic mapping, support vector regression (SVR) and firefly algorithm to predict share prices. In this article, the proposed model works in three phases. In the initial phase, they used the delay coordinate embedding technique to restore unseen phase dynamics. In the second phase, to optimize the SVR hyper-parameters, a chaotic firefly algorithm has been utilized. In the final stage, optimized model is used to predict the stock price. Authors show the superiority of proposed model, by comparing it with genetic algorithm (GA) based SVR (SVR–GA), firefly based SVR (SVR–FA), chaotic GA based SVR (SVR–CGA), ANNs and adaptive neuro-fuzzy inference systems (ANFIS). Zhang et al. [129] built a hybrid technique based on support vector regression (SVR) and modified firefly algorithm (MFA) to solve stock market forecasting problem. In this article, authors have performed the research work in two stages. In the first stage, a modified FA has been developed to enhance the performance of the FA. In the second stage, MFA is combined with SVR to create a hybrid model in which MFA is used to optimize the hyper-parameters if SVR for stock price prediction. Finally, comparison is performed with other model to demonstrate the advantages of proposed model.
Through this survey, it is observed that CI approaches can be efficiently used for stock market forecasting problem. Based on this survey, Fig. 10 depicts the frequency of CI approaches used for forecasting the stock market index of major stock exchanges of world.

Core CI approaches frequencies for forecasting major stock exchanges
In the world topmost and second biggest stock exchanges such as New York stock exchange (NYSE) and NASDAQ and world tenth and eleventh major stock exchanges viz. Bombay stock exchange (BSE) and National stock exchange (NSE), it has been observed that hybrid CI approaches are most widely used. In the third and fourth largest stock exchanges of world such as Tokyo stock exchange and Shanghai stock exchange, artificial neural networks (ANNs) are most frequently applied techniques for forecasting share market indices.
4.6 Performance Evaluation
In this section we have presented various performance metrics that have been utilized to measure the performance of the model proposed in surveyed literature. To assess the performance and robustness of the model, evaluation metrics to be used depend upon the type of problem being modeled i.e. whether to model classification problem or regression problem. In stock market trend (up/bearish or down/bullish) forecasting problems precision, recall and F-score [68] which are computed from confusion matrix are utilized to evaluate the accuracy of classification model and joint prediction error (JPE) [48] statistic is used to perform comparison of different models. In stock index or price prediction problems performance of prediction model is obtained by evaluating the extent of closeness between actual value and predicted value and different prediction models are compared by using U of Theil coefficient (TheilU) [95] and average relative variance (ARV) metrics [161]. Several metrics used in the surveyed articles for measuring closeness are presented in this article. Figure 11 shows the taxonomy of most frequently used evaluation metrics. Reza et al. [47], Esfahanipour and Aghamiri [53] and Liu and Wang [77] have used mean absolute percentage error (MAPE) to evaluate and compare the model’s performance with other models. Root mean square error (RMSE), directional accuracy (DA) and MAPE have been used by Lu [50] for assessing the performance of proposed model. Thakur et al. [48] have used recall and F-score that are calculated from confusion matrix to judge the performance of classification model. For comparing the result among different stock indexes, a new performance measure called joint prediction error (JPE) is presented by authors in this study. Patel et al. [63] have evaluated the performance of proposed fusion techniques using MAPE, RMSE, mean absolute error (MAE) and mean squared error (MSE). de Oliveira et al. [95] used the prediction of change in direction (POCID) which gives the percentage of correct predictions of price series direction, MAPE, RMSE and THEIL coefficient (Theil’ U) for measuring the performance of model. Asadi et al. [51] and Ferreira et al. [161] have used four evaluation metrics such as MAPE, POCID, Theil’s U coefficient and ARV metric for computing the prediction capability of proposed model and comparing the accuracy of the model with other models. Dai et al. [54] and Feng and Chou [113] evaluated the accuracy of proposed model using metrics such as RMSE, MAPE, mean absolute difference (MAD), directional symmetry (DS) and root mean square percentage error (RMSPE). Hongping et al. [81], Qiu and Song [55] and Ahmadi et al. [162] used hit ratio to gauze the performance of model. Hit ratio is defined as percentage of trials when the forecasted trend (up-ward or down-ward) is same as actual trend [81]. Qiu et al. [56] and Mustafa et al. [98] have utilized RMSE and MSE to compute the performance of proposed model. Kazem et al. [82] and Senapati et al. [65] employed MSE and MAPE to analyze and compare the performance of prediction model. Gocken et al. [108] evaluated the performance of proposed model by using 9 loss functions namely MAE, MAPE, RMSE, MSE, mean absolute relative error (MARE), mean square relative error (MSRE), root mean square relative error (RMSRE), mean square percentage error (MSPE) and RMSPE. Rather et al. [67] used average MSE (A-MSE) and average MAE (A-MAE) to judge the performance of proposed hybrid model for multiple stocks of Indian stock market. Patel et al. [68] assessed the forecasting accuracy of proposed model using accuracy and F-score metrics. The accuracy and F-score metrics are computing by using precision and recall that are determined from true positive (TP), false positive (FP), true negative (TN) and false negative (FN) of confusion matrix. Zarandi et al. [136], Liu et al. [57], Yolcu and Lam [62], Sadaei et al. [87], Jiang et al. [88], Cai et al. [117] and Yolcu and Alpaslan [119] utilized RMSE to judge the performance of model. Fazel et al. [123] applied MAPE to determine the prediction accuracy of the proposed system. Svalina et al. [111] have employed average relative error (AvRE) and average coefficient of variation (AvCE) of RMSE for evaluating the performance of the forecasting model. Wang et al. [100], Dash and Dash et al. [69], Seo et al. [93], Laboissiere et al. [125], Weng et al. [127], Zhang et al. [129], Chung and Shin [110] and Zhou et al. [94] used RMSE, MAPE and MAE to analyze and compare the accuracy of proposed model for predicting stock price with other prediction algorithms. Werner and Marcel [120] and Pal and Kar [73] evaluated the accuracy of forecasting model by using MSE as loss function. Sheta et al. [86] and Ghasemieh et al. [99] assessed the performance of stock market prediction model by using MAE, RMSE and correlation coefficient (R) which gives the strength and direction of association between dependent and independent variables. Su and Cheng [116] used Theil’s U coefficient and RMSE statistic to measure the accuracy of model. Pang et al. [101] estimated the accuracy of model by utilizing MSE and DA. Zang et al. [118] applied MAD, MAPE, Symmetric MAPE (SMAPE) and NRMSE to determine the accuracy and prediction capability of the proposed approach. Inthachot et al. [107] used the accuracy value to measure the performance of hybrid system. Rout et al. [71] make use of RMSE and MAPE in order to perform the comparison of the performance of different models. Mo et al. [103] evaluated the prediction performance of proposed method by using RMSE, MAE, MAPE and correlation coefficient (R). Nayak et al. [91] utilized accuracy and POCID metrics to assess and compare the performance of proposed model. Pradeepkumar and Ravi [72] make use of MSE, Theil’s U coefficient and directional change statistic (Dstat) to compute the performance of proposed model. Xiong et al. [92] have utilized average relative variance (ARV) metrics to compare the predictive capability of various models on different datasets. Wang and Wang [49] and Lei [59] analyzed the performance of the prediction technique by utilizing RMSE, MAPE, MAE, DS and two more trend type performance metrics namely correct up-trend (CP) and correct down-trend (CD) which provides the percentage of correctness of forecasted upward and downward trend in stock market indices. Cheng and Yang [58] evaluated the accuracy of proposed model on the basis of root relative squared error (RRSE), RMSE and relative absolute error (RAE). Ahmadi et al. [162] considered hit rate which is defined as percentage of accurate prediction for given period. Gocken et al. [128] performed the comparison of the performance of different models using five metrics viz. RMSE, MAE, MAPE, TheilU and DS. Yang et al. [104] make use of RMSE, MAPE for level accuracy and Dstat is used for directional accuracy. Pimenta et al. [126] compared different trading system on the basis of financial return on investment (ROI) obtained by applying different methods. Rajab and Sharma [74] measured the forecasting accuracy of proposed model using RMSE, MAPE and DA. Shah et al. [130] evaluated the performance of proposed approach by MSE, standard deviation of MSE, NMSE, success rate and accuracy. Chander [131] assessed and compared the accuracy of prediction models by RMSE, MAPE, average absolute error (AAE), coefficient of variation (CoV) and coefficient of multiple determinations (R2).

Taxonomy of performance metrics
5 Proposed Work
Hybrid models for prediction of stock market are prominent and more accurate than traditional approaches. We aim to develop a hybrid evolutionary model using computationally intelligence based techniques to achieve accurate stock market predictions. The basic steps in working of proposed hybrid approach have been depicted in Fig. 12 According to literature surveyed; technical indicators have shown outstanding result for prediction of stock market. In the future work, we have proposed to use technical indicators to construct a feature vector for stock market prediction. The various stages of proposed work are mention below:

Working of proposed system
-
1.
Obtaining the historical stock market data.
-
2.
Computing the technical indicators using real stock market data such as open price, close price, low price, high price and volume of share traded.
-
3.
Pre-processing the dataset to normalize the data in the range [0 1].
-
4.
Apply feature extraction techniques to determine the technical indicators that have most influence on stock price and hence reducing the dimensionality.
-
5.
Developing a hybrid forecasting model to forecast stock market by utilizing artificial neural network (ANN).
-
6.
Apply evolutionary optimization technique to tune the parameters of proposed model for improving accuracy.
-
7.
Evaluating the prediction capability of proposed model using various performance metrics.
-
8.
Presenting the trading signal or stock price predicted value.
6 Conclusion
In this article, we aimed to survey the important and up-to-date contributions in the domain of computational intelligence to solve stock market forecasting problem. The capability of computational intelligence approaches to realize the artificial intelligence by imitating the thinking power of human have been investigated to forecast the stock market in this work. This paper have investigated and discussed the articles that deal with preprocessing, dimensionality reduction and forecasting future trend or predicting future stock prices. Through this survey, it has been observed that CI approaches have shown promising result in the area of stock market. The first major contribution of this paper is to assist the researcher and financial analyst to build a systematic approach for development of intelligent methodology to forecast stock market. The second key focus of this study is discussion about the basic terminologies of stock market and computational intelligence approaches. The third contribution of this survey is to present the sources of data to obtain the historical stock market data of several international and national stock markets. To the best of our knowledge this is first survey that has presented the sources of data in stock market domain. In our study, the major findings are: (1) technical indicators play a prominent role in stock market forecasting. Hence identification of suitable set of technical indicators is still an open problem (2) identification of suitable pre-processing and feature selection techniques helps in improving the accuracy of stock market forecasting models (3) computational intelligence approaches can be effectively used to solve stock market forecasting problem with high accuracy. Among them hybrid models are predominant techniques applied to forecast stock market due to combined prediction capability of base models (4) performance metrics are not unique and different authors have used different combination of metrics.
References
Lin CS, Chiu SH, Lin TY (2012) Empirical mode decomposition-based least squares support vector regression for foreign exchange rate forecasting. Econ Model 29(6):2583–2590
Tay FE, Cao L (2001) Application of support vector machines in financial time series forecasting. Omega 29(4):309–317
Lam M (2004) Neural network techniques for financial performance prediction: integrating fundamental and technical analysis. Decis Support Syst 37(4):567–581
Murphy JJ (1999) Technical analysis of the financial markets. New York Institute of Finance, New York
Miao K, Chen F, Zhao ZG (2007) Stock price forecast based on bacterial colony RBF neural network. J Qingdao Univ (Nat Sci Ed) 2(11):2–11
Nassirtoussi AK, Wah TY, Ling DNC (2011) A novel FOREX prediction methodology based on fundamental data. Afr J Bus Manag 5(20):8322–8330
Haleh H, Moghaddam BA, Ebrahimijam S (2011) A new approach to forecasting stock price with EKF data fusion. Int J Trade Econ Finance 2(2):109–114
Wang JZ, Wang JJ, Zhang ZG, Guo SP (2011) Forecasting stock indices with back propagation neural network. Expert Syst Appl 38(11):14346–14355
Box GE, Jenkins GM, Reinsel GC, Ljung GM (2015) Time series analysis: forecasting and control. Wiley, New York
Kumar D, Murugan S (2013) Performance analysis of Indian stock market index using neural network time series model. In: International conference on pattern recognition, informatics and mobile engineering. IEEE, pp 72–78
Si YW, Yin J (2013) OBST-based segmentation approach to financial time series. Eng Appl Artif Intell 26(10):2581–2596
Adebiyi AA, Ayo CK, Adebiyi MO, Otokiti SO (2012) Stock price prediction using neural network with hybridized market indicators. J Emerg Trends Comput Inf Sci 3(1):1–9
Cortes C, Vapnik V (1995) Support-vector networks. Mach Learn 20(3):273–297
Bone R, Crucianu M (2002) Multi-step-ahead prediction with neural networks: a review. 9emes rencontres internationales: Approches Connexionnistes en Sciences 2:97–106
Atsalakis S, Valavanis KP (2009) Surveying stock market forecasting techniques—part II: soft computing methods. Expert Syst Appl 36(3):5932–5941
Cavalcante RC, Brasileiro RC, Souza VL, Nobrega JP, Oliveira AL (2016) Computational intelligence and financial markets: a survey and future directions. Expert Syst Appl 55:194–211
Nikfarjam A, Emadzadeh E, Muthaiyah S (2010) Text mining approaches for stock market prediction. In: International conference on computer and automation engineering. IEEE, pp 256–260
Li Y, Ma W (2010) Applications of artificial neural networks in financial economics: a survey. In: International symposium on computational intelligence and design. IEEE, pp 211–214
Rivera RA, Rendón MV, Ortiz JR (2015) Genetic algorithms and Darwinian approaches in financial applications: a survey. Expert Syst Appl 42(21):7684–7697
Agrawal JG, Chourasia VS, Mittra AK (2013) State-of-the-art in stock prediction techniques. Int J Adv Res Electr Electron Instrum Eng 2(4):1360–1366
Kumar BS, Ravi V (2016) A survey of the applications of text mining in financial domain. Knowl Based Syst 114:128–147
Soni S (2011) Applications of ANNs in stock market prediction: a survey. Int J Comput Sci Eng Technol 2(3):71–83
Border J, Evan JH (2014) Stock market for beginners. CreateSpace Independent Publishing Platform, Scotts Valley
Setty DV, Rangaswamy TM, Subramanya KN (2010) A review on data mining applications to the performance of stock marketing. Int J Comput Appl 1(3):24–34
Sarwar G (2012) Is VIX an investor fear gauge in BRIC equity markets? J Multinatl Finance Manag 22(3):55–65
Chandra A, Thenmozhi M (2015) On asymmetric relationship of India volatility index (India VIX) with stock market return and risk management. Decision 42(1):33–55
Brockwell PJ, Davis RA, Calder MV (2002) Introduction to time series and forecasting. Springer, Berlin
Metcalfe AV, Cowpertwait PS (2009) Introductory time series with R. Springer, Berlin, pp 2–5
Leigh W, Purvis R, Ragusa JM (2002) Forecasting the NYSE composite index with technical analysis, pattern recognizer, neural network, and genetic algorithm: a case study in romantic decision support. Decis Support Syst 32(4):361–377
Tsinaslanidis PE, Kugiumtzis D (2014) A prediction scheme using perceptually important points and dynamic time warping. Expert Syst Appl 41(6):848–860
Ibrahim D (2016) An overview of soft computing. Procedia Comput Sci 102:34–38
Karray O, Silva CD (2004) Soft computing and intelligent systems design: theory, tools, and applications. Pearson Education, London
Pedrycz W (1990) Fuzzy sets in pattern recognition: methodology and methods. Pattern Recognit 23(1):121–146
Yuhas B, Ansari N (2012) Neural networks in telecommunications. Springer, Berlin
Dote Y, Hoft RG (1998) Intelligent control: power electronic systems. Oxford University Press, Oxford
Komori YA (1992) Neural fuzzy training approach for continue speech recognition improvement. In: Proceeding IEEE international conference on acoustics, speech, and signal processing, vol 1, pp 405–408
Cichocki A, Unbehauen R (1993) Neural networks for optimization and signal processing. Wiley, Hoboken
Roy R, Furuhashi T, Chawdhry PK (1998) Advances in soft computing: engineering design and manufacture. Springer, Berlin
Haykin S (1999) Neural network: a comprehensive foundation. Prentice Hall, Upper Saddle River
Goh AT (1995) Back-propagation neural networks for modeling complex systems. Artif Intell Eng 9(3):143–151
Saerens M (2002) Neural controller based on back-propagation algorithm. IEE Proc Radar Signal Process 138(1):55–62
Zadeh LA (1994) Fuzzy logic, neural networks, and soft computing. Commun ACM 37(3):77–84
Holland JH (1992) Adaptation in natural and artificial systems: an introductory analysis with applications to biology, control, and artificial intelligence. MIT Press, Cambridge
Coley DA (2003) An introduction to genetic algorithms for scientists and engineers. World Scientific Publishing Co, Singapore
Reza H, Shahrabi J, Hadavandi E (2015) A bat-neural network multi-agent system (BNNMAS) for stock price prediction: case study of DAX stock price. Appl Soft Comput 29:196–210
Kumar D, Meghwani SS, Thakur M (2016) Proximal support vector machine based hybrid prediction models for trend forecasting in financial markets. J Comput Sci 17:1–13
Wang J, Wang J (2017) Forecasting stochastic neural network based on financial empirical mode decomposition. Neural Netw 90:8–20
Lu CJ (2010) Integrating independent component analysis-based denoising scheme with neural network for stock price prediction. Expert Syst Appl 37(10):7056–7064
Asadi S, Hadavandi E, Mehmanpazir F, Nakhostin MM (2012) Hybridization of evolutionary Levenberg–Marquardt neural networks and data pre-processing for stock market prediction. Knowl Based Syst 35:245–258
Chang PC, Liu CH (2008) A TSK type fuzzy rule based system for stock price prediction. Expert Syst Appl 34(1):135–144
Esfahanipour A, Aghamiri W (2010) Adapted neuro-fuzzy inference system on indirect approach TSK fuzzy rule base for stock market analysis. Expert Syst Appl 37(7):4742–4748
Dai W, Wu JY, Lu CJ (2012) Combining nonlinear independent component analysis and neural network for the prediction of Asian stock market indexes. Expert Syst Appl 39(4):4444–4452
Qiu MY, Song Y (2016) Predicting the direction of stock market index movement using an optimized artificial neural network model. PLoS ONE 11(5):1–11
Qiu MY, Song Y, Akagi F (2016) Application of artificial neural network for the prediction of stock market returns: the case of the Japanese stock market. Chaos Solitons Fractals 85:1–7
Liu CF, Yeh CY, Lee SJ (2012) Application of type-2 neuro-fuzzy modeling in stock price prediction. Appl Soft Comput 12(4):1348–1358
Cheng CH, Yang JH (2018) Fuzzy time-series model based on rough set rule induction for forecasting stock price. Neurocomputing 302:33–45
Lei L (2018) Wavelet neural network prediction method of stock price trend based on rough set attribute reduction. Appl Soft Comput 62:923–932
Kara Y, Boyacioglu MA, Baykan OK (2011) Predicting direction of stock price index movement using artificial neural networks and support vector machines: the sample of the Istanbul Stock Exchange. Expert Syst Appl 38(5):5311–5319
Boyacioglu MA, Avci D (2010) An adaptive network-based fuzzy inference system (ANFIS) for the prediction of stock market return: the case of the Istanbul stock exchange. Expert Syst Appl 37(12):7908–7912
Yolcu OC, Lam HK (2017) A combined robust fuzzy time series method for prediction of time series. Neurocomputing 247:87–101
Patel J, Shah S, Thakkar P, Kotecha K (2015) Predicting stock market index using fusion of machine learning techniques. Expert Syst Appl 42(4):2162–2172
Pathak A, Shetty NP (2019) Indian stock market prediction using machine learning and sentiment analysis. Comput Intell Data Min 711:595–603
Senapati MR, Das S, Mishra S (2018) A novel model for stock price prediction using hybrid neural network. J Inst Eng (India) Ser B 99(6):555–563
Chopra S, Yadav D, Chopra AN (2019) Artificial neural networks based indian stock market price prediction: before and after demonetization. Int J Swarm Intell Evol Comput 8(174):1–7
Rather AM, Agarwal A, Sastry VN (2015) Recurrent neural network and a hybrid model for prediction of stock returns. Expert Syst Appl 42(6):3234–3241
Patel J, Shah S, Thakkar P, Kotecha K (2015) Predicting stock and stock price index movement using trend deterministic data preparation and machine learning techniques. Expert Syst Appl 42(1):259–268
Dash R, Dash P (2016) Efficient stock price prediction using a self evolving recurrent neuro-fuzzy inference system optimized through a modified differential harmony search technique. Expert Syst Appl 52:75–90
Dash R, Dash PK (2016) A hybrid stock trading framework integrating technical analysis with machine learning techniques. J Finance Data Sci 2(1):42–57
Rout AK, Dash PK, Dash R, Bisoi R (2017) Forecasting financial time series using a low complexity recurrent neural network and evolutionary learning approach. J King Saud Univ Comput Inf Sci 29(4):536–552
Pradeepkumar D, Ravi V (2017) Forecasting financial time series volatility using particle swarm optimization trained quantile regression neural network. Appl Soft Comput 58:35–52
Pal SS, Kar S (2019) Fuzzy time series model for unequal interval length using genetic algorithm. In: Information technology and applied mathematics, vol 699. Springer, pp 205–216
Rajab S, Sharma V (2019) An interpretable neuro-fuzzy approach to stock price forecasting. Soft Comput 23(3):921–936
Niall O, Madden MG (2006) A neural network approach to predicting stock exchange movements using external factors. Knowl Based Syst 19:371–378
Wang J, Wang J (2015) Forecasting stock market indexes using principle component analysis and stochastic time effective neural networks. Neurocomputing 156:68–78
Liu F, Wang J (2012) Fluctuation predictions of stock market index by Legendre neural network with random time strength function. Neurocomputing 83:12–21
Chien YWC, Chen YL (2010) Mining associative classification rules with stock trading data-A GA-based method. Knowl Based Syst 23:605–614
Zhang Y, Wu L (2009) Stock market prediction of S&P 500 via combination of improved BCO approach and BP neural network. Expert Syst Appl 36:8849–8854
Niaki STA, Hoseinzade S (2013) Forecasting S&P 500 index using artificial neural networks and design of experiments. J Ind Eng Int 9(1):1–9
Hu H, Tang L, Zhang S, Wang H (2018) Predicting the direction of stock markets using optimized neural networks with Google Trends. Neurocomputing 285:188–195
Kazem A, Sharifi E, Hussain FK, Saberi M, Hussain OK (2013) Support vector regression with chaos-based firefly algorithm for stock market price forecasting. Appl Soft Comput 13(2):947–958
Chien YWC, Chen YL (2010) Mining associative classification rules with stock trading data-A GA-based method. Knowl Based Syst 23(6):605–614
Zhong X, Enke D (2017) Forecasting daily stock market return using dimensionality reduction. Expert Syst Appl 67:126–139
Chiang WC, Enke D, Wu T, Wang R (2016) An adaptive stock index trading decision support system. Expert Syst Appl 59:195–207
Sheta AF, Ahmed SEM, Faris H (2015) A comparison between regression, artificial neural networks and support vector machines for predicting stock market index. Soft Comput 7:8
Sadaei HJ, Enayatifar R, Lee MH, Mahmud M (2016) A hybrid model based on differential fuzzy logic relationships and imperialist competitive algorithm for stock market forecasting. Appl Soft Comput 40:132–149
Jiang JA, Syue CH, Wang CH, Wang JC, Shieh JS (2018) An interval type-2 fuzzy logic system for stock index forecasting based on fuzzy time series and a fuzzy logical relationship map. IEEE Access 6:69107–69119
Chang PC, Wu JL, Lin JJ (2016) A Takagi-Sugeno fuzzy model combined with a support vector regression for stock trading forecasting. Appl Soft Comput 38:831–842
Fischer T, Krauss C (2018) Deep learning with long short-term memory networks for financial market predictions. Eur J Oper Res 270(2):654–669
Nayak SC, Misra BB, Behera HS (2017) Artificial chemical reaction optimization of neural networks for efficient prediction of stock market indices. Ain Shams Eng J 8(3):371–390
Xiong T, Bao Y, Hu Z, Chiong R (2015) Forecasting interval time series using a fully complex-valued RBF neural network with DPSO and PSO algorithms. Inf Sci 305:77–92
Seo M, Lee S, Kim G (2019) Forecasting the volatility of stock market index using the hybrid models with google domestic trends. Fluct Noise Lett 18(01):1950006, 1–17
Zhou F, Zhou HM, Yang Z, Yang L (2019) A strategy combining empirical mode decomposition and factorization machine based neural network for stock market trend prediction. Expert Syst Appl 115:136–151
de Oliveira FA, Nobre CN, Zarate LE (2013) Applying Artificial Neural Networks to prediction of stock price and improvement of the directional prediction index—case study of PETR4, Petrobras, Brazil. Expert Syst Appl 40(18):596–7606
Brasileiro RC, Souza VL, Fernandes B, Oliveira AL (2013) Automatic method for stock trading combining technical analysis and the Artificial Bee Colony Algorithm. In: IEEE congress on evolutionary computation. IEEE, pp 1810–1817
Hadavandi E, Ghanbari A, Abbasian-Naghneh S (2010) Developing an evolutionary neural network model for stock index forecasting. In: Huang DS, McGinnity M, Heutte L, Zhang XP (eds) Advanced intelligent computing theories and applications. ICIC 2010. Communications in computer and information science, vol 93. Springer, Berlin, pp 407–415
Rezaee MJ, Jozmaleki M, Valipour M (2018) Integrating dynamic fuzzy C-means, data envelopment analysis and artificial neural network to online prediction performance of companies in stock exchange. Phys A 489:78–93
Ghasemiyeh R, Moghdani R, Sana SS (2017) A hybrid artificial neural network with metaheuristic algorithms for predicting stock price. Cybern Syst 48(4):365–392
Wang J, Wang J, Fang W, Niu H (2016) Financial time series prediction using elman recurrent random neural networks. Comput Intell Neurosci 2016:1–14
Pang X, Zhou Y, Wang P, Lin W, Chang V (2018) An innovative neural network approach for stock market prediction. J Supercomput 74:1–21
Tan L, Wang S, Wang K (2017) A new adaptive network-based fuzzy inference system with adaptive adjustment rules for stock market volatility forecasting. Inf Process Lett 127:32–36
Mo H, Wang J, Niu H (2016) Exponent back propagation neural network forecasting for financial cross-correlation relationship. Expert Syst Appl 53:106–116
Yang F, Chen Z, Li J, Tang L (2019) A novel hybrid stock selection method with stock prediction. Appl Soft Comput 80:820–831
Vanstone B, Finnie G, Hahn T (2012) Creating trading systems with fundamental variables and neural networks: the Aby case study. Math Comput Simul 86:78–91
Pulido M, Melin P, Castillo O (2014) Particle swarm optimization of ensemble neural networks with fuzzy aggregation for time series prediction of the Mexican Stock Exchange. Inf Sci 280:188–204
Inthachot M, Boonjing V, Intakosum S (2016) Artificial neural network and genetic algorithm hybrid intelligence for predicting Thai stock price index trend. Comput Intell Neurosci 2016:1–8
Gocken M, Ozcalici M, Boru A, Dosdogru AT (2016) Integrating metaheuristics and artificial neural networks for improved stock price prediction. Expert Syst Appl 44:320–331
Kim Y, Ahn W, Oh KJ, Enke D (2017) An intelligent hybrid trading system for discovering trading rules for the futures market using rough sets and genetic algorithms. Appl Soft Comput 55:127–140
Chung H, Shin KS (2018) Genetic algorithm-optimized long short-term memory network for stock market prediction. Sustainability 10(10):1–18
Svalina I, Galzina V, Lujic R, Simunovic G (2013) An adaptive network-based fuzzy inference system (ANFIS) for the forecasting: the case of close price indices. Expert Syst Appl 40(15):6055–6063
Chourmouziadis K, Chatzoglou PD (2016) An intelligent short term stock trading fuzzy system for assisting investors in portfolio management. Expert Syst Appl 43:298–311
Feng HM, Chou HC (2011) Evolutional RBFNs prediction systems generation in the applications of financial time series data. Expert Syst Appl 38(7):8285–8292
Hsu CM (2011) A hybrid procedure for stock price prediction by integrating self-organizing map and genetic programming. Expert Syst Appl 38(11):14026–14036
Chang YH, Lee MS (2017) Incorporating Markov decision process on genetic algorithms to formulate trading strategies for stock markets. Appl Soft Comput 52:1143–1153
Su CH, Cheng CH (2016) A hybrid fuzzy time series model based on ANFIS and integrated nonlinear feature selection method for forecasting stock. Neurocomputing 205:264–273
Cai Q, Zhang D, Wu B, Leung SC (2013) A novel stock forecasting model based on fuzzy time series and genetic algorithm. Procedia Comput Sci 18:1155–1162
Zhang R, Ashuri B, Deng Y (2017) A novel method for forecasting time series based on fuzzy logic and visibility graph. Adv Data Anal Classif 11(4):759–783
Yolcu OC, Alpaslan F (2018) Prediction of TAIEX based on hybrid fuzzy time series model with single optimization process. Appl Soft Comput 66:18–33
Kristjanpoller W, Minutolo MC (2018) A hybrid volatility forecasting framework integrating GARCH, artificial neural network, technical analysis and principal components analysis. Expert Syst Appl 109:1–11
Ticknor JL (2013) A Bayesian regularized artificial neural network for stock market forecasting. Expert Syst Appl 40(14):5501–5506
Mabu S, Obayashi M, Kuremoto T (2015) Ensemble learning of rule-based evolutionary algorithm using multilayer perceptron for supporting decisions in stock trading problems. Appl Soft Comput 36:357–367
Zarandi MF, Hadavandi E, Turksen IB (2012) A hybrid fuzzy intelligent agent-based system for stock price prediction. Int J Intell Syst 27(11):947–969
Shynkevich Y, McGinnity TM, Coleman SA, Belatreche A, Li Y (2017) Forecasting price movement using technical indicators: investing the impact of varying window length. Neurocomputing 264:71–88
Laboissiere LA, Fernandes RA, Lage GG (2015) Maximum and minimum stock price forecasting of Brazilian power distribution companies based on artificial neural networks. Appl Soft Comput 35:66–74
Pimenta A, Nametala CA, Guimaraes FG, Carrano EG (2018) An automated investing method for stock market based on multiobjective genetic programming. Comput Econ 52(1):125–144
Weng B, Lu L, Wang X, Megahed FM, Martinez W (2018) Predicting short-term stock prices using ensemble methods and online data sources. Expert Syst Appl 112:258–273
Gocken M, Ozcalici M, Boru A, Dosdogru AT (2019) Stock price prediction using hybrid soft computing models incorporating parameter tuning and input variable selection. Neural Comput Appl 31(2):577–592
Zhang J, Teng YF, Chen W (2019) Support vector regression with modified firefly algorithm for stock price forecasting. Appl Intell 49(5):1658–1674
Shah H, Tairan N, Garg H, Ghazali R (2018) A quick gbest guided artificial bee colony algorithm for stock market prices prediction. Symmetry 10(7):1–15
Chandar SK (2019) Fusion model of wavelet transform and adaptive neuro fuzzy inference system for stock market prediction. J Ambient Intell Humaniz Comput 10:1–9
Vanstone B, Finnie G (2009) An empirical methodology for developing stock market trading systems using artificial neural networks. Expert Syst Appl 36(3):6668–6680
Teixeira LA, Oliveira A (2010) A method for automatic stock trading combining technical analysis and nearest neighbor classification. Expert Syst Appl 37(10):6885–6890
Tsinaslanidis PE, Kugiumtzis D (2014) A prediction scheme using perceptually important points and dynamic time warping. Expert Syst Appl 41:6848–6860
Bisoi R, Dash PK (2014) A hybrid evolutionary dynamic neural network for stock market trend analysis and prediction using unscented Kalman filter. Appl Soft Comput 19:41–56
Zarandi MF, Rezaee B, Turksen IB, Neshat E (2009) A type-2 fuzzy rule-based expert system model for stock price analysis. Expert Syst Appl 36(1):139–154
Abdul-Sal ME, Abdul-Kade HM, Abdel-Wahed WF (2010) Comparative study between differential evolution and particle swarm optimization algorithms in training of feed-forward neural network for stock price prediction. In: 7th international conference on informatics and system. IEEE, pp 1–8
Alpaydin E (2009) Introduction to machine learning. MIT Press, Cambridge, p 30
Han J, Pei J, Kamber M (2011) Data mining: concepts and techniques. Elsevier, Amsterdam, p 30
Azadeh A, Saberi M, Ghaderi S, Gitiforouz A, Ebrahimipour V (2008) Improved estimation of electricity demand function by integration of fuzzy system and data mining approach. Energy Convers Manag 49(8):2165–2177
Azadeh A, Asadzadeh SM, Ghanbari A (2010) An adaptive network-based fuzzy inference system for short-term natural gas demand estimation: uncertain and complex environments. Energy Policy 38:1529–1536
Yu L, Liu H (2003) Feature selection for high-dimensional data: a fast correlation-based filter solution. In: Proceedings of the 20th international conference on machine learning, pp 856–863
Lee MC (2009) Using support vector machine with a hybrid feature selection method to the stock trend prediction. Expert Syst Appl 36(8):10896–10904
Webb AR (2003) Statistical pattern recognition. Wiley, Hoboken
Lin F, Liang D, Yeh CC, Huang JC (2014) Novel feature selection methods to financial distress prediction. Expert Syst Appl 41(5):2472–2483
Kao LJ, Chiu CC, Lu CJ, Yang JL (2013) Integration of nonlinear independent component analysis and support vector regression for stock price forecasting. Neurocomputing 99:534–542
Hadavandi E, Shavandi H, Ghanbari A (2010) Integration of genetic fuzzy systems and artificial neural networks for stock price forecasting. Knowl Based Syst 23:800–808
Hsieh TJ, Hsiao HF, Yeh WC (2011) Forecasting stock markets using wavelet transforms and recurrent neural networks: an integrated system based on artificial bee colony algorithm. Appl Soft comput 11(2):2510–2525
Zahedi J, Rounaghi M (2015) Application of artificial neural network models and principal component analysis method in predicting stock prices on Tehran Stock Exchange. Phys A 438:178–187
Guresen E, Gulgun K, Daim TU (2011) Using artificial neural network models in stock market index prediction. Expert Syst Appl 38(8):10389–10397
Lu CJ, Lee TS, Chiu CC (2009) Financial time series forecasting using independent component analysis and support vector regression. Decis Support Syst 47(2):115–125
Dhar S, Mukherjee T, Ghoshal AK (2010) Performance evaluation of neural network approach in financial prediction: evidence from Indian market. In: International conference on communication and computational intelligence (INCOCCI). IEEE, pp 597–602
Adebiyi AA, Adewumi AO, Ayo CK (2014) Comparison of ARIMA and artificial neural networks models for stock price prediction. J Appl Math 2014:1–7
Lee YS, Tong LI (2011) Forecasting time series using a methodology based on autoregressive integrated moving average and genetic programming. Knowl Based Syst 24(1):66–72
Chang PC, Wang DD, Zhou CL (2012) A novel model by evolving partially connected neural network for stock price trend forecasting. Expert Syst Appl 39(1):611–620
Huang CF (2012) A hybrid stock selection model using genetic algorithms and support vector regression. Appl Soft Comput 12(2):807–818
Cheng C, Xu W, Wang J (2012) A comparison of ensemble methods in financial market prediction. In: 2012 Fifth international joint conference on computational sciences and optimization. IEEE, pp 755–759
Shen W, Guo X, Wu C, Wu D (2011) Forecasting stock indices using radial basis function neural networks optimized by artificial fish swarm algorithm. Knowl Based Syst 24:378–385
Khan K, Sahai A (2012) A comparison of BA, GA, PSO, BP and LM for training feed forward neural networks in e-learning context. Int J Intell Syst Appl 4(7):23–29
Hassan MR, Nath B, Kirley M (2007) A fusion model of HMM, ANN and GA for stock market forecasting. Expert Syst Appl 33(1):171–180
Ferreira TAE, Germano CV, Adeodato PJL (2008) A new intelligent system methodology for time series forecasting with artificial neural networks. Neural Process Lett 28(2):113–129
Ahmadi E, Jasemi M, Monplaisir L, Nabavi MA, Mahmoodi A, Jam PA (2018) New efficient hybrid candlestick technical analysis model for stock market timing on the basis of the Support Vector Machine and Heuristic Algorithms of Imperialist Competition and Genetic. Expert Syst Appl 94:21–31
Author information
Authors and Affiliations
Corresponding author
Ethics declarations
Conflict of interest
The authors declare that they have no conflict of interest.
Additional information
Publisher's Note
Springer Nature remains neutral with regard to jurisdictional claims in published maps and institutional affiliations.
Rights and permissions
About this article

Cite this article
Kumar, G., Jain, S. & Singh, U.P. Stock Market Forecasting Using Computational Intelligence: A Survey. Arch Computat Methods Eng 28, 1069–1101 (2021). https://doi.org/10.1007/s11831-020-09413-5
Received:
Accepted:
Published:
Issue Date:
DOI: https://doi.org/10.1007/s11831-020-09413-5