Avoid common mistakes on your manuscript.
1 Introduction
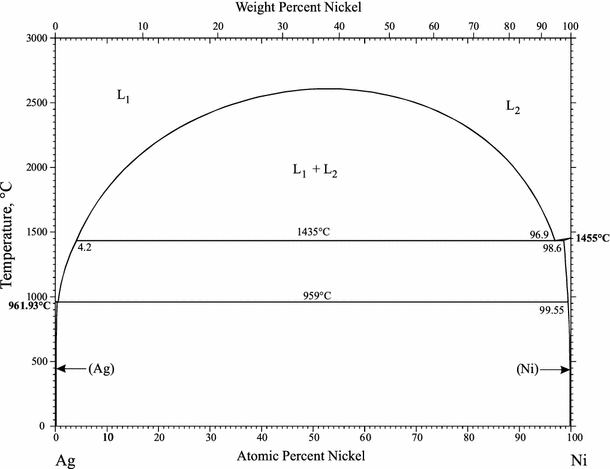
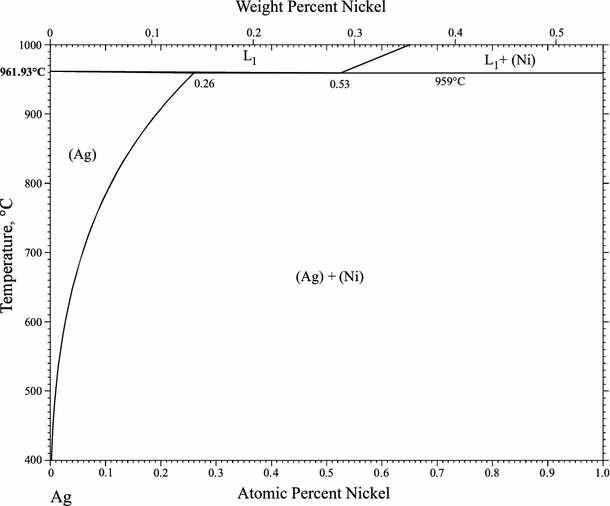
Binary Alloy Phase Diagrams, 2nd edition, a comprehensive collection of alloy phase diagrams for 2159 binary systems, was published in 1990 (T.B. Massalski, H. Okamoto, P.R. Subramanian, and L. Kacprzak., ASM International, Materials Park, OH [Massalski2]). This review intends to provide more recent information on the binary phase diagrams for the Ag-Ni, Ag-Zr, Au-Bi, B-Ni, Co-Sb, Cu-Mn, Cu-Si, Cu-Zn, Fe-Zr, Li-Sb, Mg-Pu, and Si-Zr systems that have become available after 1990. The criteria for selecting such information for inclusion in this review are (1) systems for which no phase diagram was given in [Massalski2], (2) complete diagrams that are substantially different from the earlier version, and (3) partial diagrams that alter or clarify the earlier version. Thermodynamic consistency of the new phase diagrams was checked based on phase rules and the diagrams were modified if necessary. However, each updated phase diagram has not gone through the ordinary evaluation process. Accordingly, a newer phase diagram is not always a better diagram, especially when there is too little published data on a system. For convenience, reaction tables and crystal structure data have been added when new information was available.
3 References
-
1990Mas: T.B. Massalski, H. Okamoto, P.R. Subramanian, and L. Kacprzak, ed., Ag-Ni (Silver-Nickel), Binary Alloy Phase Diagrams, 2nd ed., ASM International, Materials Park, OH, 1990, p 64-66
-
1991Sin: M. Singleton and P. Nash, Phase Diagrams of Binary Nickel Alloys, P. Nash, ed., ASM International, Materials Park, OH, 1991, p 1-3
-
2008Liu: X.J. Liu, F. Gao, C.P. Wang, and K. Ishida, Thermodynamic Assessments of the Ag-Ni Binary and Ag-Cu-Ni Ternary Systems, J. Electron. Mater., 2008, 37(2), p 210-217
4 Ag-Zr (Silver-Zirconium)
The Ag-Zr system was reviewed by [1992Kar]. The assessed phase diagram was accepted by [1990Mas]. According to [1997Oka], data from two key papers ([1978Lob], [1988Zha]) published earlier were not cited by [1992Kar].
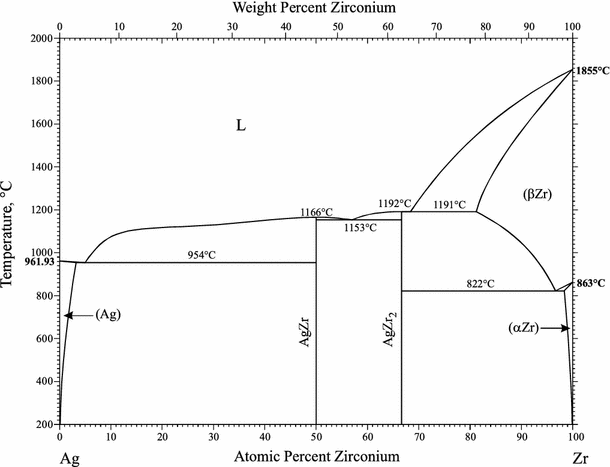
Thermodynamic modeling of this system was attempted by [2010Kan] and [2016Hsi].
Figure 3 shows the result of the most recent work of [2016Hsi].
5 References
-
1978Lob: T.P. Loboda, V.N. Pyatnitskii, M.V. Raevskaya, E.M. Sokolovskaya, Study of the Zirconium-Silver System by Differential Thermal Analysis, Vest. Mosk. Univ., Khim., 1978, 19, p 298-301
-
1988Zha: K. Zhang, H. Zhao, and Y. Zhou, An Investigation of the Ag-Zr Phase Diagram, J. Less Common Met., 1988, 138, p 173-177.
-
1990Mas: T.B. Massalski, H. Okamoto, P.R. Subramanian, and L. Kacprzak, ed., Ag-Zr (Silver-Zirconium), Binary Alloy Phase Diagrams, 2nd ed., ASM International, Materials Park, OH, 1990, p 117, 119
-
1992Kar: I. Karakaya and W.T. Thompson, The Ag-Zr (Silver-Zirconium) System, J. Phase Equilib., 1992, 13(2), p 143-146
-
1997Oka: H. Okamoto, Ag-Zr (Silver-Zirconium), J. Phase Equilib., 1997 18(3), p 312
-
2010Kan: D.H. Kang and I.H. Jung, Critical Thermodynamic Evaluation and Optimization of the Ag-Zr, Cu-Zr and Ag-Cu-Zr Systems and Its Applications to Amorphous Cu-Zr-Ag Alloys, Intermetallics, 2010, 18, p 815-833
-
2016Hsi: H.M. Hsiao, S.M. Liang, R. Schmid-Fetzer, and Y.W. Yen, Thermodynamic Assessment of the Ag-Zr and Cu-Zr Binary Systems, CALPHAD, 2016, 55, p 77-87
6 Au-Bi (Gold-Bismuth)
The Au-Bi system was reviewed by [1983Oka]. The assessed phase diagram was adopted by [1990Mas]. Additional information introduced by [1990Mas] was consistent with [1983Oka]. Figure 4 shows the Au-Bi phase diagram thermodynamically optimized by [2007Wan]. The retrograde (Au) solidus is enlarged in Fig. 5. These results are in good agreement with [1990Mas].
7 References
-
1983Oka: H. Okamoto and T.B. Massalski, The Au-Bi (Gold-Bismuth) System, Bull. Alloy Phase Diagrams, 1983, 4(4), p 401-407; Phase Diagrams of Binary Gold Alloys, H. Okamoto and T.B. Massalski, ed., ASM International, Metals Park, OH, 1987, p 32-37
-
1990Mas: T.B. Massalski, H. Okamoto, P.R. Subramanian, and L. Kacprzak, ed., Au-Bi (Gold-Bismuth), Binary Alloy Phase Diagrams, 2nd ed., ASM International, Materials Park, OH, 1990, p 343, 345-346
-
2007Wan: J. Wang, F.G. Meng, H.S. Liu, L.B. Liu, and Z.P. Jin, Thermodynamic Modeling of the Au-Bi-Sb Ternary System, J. Electron. Mater., 2007, 36(5), p 568-577
8 B-Ni (Boron-Nickel)
The B-Ni system was reviewed by [1991Lia] and the assessed phase diagram was adopted by [1990Mas]. This phase diagram was thermodynamically optimized by [2009Sun]. The result is shown in Fig. 6.
9 References
-
1990Mas: T.B. Massalski, H. Okamoto, P.R. Subramanian, and L. Kacprzak, ed., B-Ni (Boron-Nickel), Binary Alloy Phase Diagrams, 2nd ed., ASM International, Materials Park, OH, 1990, p 508-510
-
1991Lia: P.K. Liao and K.E. Spear, B-Ni (Boron-Nickel), Phase Diagrams of Binary Nickel Alloys, P. Nash, ed., ASM International, Materials Park, OH, 1991, p 31-36
-
2009Sun: W.H. Sun, Y. Du, Y, Kong, H.H. Xu, W. Xiong, and S.H. Liu, Reassessment of the Ni-B System Supported by Key Experiments and First-Principles Calculation, Int. J. Mat. Res., 2009, 100, p 59-67
10 Co-Sb (Cobalt-Antimony)
Information on the Co-Sb system was summarized by [1990Mas] based on [1990Ish]. It was supplemented by [1991Oka] based on [1990Han] and then by [2005Oka] based on [2004Li].
Figure 7 shows the Co-Sb phase diagram calculate by [2008Zha] in comparison with that calculated by [2004Li]. The latter agrees much better with [1990Ish] or [1990Han] along the liquidus on the Sb side where disagreement between [2004Li] and [2008Zha] is significant. Therefore, the diagram of [2004Li] may be better. See earlier reviews for other controversial features found among various versions of the phase diagram.
11 References
-
1990Han: G. Hanninger, H. Ipser, P. Terzieff, and K.L. Komarek, The Co-Sb Phase Diagram and Some Properties of NiAs-Type Co1±xSb, J. Less-Common Met., 1990, 166, p 103-114
-
1990Ish: K. Ishida and T. Nishizawa, The Co-Sb (Cobalt-Antimony) System, Bull. Alloy Phase Diagrams, 1990, 11(3), p 243-248
-
1990Mas: T.B. Massalski, H. Okamoto, P.R. Subramanian, and L. Kacprzak, ed., Co-Sb (Cobalt-Antimony), Binary Alloy Phase Diagrams, 2nd ed., ASM International, Materials Park, OH, 1990, p 1232, 1234
-
1991Oka: H. Okamoto, Co-Sb (Cobalt-Antimony), J. Phase Equilib., 1991, 12(2), p 244-245
-
2004Li: H.X. Li, S.M. Hao, S.G. Fries, and J.C. Tedenac, “Thermodynamic Assessment of the Co-Sb System, The 12 th National Symposium on Phase Diagram, Materials, Design, and Their Applications, China, 2004, p 81-83, in Chinese
-
2005Oka: H. Okamoto, Co-Sb (Cobalt-Antimony), J. Phase Equilib. Diffus., 2005, 26(2), p 198
-
2008Zha: Y. Zhang, C. Li, Z. Du, and T. Geng, The Thermodynamic Assessment of the Co-Sb System, CALPHAD, 2008, 32, p 56-63
12 Cu-Mn (Copper-Manganese)
The Cu-Mn phase diagram in [1990Mas] was redrawn from [1969Shu]. This phase diagram was characterized by the existence of two ordered phases with approximate compositions of Cu5Mn and Cu3Mn, which were based on [1962Sok]. [1994Gok] reviewed this system and proposed an assessed phase diagram with the ordered phases combined into one phase named ε. [1998Oka] introduced another Cu-Mn phase diagram proposed by [1993Lew]. The ordered phases were out of the range of this phase diagram.
Taking into account the existence of γ3, γ1 (Cu5Mn), and γ2 (Cu3Mn) reported by [1962Sok] and [1990God], [2006Tur] optimized boundaries of these phases by thermodynamic modeling, as shown in Fig. 8
Table 1 shows Cu-Mn crystal structure data. No information is available for the three ordered phases.
According to [2007Vil], the existence of an In-type phase on the Mn-rich side (80-90 at.% Mn) of this system was reported in five references. There are many reports on metastable transitions observed in this composition range [1994Gok], but the In-type phase was not referred to in the discussion. Major revisions may be needed in the phase diagram if a stable phase exists in this range.
13 References
-
1962Sok: E.M. Sokolovskaya, A.T. Grigor’ev, and E.M. Smirnova, Transformations in the Solid State in Alloys of the Copper-Manganese System Rich in Copper, Zh. Neorg. Khim., 1962, 7(11), p 2636-2638
-
1969Shu: F.A. Shunk, Cu-Mn, Copper-Manganese, Constitution of Binary Alloys, Second Supplement, McGraw-Hill, New York, 1969, p 290-291
-
1990God: T. Gödecke, Physical Measurement of Copper-Manganese Alloys, III. Influence of Quenching Temperature on the Electrical Resistance and the Dilatation of Alloys, Z. Metallkd, 1990, 81, p 826-835, in German
-
1990Mas: T.B. Massalski, H. Okamoto, P.R. Subramanian, and L. Kacprzak, ed., Cu-Mn (Copper-Manganese), Binary Alloy Phase Diagrams, 2nd ed., ASM International, Materials Park, OH, 1990, p 1435-1436
-
1993Lew: K. Lewin, D, Sichen, and S. Seetharaman, Thermodynamic Study of the Cu-Mn System, Scand. J. Metall.,1993, 22, p 310-316
-
1994Gok: N.A. Gokcen, Cu-Mn (Copper-Manganese), Phase Diagrams of Binary Copper Alloys, P.R. Subramanian, D.J. Chakrabarti, and, D.E. Laughlin, ed., ASM International, Materials Park, OH, 1994, p 253-259
-
1998Oka: H. Okamoto, Cu-Mn (Copper-Manganese), J. Phase Equilib., 1998, 19(2), p 180
-
2006Tur: M.A. Turchanin, P.G. Agraval, and A.R. Abdulov, Phase Equilibria and Thermodynamics of Binary Copper Systems with 3d-Metals. IV. Copper-Manganese System, Powder Metall. Met. Ceram., 2006, 45(11-12), p 569-581
-
2007Vil: P. Villars and K. Cenzual, Pearson’s Crystal Data CD-ROM, Release 2007/8, ASM International, OH, 2007
14 Cu-Si (Copper-Silicon)
The thermodynamic model used for calculation of the Cu-Si phase diagram by [2000Yan] may have been too simplified [2002Oka]. For example, the η phase was treated as one phase by [2000Yan], but the existence of η′ and η″ phases, as in [1990Mas], was confirmed by [2007Mat] and [2011Suf] experimentally, as reviewed by [2012Oka]. Figure 9 shows the Cu-Si phase diagram thermodynamically optimized by [2016Hal] for 0 to 40 at.% Si by including this new information. The (Si) liquidus in Fig. 9 was drawn according to [2000Yan]. Experimental phase diagrams differ from this calculated phase diagram with regard to the solubility range of the η phase group most noticeably. Experimental diagrams show about 2 at.% width for these phases. Confirmation is required.
Cu-Si crystal structure data in Table 2 have been updated according to [2016Hal].
15 References
-
1990Mas: T.B. Massalski, H. Okamoto, P.R. Subramanian, and L. Kacprzak, ed., Cu-Si (Copper-Silicon), Binary Alloy Phase Diagrams, 2nd ed., ASM International, Materials Park, OH, 1990, p 1477-1478
-
2000Yan: X. Yan and Y.A. Chang, A Thermodynamic Analysis of the Cu-Si System, J. Alloys Compd., 2000, 308, p 221-229
-
2002Oka: H. Okamoto, Cu-Si (Copper-Silicon), J. Phase Equilib., 2002, 23(3), p 281
-
2007Mat: N. Mattern, R. Seyrich, L. Wilde, C. Baehtz, M. Knapp, and J. Acker, Phase Formation of Rapidly Quenched Cu-Si Alloys, J. Alloys Compd., 2007, 429, p 211-215
-
2011Suf: K. Sufryd, N. Ponweiser, P. Riani, K.W. Richter, and G. Cacciamani, Experimental Investigation of the Cu-Si Phase Diagram at x(Cu) > 0.72, Intermetallics, 2011, 19(10), p 1479-1488
-
2012Oka: H. Okamoto, Cu-Si (Copper-Silicon), J. Phase Equilib. Diffus., 2012, 33(5), p 415-416
-
2016Hal: B. Hallstedt, J. Gröbner, M. Hampl, and R. Schmid-Fetzer, Calorimetric Measurements and Assessment of the Binary Cu-Si and Ternary Al-Cu-Si Phase Diagrams, CALPHAD, 2016, 53, p 25-38
16 Cu-Zn (Copper-Zinc)
The Cu-Zn system was reviewed by [1994Mio]. The assessed phase diagram was shown in [1990Mas] (solid lines in Fig. 10). This phase diagram was thermodynamically optimized by [2008Gie] (broken lines in Fig. 10). Compositions and temperatures of invariant reactions marked in Fig. 10 are for [1994Mio]. The calculated results of [2008Gie] are in good agreement.
17 References
-
1990Mas: T.B. Massalski, H. Okamoto, P.R. Subramanian, and L. Kacprzak, ed., Cu-Zn (Copper-Zinc), Binary Alloy Phase Diagrams, 2nd ed., ASM International, Materials Park, OH, 1990, p 1508-1510
-
1994Mio: A.P. Miodownik, Cu-Zn (Copper-Zinc), Phase Diagrams of Binary Copper Alloys, P.R. Subramanian, D.J. Chakrabarti, and D.E. Laughlin, ed., ASM International, Materials Park, OH, 1994, p 487-496
-
2008Gie: W. Gierlotka and S.W. Chen, Thermodynamic Descriptions of the Cu-Zn System, J. Mater. Res., 2008, 23(1), p 258-263
18 Fe-Zr (Iron-Zirconium)
[2006Oka] introduced the Fe-Zr phase diagram experimentally determined by [2002Ste]. [2008Guo] optimized this phase diagram by thermodynamic modeling. The result is shown in Fig. 11.
The liquidus of the (βZr) phase in the phase diagram of [2002Ste] appeared too flat at the Zr end according to one of the guidelines given in [1993Oka]. This problem has been alleviated in Fig. 11.
19 References
-
1993Oka: H. Okamoto and T.B. Massalski, Guidelines for Binary Phase Diagram Assessment, J. Phase Equilib., 1993, 14(3), p 316-335
-
2002Ste: F. Stein, G. Sauthoff, and M. Palm, Experimental Determination of Intermetallic Phases, Phase Equilibria, and Invariant Reaction Temperatures in the Fe-Zr System, J. Phase Equilib., 2002, 23(6), p 480-494
-
2006Oka: H. Okamoto, Fe-Zr (Iron-Zirconium), J. Phase Equilib. Diffus., 2006, 27(5), p 543-544
-
2008Guo: C. Guo, Z. Du, C. Li, B. Zhang, and M. Tao, Thermodynamic Description of the Al-Fe-Zr System, CALPHAD, 2008, 32, p 637-649
20 Li-Sb (Lithium-Antimony)
[1996Oka] introduced the Li-Sb phase diagram determined by [1995Fed]. In comparison with the diagram of [1990Mas], this new phase diagram differed substantially, including three additional phases, Li3Sb2 (dimorphic) and LiSb2. However, [1995Fed] noted that his phase diagram should be treated as nonequilibrium phase diagram. Recently, [2015Kan] confirmed that these phases are unstable phases based on EMF measurements. [2017Zha] also confirmed the absence of these phases in the equilibrium state by XRD, SEM, and EPM measurements. Figure 12 shows the Li-Sb phase diagram thermodynamically optimized by [2017Zha]. Table 3 shows Li-Sb crystal structure data taken from [1990Mas].
21 References
-
1990Mas: T.B. Massalski, H. Okamoto, P.R. Subramanian, and L. Kacprzak, ed., Li-Sb (Lithium-Antimony), Binary Alloy Phase Diagrams, 2nd ed., ASM International, Materials Park, OH, 1990, p 2465-2466
-
1995Fed: P.I. Fedorov, Lithium-Antimony System, Russ. J. Inorg. Chem., 1995, 40(5), p 815-817
-
1996Oka: H. Okamoto, Li-Sb (Lithium-Antimony), J. Phase Equilib., 1996, 17(3), p 271
-
2015Kan: M.M. Kane, J.M. Newhouse, and D.R. Sadoway, Electrochemical Determination of the Thermodynamic Properties of Lithium-Antimony Alloys, J. Electrochem. Soc., 2015, 162, p A421-A425
-
2017Zha: F. Zhang, S. Liu, J. Wang, Y. Du, and L. Sun, Experimental Investigation and Thermodynamic Assessment of the Li-Sb System, CALPHAD, 2017, 57, p 28-36
22 Mg-Pu (Magnesium-Plutonium)
The Mg-Pu system was reviewed by [1988Nay]. The phase diagram was speculative due to lack of conclusive experimental data. Only two intermediate phases were shown.
[1990Mas] accepted the complete Mg-Pu phase diagram reported later by [1989Axl]. [2009Wan] optimized this phase diagram by thermodynamic modeling. The result is shown in Fig. 13. The low-temperature part of this phase diagram is enlarged in Fig. 14.
Low-temperature part of Fig. 13 [2009Wan]
Mg-Pu crystal structure data given in [1988Nay] and [1990Mas] are summarized in Table 4. Intermediate phases may have to be re-examined because crystal structures have not been well established.
23 References
-
1988Nay: A.A. Nyeb-Hashemi and J.B. Clark, Mg-Pu (Magnesium-Plutonium), Phase Diagrams of Binary Magnesium Alloys, A.A. Nyeb-Hashemi and J.B. Clark, ed., ASM INTERNATIONAL, Materials Park, OH, 1988, p 259-263
-
1990Mas: T.B. Massalski, H. Okamoto, P.R. Subramanian, and L. Kacprzak, ed., Mg-Pu (Magnesium-Plutonium), Binary Alloy Phase Diagrams, 2nd ed., ASM International, Materials Park, OH, 1990, p 2539-2540
-
1989Axl: K.M. Axler, E.M. Foltyn, D.E. Peterson, R.I. Sheldon, and W.B. Hutchinson, The Plutonium-Magnesium System, J. Nucl. Mater., 1989, 161(2), p 132-139
-
2009Wan: C.P. Wang, W. Fang, Z.S. Li, and X.J. Liu, Thermodynamic Modeling of the Mg-Pu and Cu-Pu Systems, J. Nucl. Mater., 2009, 392, p 525-530
24 Si-Zr (Silicon-Zirconium)
The Si-Zr system was reviewed by [1990Oka]. The assessed phase diagram was adopted by [1990Mas].
Figure 15 shows the Si-Zr phase diagram optimized by [2009Che2] (the same diagram in [2009Che1] also). This phase diagram is in good agreement with [1990Oka]. The thermodynamic model was consistent with the thermodynamic data provided by [1985Sun] and [2002Wit].
25 References
-
1985Sun: B. Sundman, B. Jansson, and J.O. Andersson, The Thermo-Calc Databank System, CALPHAD, 1985, 9(2), p 153-190
-
1990Mas: T.B. Massalski, H. Okamoto, P.R. Subramanian, and L. Kacprzak, ed., Si-Zr (Silicon-Zirconium), Binary Alloy Phase Diagrams, 2nd ed., ASM International, Materials Park, OH, 1990, p 3382, 3384-3385
-
1990Oka: H. Okamoto, The Si-Zr (Silicon-Zirconium) System, Bull. Alloy Phase Diagrams, 1990, 11(5), p 513-519
-
2002Wit: V.T. Witusiewicz, I. Arpshofen, H.J. Seifert, F. Sommer, and F. Aldinger, Enthalpy of Mixing of Liquid and Undercooled Liquid Ternary and Quaternary Cu-Ni-Si-Zr Alloys, J. Alloys Compd., 2002, 337, p 155-167
-
2009Che1: H.M. Chen, Y. Xiang, S. Wang, F. Zheng, L.B Liu, and Z.P. Jin, Thermodynamic Assessment of the C-Si-Zr System, J. Alloys Compd., 2009, 474, p 76-80
-
2009Che2: H.M. Chen, F. Zheng, H.S. Liu, L.B Liu, and Z.P. Jin, Thermodynamic Assessment of B-Zr and Si-Zr Systems, J. Alloys Compd., 2009, 468, p 209-216
Author information
Authors and Affiliations
Corresponding author
Rights and permissions
About this article
Cite this article
Okamoto, H. Supplemental Literature Review of Binary Phase Diagrams: Ag-Ni, Ag-Zr, Au-Bi, B-Ni, Co-Sb, Cu-Mn, Cu-Si, Cu-Zn, Fe-Zr, Li-Sb, Mg-Pu, and Si-Zr. J. Phase Equilib. Diffus. 39, 87–100 (2018). https://doi.org/10.1007/s11669-017-0610-3
Received:
Published:
Issue Date:
DOI: https://doi.org/10.1007/s11669-017-0610-3


