
Avoid common mistakes on your manuscript.
The Ga-Pt phase diagram in [Massalski2] (solid lines in Fig. 1) was thermodynamically assessed by [2006Li]. The result is shown with dashed lines in Fig. 1. The phase boundary data adopted by [2006Li] in their assessment were essentially the same as those adopted by [Massalski2] from [1976Gue]. Noticeable differences between [Massalski2] and [2006Li] are as follows:
-
GaPt liquidus: The [Massalski2] diagram is too asymmetric. [2006Li] is more likely although [Massalski2] agrees better with available experimental data.
Fig. 1 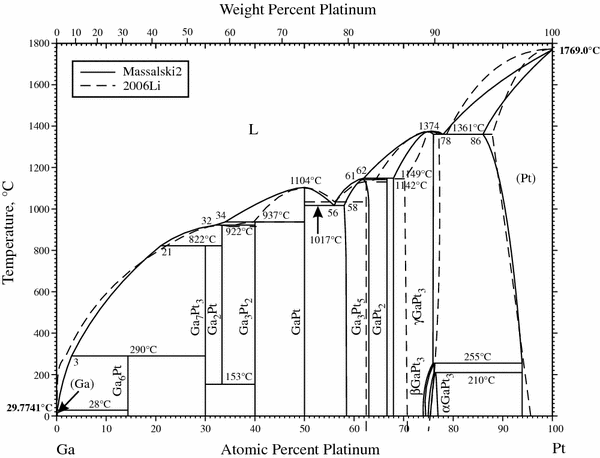
Ga-Pt phase diagram
-
Ga3Pt5: [2006Li] assumes a line compound whereas [Massalski2] shows ∼5 at.% solubility range. This disagreement must be settled experimentally.
-
γGaPt3: The difference in the width must be examined experimentally.
-
\(\upbeta\hbox{GaPt}_{3}\) and \(\upalpha\hbox{GaPt}_{3}\): These phases were not taken into account by [2006Li].
-
(Pt): Experimental data are not available to support either [Massalski2] or [2006Li].

References
Guex P., Feschotte P. (1976) Binary Systems Platinum-Aluminum, Platinum-Gallium, and Platinum-Indium. J. Less-Common Met. 46(1):101-116 in French
Li M., Wang F., Zhang W. (2006) Thermodynamic Assessment of the Ga-Pt System. Intermetallics 14(7):826-831
Author information
Authors and Affiliations
Corresponding author
Rights and permissions
About this article
Cite this article
Okamoto, H. Ga-Pt (Gallium-Platinum). J Phs Eqil and Diff 28, 494 (2007). https://doi.org/10.1007/s11669-007-9149-z
Received:
Accepted:
Published:
Issue Date:
DOI: https://doi.org/10.1007/s11669-007-9149-z