
Abstract
In the era of cut-throat competition, especially in automobile sector, success of an organization resides in its ability to respond quickly to the needs of its customers. These customer needs must be attended with minimum manufacturing costs, minimum lead time to launch the product in market, and delivering better performance than the existing competitors in the market. Six Sigma is a powerful methodology which ultimately helps in cost reduction. Because of defect prevention and improved product and processes, it leads to increase in profitability and market share. This is accomplished through the use of two Six Sigma sub-methodologies: DMAIC and DMADV (Andersson et al., TQM Mag 18:282–296, 2006). By adopting Design For Six Sigma methodology in the design stage itself leads to launch of a product with maximum quality performance, with tighter tolerances, and with reduced or no defects. This paper considers cost of poor quality as the loss imparted to society from the time the product is shipped, and deals with the applications and benefits of Six Sigma methodology and its positive impact on cost of poor quality. A case study is presented, which enabled application of six sigma methodology in wider range of manufacturing activities. This paper is of value to the researcher in the field of quality management, as well as professionals in the manufacturing industry, wherever the quality improvement is an issue. Quality costs or Cost of Quality is a means to quantify the total cost of quality-related efforts and deficiencies (Banuelas and Antony, TQM Mag 14:92, 2002). The “cost of quality” is not the price of creating a quality product or service. It is the cost of NOT creating a quality product or service. Quality Costs represent the difference between the actual cost of a product or service and what the reduced cost would be if there was no possibility of substandard service, failure of products, or defects in their manufacture.
Introduction
Six Sigma is a disciplined, data-driven approach and methodology for eliminating defects in any process—from manufacturing to transactional and from product to service. In process improvement efforts, a defect per million opportunities (DPMO) [2] [or nonconformities per million opportunities (NPMO)] is a measure of process performance. It is defined as
A defect is defined as a nonconformance of a quality characteristic (e.g., strength, width response time) to its specification. DPMO is stated in opportunities per million units for convenience: Processes that are considered highly capable (e.g., processes of Six Sigma quality) are those that experience only a handful of defects per million units produced (or services provided). To achieve Six Sigma, a process must not produce more than 3.4 DPMO. A Six Sigma opportunity is then the total quantity of chances for a defect. This is accomplished through the use of two Six Sigma sub-methodologies: Define Measure, Analyze, Improve, and Control (DMAIC) and Define, Measure, Analyze, Design, and Verify (DMADV). The Six Sigma DMAIC is an improvement system for existing processes falling below specification and looking for incremental improvement. The Six Sigma DMADV is an improvement system used to develop new processes or products at Six Sigma quality levels. Six Sigma seeks to improve the quality of process outputs by identifying and removing the causes of defects (errors) and minimizing variability in manufacturing and business processes. It uses a set of quality management methods, including statistical methods, and creates a special infrastructure of people within the organization (“Champions,” “Black Belts,” “Green Belts,” “Orange Belts,” etc.) [2] who are experts in these very complex methods. Each Six Sigma project carried out within an organization follows a defined sequence of steps and has quantified value targets. Both Six Sigma processes (DMAIC and DMADV) are executed by Six Sigma Green Belts and Six Sigma Black Belts and are overseen by Six Sigma Master Black Belts.
The following are the areas in the automotive industry where Six Sigma is applicable [3]
-
Improving Safety and Reliability of Finished Vehicles.
-
Reducing Manufacturing defects at each stage.
-
Using Design Failure mode effect analysis (FMEA) to understand and prevent any possible design failures.
-
Reducing variation in all the critical parameters that impact the finished product.
-
Improving the overall Incoming Material Quality or parts Quality.
-
Optimizing Inventory levels for all major parts.
-
Reducing time to manufacture.
-
Reducing Supplier Lead time, i.e., the time taken by each supplier to deliver goods.
-
Enhancing Supplier Quality.
There are numerous benefits of Six Sigma, which is used as a way to address issues and problems. It includes Focus on customers, Improved customer loyalty, Reduced cycle time, Less waste, Data based decisions, Time management, Sustained gains and improvements, Systematic problem solving, Employee motivation, Data analysis before decision making, Team building, Improved customer relations, Assure strategic planning, Reductions of incidents, Measure value according to the customer, Better safety performance, Understanding of processes, Effective supply chain management, Design and redesign products/services, Knowledge of competition, competitors, Develop leadership skills, Break down barriers between departments and functions, Management training, Improve presentation skills, Integration of products, services and distribution, Use of standard operating procedures, Better decision making, Improving project management skills, Sustained improvements, Alignment with strategy vision and values, Increased margins, Greater market share, Supervisor training, Lower costs to provide goods and services, Fewer customer complaints. Some organization cultures are fear based, mistakes are not allowed, and employees tend to hide defects. Six Sigma, on the other hand, flourishes in an open and safe environment where defects are seen as improvement opportunities. These are only some of the benefits of Six Sigma. There are numerous benefits associated with these benefits directly/indirectly.
Understanding Cost of Quality
The costs associated with quality are divided into two categories: Cost of Good Quality and Cost of Poor Quality (COPQ) [5, 6]. Prevention costs and appraisal costs are costs associated with good quality, while failure costs result from poor quality. Management must understand these costs to create quality improvement strategy. An organization’s main goal is to survive and maintain high quality goods or services, with a comprehensive understanding of the costs related to quality this goal can be achieved (Refer Fig. 1).

Cost of quality
Refer Table 1; it gives relationship between Six Sigma & COPQ [4].
Frame of Six Sigma Methodology
Six Sigma is a management strategy that maximizes customer satisfaction and minimizes the defects that create customer dissatisfaction. The five step approach of Six Sigma reduces the defects in process, product, or service. Flow charts, Pareto analysis, Cause and Effect diagrams are the most frequently used basic analytic and measurement tools by Six Sigma implementation teams (Figs. 2, 3).

Roadmap of Six Sigma approach

Define phase
The approach consists of six consecutive phases. Each phase is a prerequisite for performing the next. The six phases are
-
Define In this phase, a serious problem is identified, and a project team is formed and given the responsibility and resources for solving the problem.
-
Measure In this phase, data are gathered and analyzed that describes with precision and accuracy, what is happening? What is current or baseline, and level of performance of the process that creates the problem. It also produces some preliminary ideas of possible causes for problem.
-
Analyze In this phase, theories are generated as to what may cause the problem and by means of testing the theories, root causes are identified.
-
Improve In this phase, root causes are removed by means of designing and implementing changes to the process that has been producing the problem.
-
Control In this phase, new controls are designed and implemented, which prevent the original problem from returning and which hold the gains made by the improvements.
-
Replicate In this phase, the knowledge, insights, and know how acquired by the team are used to correct other quality problems and to identify new quality improvement projects.
The Roadmap of Six Sigma approach is given below.
Case Study: “reduction in rejection of gear box housing due to tapper in cross-hole”
Here, the Objective is to reduce the possibility of rejection of gear box housing due to tapper in cross-hole.
Define Phase
The define roadmap is given below [3]:
Major activities in define phase are
-
Identify the projects which are linked to big Y which improves the margin of performance by 10%.
-
Select the team which is ready to contribute.
-
Prepare team character and get it approved.
-
Train team members.
-
Map the process.
-
Carry out value analysis.
-
Walkthrough process.
-
Analyze the past data from various view points.
-
Identify quick wins and implement.
-
Record results of quick wins.
During the define phase, the following three steps are completed by the DMAIC approach:
-
Preparation of the project charter.
-
Preparation of SIPOC diagram and process flow.
-
Determination of important inputs and outputs using cause and effect analysis.
Figure 4 shows below the business various opportunities. Where Rejection shown in parts per million (PPM).

Business opportunities
Project Selection
Gear box rejection data are collected randomly. Then collected data are tabulated with total no’s of rejection and exact reason behind every rejection. Refer Table 2.
Pareto Chart of Machine
The purpose of the Pareto chart is to highlight the most important among a (typically large) set of factors. In quality control, it often represents the most common sources of defects, the highest occurring type of defect, or the most frequent reasons for customer complaints, and so on. Refer Fig. 5.

Pareto chart
Criteria for Selecting Six Sigma
-
(1)
Rejection is High Contributing 35% of total rejection (Shown in Pareto tool Fig. 5).
-
(2)
Dismantled of Gear Box Sub Assemble Leads to Production Loss.
-
(3)
Gear Shifting Hard.
Actual Problem Definition
In Gear box, there is an operation of 220 mm length and 12 mm diameter cross-hole (shown in blue color). The dimension of hole is 197.0 ± 0.1 mm measuring from A & C as shown in Fig. 6, and permissible taper is 0.2 mm. Suppose distance AB is 196.9 mm and distance CD is 197.35 mm, then taper of the hole is 0.45 mm

Section of gear box
If there is taper more than specification in cross-hole (shown in Figs. 6, 7 blue color), the pin in cross-hole will be mismatch with the groove of gear shifting rod. As a result, male side of fork will not come in front of female side. Because of this misalign of the fork, gear is not changed smoothly. Some time even gear is not changed depending upon the magnitude of taper.

Pin mismatch with the shifting rod groove
Team Charter
Team charter is prepared, Refer Table 3.
Critical to Quality (CTQ) and Critical to Process (CTP)
Refer Fig. 8.

CTQ and CTP chart
Supplier Input Process and Output Customer (SIPOC)
To emphasize putting the needs of the customer foremost, the process information is filled in starting with the customer and working upstream to the supplier.
Measure
In this phase, data are gathered and analyzed that describe with precision and accuracy, what is happening, what is current or baseline, and level of performance of the process that creates the problem. It also produces some preliminary ideas of possible causes for problem.
The goals of the measure phase are as below:
-
Identify customers and their needs.
-
Derive specific requirements to the system.
-
Determine the corresponding output measures and their target values and tolerances.
Gauge Repeatability and Reproducibility (GRR)
ANOVA gauge R&R measures the amount of variability induced in measurements by the measurement system itself and compares it to the total variability observed to determine the viability of the measurement system.
There are four steps involved in the measure phase:
-
Preparation of data collection plan;
-
Measurement systems analysis (MSA) MSA is an experimental and mathematical method of determining how much the variation within the measurement process contributes to overall process variability. There are five parameters to investigate in an MSA: bias, linearity, stability, repeatability, and reproducibility. According to Automotive Industry Action Group—AIAG (2002), a general rule of thumb for measurement system acceptability is
-
Fewer than 10% error is acceptable.
-
10–30% error suggests that the system is acceptable depending on the importance of application, cost of measurement device, cost of repair, and other factors.
-
Over 30% error is considered unacceptable, and you should improve the measurement system. AIAG also states that the number of distinct categories the measurement systems divides a process into should be greater than or equal to 5.
In addition to percent error and the number of distinct categories, you should also review graphical analyses over time to decide on the acceptability of a measurement system (Table 4).
Table 4 SIPOC -
-
Calculation of processes capabilities;
-
Initial graphical analysis.
Gauge R&R Study
Preparation of Data Collection Refer Table 5.
R&R Summary
X-bar Chart
the X-bar chart is a type of Shewhart control chart that is used to monitor the arithmetic means of successive samples of constant size, n. This type of control chart is used for characteristics that can be measured on a continuous scale (Refer Fig. 9).

X-bar chart
R Chart
In statistical quality control, the R chart is a type of control chart used to monitor a variable’s data when samples are collected at regular intervals from a business or industrial process (Refer Figs. 10, 11).

R chart

Plot of response obtained for sample parts
Plot of response obtained for sample parts
Refer Fig. 11
Calculation of Six Sigma
-
Cp and Cpk are the process capability indices,
-
Cp—Measures the variation, i.e., how close the measures readings,
-
Cpk—Measures the center tendency, i.e., how close the measures readings to Nominal,
-
Cp = is done to measure the process on both sided specifications,
-
Upper SU and Lower SL,
-
Cp = SU − SL/6 sigma,
-
Cpk measures the variations between T (target) and one specification,
-
(SU or SL) (k stands for shift),
-
Cp = SU − T/3 sigma,
-
Cp = T − SL/3 sigma.
Refer Table 6.
Analysis
The analysis phase consists of three main steps: Refer Table 7
-
Identifying possible causes;
-
Process and multivariate analysis;
-
Verification through hypothesis tests.
Qualitative Analysis
Cause and Effect Diagram Refer Fig. 12 and Table 8.

Fish bone diagram
Final Model
Reducing insignificant factors one by one. To Optimize the Drilling and Reaming Process. To achieve taper within 171.00 ± 0.1 mm (Refer Tables 9, 10).
-
Design of Experiment Design of experiments (DOE) is a systematic, rigorous approach to engineering problem solving that applies principles and techniques at the data collection stage so as to ensure the generation of valid, defensible, and supportable engineering conclusions. In addition, all of this is carried out under the constraint of a minimal expenditure of engineering runs, time, and money.
-
Multivary Analysis Interpretation: Data show that there is no such variation from OPERAROR TO OPERATOR. Variation is component to component and shift wise. So further analysis can be carried out to know the cause of variation from component to component (Figs. 13, 14, 15, 16).
Fig. 13 
Operator to operator variation
Fig. 14 
Component to component variation
Fig. 15 
Taper vs. drilling feed
Fig. 16 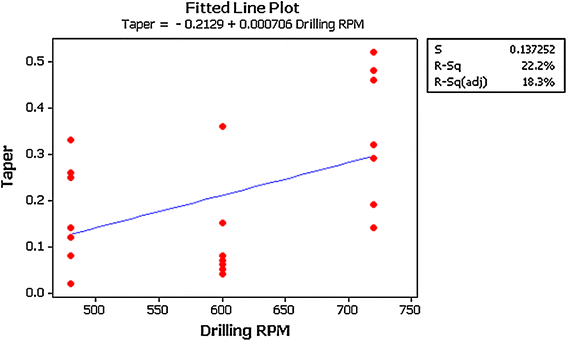
Taper vs. drilling RPM


Regression Analysis
The regression equation for Taper versus Drilling feed and Drilling RPM becomes
Taper = −0.558 + 0.00430 Drilling Feed + 0.000720 Drilling RPM
Design of Experiment for Taper in Cross-Hole Dia 12 mm in Gear Box Housing
-
Problem Definition Taper is higher than the standard value 197.0 ± 0.1 mm w.r.t. to differential mounting face.
-
Objective To Optimize the Drilling and Reaming process to achieve taper within 171.00 ± 0.1 mm.
Estimated Coefficients for Taper using data in uncoded units
TAPER = −0.029052 − 0.000135 Drilling RPM + 0.00334 Drilling Feed + 0.000437 Reaming RPM − ``0.0005833 Reaming Feed
Relation with Factors
Relation with Drilling RPM, feed, and Reaming RPM, feed is as shown in Fig. 17.

Relation with factors
Improve
The aim of the improvement phase is to examine the reason which appears during the analysis phase and to generate a set of solution to improve the performance of the process.
Process Optimize
Optimize setting Drilling RPM: 480, Drilling Feed: 43 mm/min, Reaming, RPM: 360, Reaming Feed: 148 mm/min.
This Setting Will Give Mean Response Y = 0.1206 and Achievement of Target D = 99.29%.
Six Sigma Calculations After Process Optimize
Sigma Level Calculation
Control
Usually, the phase is regarded as the most important phase of the Six Sigma methodology. At this phase, all the improvement that is realized at the preceding four phases is investigated, and their stability should be maintained.
-
Use of Digital Vernier Caliper to check the Taper.
-
Hole A and Hole D on the component are the point to check the taper.
-
Drill 11.5 mm to be changed in every alternate day in the A-shift.
-
Block search is standardized as per the fixture and display near the operator panel.
Full Proofing
Error proofing for zero defect production
-
Poka yoke is made to reduce the chips deposition on component resting pad’ (unwanted pad removed from fixture).
-
Feed and RPM cannot be increased by the operator using feed over ride knob.
-
Automatic program will be called as per the fixture (1 or 2) inside the machine.
-
Plc has modified to conform operator second time when he will go for reworking or start program intermittently.
-
Maintaining the gap in between fixture and component to avoid fouling.
Calculation of Cost of Quality
After successful implementation of Six Sigma, Financial Benefits observed are
-
Earlier Rejection was about 7800PPM, i.e., 4.5 components/month that was reduced to less than 300 PPM.
-
Cost/component = Rs 4400/-
-
Potential Saving/Annum = 4.5X4400X12 = Rs 237600/-
Conclusion
-
Many service companies avoid conducting cost of poor quality analyses because they find that the cost of conducting the evaluation and dealing with its intangible elements outweighs the benefits. However, if these companies take a more careful, penetrating look at their business processes, they will continue to figure out new areas of improvement (Fig. 18).
Fig. 18 
Controlling and check the taper
-
The cost involved in fulfilling the gap between the desired and actual product/service quality. It also includes the cost of lost opportunity due to the loss of resources used in rectifying the defect.
-
Six Sigma project benefits that allow you to do the same amount of business with less employees (cost savings) or handle more business without adding people (cost avoidance).
-
Six Sigma project benefits such as reduced time to market, cost avoidance, lost profit avoidance, improved employee morale, enhanced image for the organization, and other intangibles may result in additional savings to your organization but are harder to quantify.
-
In this case, successful implementation of Six Sigma leads to Potential Saving/Annum of Rs 237600/-

References
R. Andersson, H. Eriksson, H. Torstensson, Similarities and differences between TQM, Six Sigma and lean. TQM Mag. 18, 282–296 (2006)
R. Banuelas, J. Antony, Critical success factors for the successful implementation of Six Sigma projects in organisations. TQM Mag. 14, 92 (2002)
T. Bendell, A review and comparison of Six Sigma and the lean organizations. TQM Mag. 18, 255 (2006)
G. Byrne, Ensuring optimal success with Six Sigma implementations. J. Organ. Excell. 22, 43 (2003)
H.J. Harrington, Poor-Quality Cost (CRC, Boca Raton, 1987)
H. Ali et al., Classical model based analysis of cost of poor quality in a manufacturing organization. Afr. J. Bus. Manag. 6(2), 670–680 (2012)
Author information
Authors and Affiliations
Corresponding author
Rights and permissions
About this article

Cite this article
Surange, V.G. Implementation of Six Sigma to Reduce Cost of Quality: A Case Study of Automobile Sector. J Fail. Anal. and Preven. 15, 282–294 (2015). https://doi.org/10.1007/s11668-015-9927-6
Received:
Published:
Issue Date:
DOI: https://doi.org/10.1007/s11668-015-9927-6