
Abstract
An experimental study has been performed to investigate the effect of the biocalcification process on the microstructural and the physical properties of biocemented Fontainebleau sand samples. The microstructural properties (porosity, volume fraction of calcite, total specific surface area, specific surface area of calcite, etc.) and the physical properties (permeability, effective diffusion) of the biocemented samples were computed for the first time from 3D images with a high-resolution images obtained by X-ray synchrotron microtomography. The evolution of all these properties with respect to the volume fraction of calcite is analysed and compared with success to experimental data, when it is possible. In general, our results point out that all the properties are strongly affected by the biocalcification process. Finally, all these numerical results from 3D images and experimental data were compared to numerical values or analytical estimates computed on idealized microstructures constituted of periodic overlapping and random non-overlapping arrangements of coated spheres. These comparisons show that these simple microstructures are sufficient to capture and to predict the main evolution of both microstructural and physical properties of biocemented sands for the whole range of volume fraction of calcite investigated.
1 Introduction
Several soil reinforcement techniques were developed in the last 50 years, with the huge development that has occurred in the industry such as chemical grouts, mechanical compactions, rigid inclusions and jet grouting. These techniques show limitations for specific cases (great depth situations, old and sensitive structures); it is also considered as money and time-consuming techniques and harmful technologies for the environment [9]. In recent years, the application of biological processes in geotechnical engineering has received more attention. Different biological processes have been recommended to overcome all the drawbacks of the classical techniques of soil improvements, such as biogas processes, biofilm formation and biocementation [11]. The microbiologically induced calcite precipitation (MICP) technique represents one of the most promising techniques of biocementation based on the precipitation of calcite by biochemical reactions. These reactions are governed by a strong ureasic activity of bacteria such as Sporosarcina pasteurii, which can decompose the urea (NH2)2CO into ammonium (NH4 +) and carbonate (CO −23 ). This chemical component can participate in the composition of the final product (calcite: CaCO3) (Eq. 1). This phenomenon can be reproduced within soils, by the injection of the ureasic bacteria and chemical reactants (urea + calcium source).
This phenomenon plays a considerable role in increasing the mechanical strength of the treated soils, by bounding soil grains together with the precipitation of the calcite. Different studies have been performed to explore the increase in the mechanical strength of the soils treated by MICP [1, 7, 12, 13, 19, 21, 22, 32]. These studies show a significant increase in shear strength of biomediated soils, where the calcite precipitates preferentially at the inter-granular contacts [1, 15], which increase the amount of the cohesive contact surface between grains and thus the cohesion and the strength of the soil. On the other hand, the precipitation of calcite decreases the porosity of the soil specimen and changes its microstructural properties (pore structure and geometry, specific surface area) depending on the procedure of injection, which influences the deposition manner of calcite in pores. These changes lead to a slight decrease in the physical properties (permeability, effective diffusion) for a small amount of calcite, depending mainly on the quantity of injected bacteria and chemical reactants [19, 33].
Increasing the shear strength of a soil is highly desirable in geotechnical engineering. However, the permeability reduction could be an advantage or drawback depending on its application. For example, decreasing the permeability in order to control the infiltration of water into soil slope can minimize the risk of landslide. However, its reduction may not be favourable for controlling failure induced by earthquake in liquefiable soils [20]. Several applications of this process have proven their worth in geotechnical engineering, such as the reinforcement of dams against seepage and internal erosion, where the MICP process improves the critical shear stress and reduces the erodibility of sand–clay mixtures with wide gap, by cementing grains with each other, without a significant decrease in permeability [16]. Liquefiable soils could be reinforced with the biocementation; in [20], Montoya proved that the biocementation increases the cyclic strength and stiffness of sand and provides significant improvement against liquefaction.
The evolution of the physical and mechanical properties is related directly to the changes of the microstructure of the biocemented sand. However, a clear relation between the change in the microstructure and these properties is not yet established. Several investigations have been performed in different works using different techniques of observations at the microscale (transmission light optical microscopy, scanning electron microscopy and energy-dispersive X-ray spectroscopy), in order to explore in a qualitative manner the spatial distribution of calcite, as well as the calcium carbonate morphology. These studies show that the calcite appears in different morphological natures around individual microbes or their aggregates and deposits preferentially in particle–particle contacts with thin layer on the grain surface. This illustrates the affinity of bacteria to deposit in these regions of porous media [8, 10, 15, 18, 28]. Al Quabany and Soga in [1] show that the protocol of injection, in particular the urea–calcium chloride concentrations, has an influence on the distribution, the shape and the size of calcite crystals. Lower concentration gives small calcite crystals with great distribution all around the grains. These results were confirmed by [30], showing that crystals are found to precipitate in two forms: smaller single particles distributed uniformly on the surface of grains for small concentrations of reactants, and single mesocrystals which have bigger size for large concentrations of reactants.
The exploration in a quantitative way of the treated soils microstructure is necessary to understand the evolution of the mechanical and physical properties of the biocemented soils. Different alternative techniques exist to explore these properties in a porous media. The rapid developments of imaging and computer technology make the X-ray microtomographic observations expanding fast in the geomaterials field. The use of this technique permits to visualize in a quantitative and precise manner the microstructure of scanned objects, which gives more rigorous and reliable results for the properties inferred from the 3D images. Few works have been addressed using X-ray microtomography to study the microstructure of biocemented sand such as Tageliafiri et al. [29], where they perform in situ triaxial test on biocemented sand. In this work, the chosen resolution of 15 µm is not sufficient to capture the shape and the distribution of the calcite at the pore scale.
In the present work, different sand specimens with various calcification levels have been observed in the European Synchrotron Radiation Facility (ESRF) at a very high resolution in order (1) to observe the distribution of the calcite at the pore scale and (2) to characterize the evolution of the microstructural (volume fraction of calcite, specific surface area, etc.) and physical properties (permeability tensor, effective diffusion tensor) of biocemented sand as a function of the cementation level. The numerical results computed on representative elementary volumes extracted from the 3D images are compared with experimental data, analytical models (self-consistent estimates) and numerical values obtained on simple periodic arrangements of coated spheres. The paper is organized as follows: Section 2 is devoted to “Materials and methods”: sample preparation, permeability and calcite mass fraction measurements, 3D images acquisition and treatment, computed microstructural and physical properties. In Sect. 3, the properties computed from the 3D images are presented, discussed and compared with experimental data and analytical estimates.
2 Materials and methods
2.1 Biocemented samples preparation
Two solutions have been prepared for the biocementation process: (1) bacterial solution which contains one optical density (1OD600) of Sporosarcina Pasteurii provided under a dried form by Soletanche Bachy (Soletanche Bachy Entreprise, Rueil-Malmaison, France) with 3 g of NaCl dissolved in one litter of commercial water, in order to increase the potential attachment of bacteria to soil grains and (2) reactant solution (calcifying solution) which contains 1.4 moles of urea and the same amount of calcium chloride. Fontainebleau sand (NE34) was used in this experimental investigation of the biocementation procedure. The characteristics of this sand are listed in Table 1.
Eight sand columns with the same diameter of 68 mm and different heights (4 columns have a height of 560 mm and 4 columns of 300 mm) were prepared with a pluviation technique in the plastic tubes of the injection system, as shown in Fig. 1. These columns were prepared with a relative density of 80%, between two filter papers and small layers of 20 mm of coarse sand, in order to homogenize the water flow injection. A saturation phase of each column was adopted before starting the treatment injections. After this phase, an injection of one pore volume of the bacterial solution was performed from the bottom to the top with a flow rate of 0.2 mm/s. After one hour, two injections of calcifying solution of one pore volume were carried out with a flow rate of 0.14 mm/s and with a time offset of 10 h between these two injections. After the second treatment, two pore volumes of flushing water were injected inside columns with a flow rate of 0.14 mm/s, in order to expel all the process residues. This injection procedure usually leads to columns with a mass fraction of calcite of about 5–6%. This injection was repeated twice on eight columns in order to reach higher mass fractions of calcite, typically between 10 and 12%.

Injection protocol for biocementation process
After the treatment procedure, each column “i” (i = 1–8) was cut in two or three samples depending on its total height. The columns with an overall height of 560 mm were divided into three triaxial samples. For the column “i”, these samples are named “iT” (top), “iM” (middle) and “iB” (bottom) (see Fig. 2). The columns of height 300 mm were divided into two triaxial samples only (top and bottom). Each triaxial sample has a height of 140 mm suitable for standard drained triaxial tests. After the triaxial test, sub-samples with a volume of around 500 mm3 were taken at the top and the bottom of each triaxial sample and are denoted “iTT”, “iTB”, “iMT”, “iMB”, “iBT” and “iBB”. These sub-samples were used in order to measure the mass fraction of calcite along the column using the Bernard calcimeter. Unfortunately, these volumes are too big to be used for the X-ray observation. Therefore, sub-samples with a volume of around 10 mm3 were taken at the same position as the previous ones to characterize the distribution of the calcite at the pore scale by X-ray microtomography.

Sampling of the biocemented columns of sand
2.2 Permeability measurement
The permeability for each triaxial sample was measured in a triaxial cell, using a Marriott system, based on the measurement of the flow rate through the sample under a constant hydraulic head. During the permeability measurement, a confining pressure of 100 kPa is applied to stick the membrane on the sand sample and to avoid lateral circulations of water between the membrane and the sand sample. These measurements have been repeated more than three times for each sample, in order to ensure a good precision and reproducibility.
2.3 Mass fraction of calcite
The mass fraction of calcite of each sub-sample was measured using the Bernard calcimeter [24]. It is based on the dissolution of the calcite with HCl acid and the measurement of the released CO2, which has the same molar quantity as CaCO3 (Eq. 2).
The calcite measurements with the Bernard calcimeter were repeated more than three times for each sub-sample, in order to ensure a good accuracy of the measurement (less than 10%) of the deposited calcite within the sand samples.
2.4 Microstructural and physical properties computed on 3D images
2.4.1 Image acquisition and treatment
3D images of some biocemented sand sub-samples (see Table 2) were obtained using X-ray synchrotron microtomography on the ID19 beamline at the ESRF in Grenoble. To obtain such 3D images, the sub-sample is fixed between the parallel beam line and the detector (FReLoN CCD), which is characterized by fast data saving and a low noise. A resolution of (0.65 μm)3/voxel was chosen in order to visualize precisely the calcite crystals, which have a typical size of 10 micrometers (see SEM images in Fig. 3). The field of view is (3250 × 3250 × 2000 voxels), i.e. (2,11 × 2,11 × 1,3 mm3) to obtain 3D images large enough to be representative of the material. The transmitted rays were recorded for 1800 projections. Later, these images were collected to reconstruct numerically the internal microstructure of the sample using a filter back-projection algorithm. Due to weak difference in absorption between the calcite and the sand, a phase retrieval approach was used [25]. The obtained 3D images represent a 3D map that is proportional to the density of each phase within the scanned sample. Figure 4 shows some 2D views of three sub-samples after reconstruction. We can distinguish the three phases: air (dark phase), sand grain (grey phase) and calcite (light grey phase). The chosen approach allows increasing the contrast between both phases with a slight brightness of calcite, which is coating sand grains (Fig. 4). In the case of pure absorption images, it would not have been possible to distinguish between calcite and sand, because of the similar absorption coefficients of the two phases, which is related to their densities (ρ s = 2650 kg/m3, ρ c = 2710 kg/m3).

SEM observation of the biocemented sand (sub-sample 2 MB)

X-ray tomography of biocemented sand sub-samples (column 2, a 2BT, b 2MB, c 2TT)
In order to compute some microstructural quantities, the 3D images in grey levels must be treated to separate the three phases (pore, sand and calcite) [27]. The typical grey-level histogram of an image is presented in Fig. 5. It shows that the pore and the sand phases can be easily separated by a simple thresholding [23]. By contrast, the separation of the calcite and the sand phases is not straightforward, because of the similar density of these two constituents. In the present work, the separation of these two phases has been performed by using the first threshold (between sand and pore) and assuming that the grey-level histogram of the sand phase follows a Gaussian distribution to define the second threshold by symmetry (between sand and calcite) following the method proposed by [23]. After the treatment of all the slices (2D images), the 3D image of each sample is obtained (Fig. 5). By visual observations, the partial volume effect has no significant effect because of the high quality of the obtained images and the large contrast between the solid (calcite and sand) and the void.

Image treatments applied on 2D images and the corresponding 3D volume
2.4.2 Computed microstructural properties
Microstructural properties, such as the porosity (ϕ), the volume fraction of calcite (f c), the correlation length (l h), the overall specific surface area (SSA) and the specific surface area of calcite (SSAc), can be computed on 3D volumes extracted from the total segmented 3D images. These volumes must be large enough to be representative of the material. For that purpose, hereafter, two methods have been used [17]:
-
In the first one, the representative elementary volume (REV) is estimated by performing a systematic analysis of the volume size influence on the computed properties. The REV is given by the size of the volume for which the fluctuations of the effective property become limited. For that purpose, each microstructural property was computed on volumes of size (l × l × l mm3), where l varies from 0.1 to 1.3 mm. In the following, this method is referred as the “REV approach”.
-
In the second one, the effective property under consideration is computed by taking the average of the apparent properties of a large number of non-overlapping sub-volumes of the same size [17, 26]. In the present case, sub-volumes of 4003 voxel (of about one sand grain) distributed over the total volume have been chosen for the computation of the effective properties from the 3D images. This choice was taken after testing different configurations of different sizes and numbers of sub-volumes in order to find the most effective configuration (from the points of view of accuracy and computation time). In the following, this method is referred as a “statistical approach”.
As already mentioned, five microstructural properties have been computed on the 3D images of biocemented samples:
Porosity (ϕ) and volume fraction of calcite (f c ): These two quantities are computed by a simple counting of voxels of each phase within the 3D images. The mass fraction of calcite (mc) can be easily deduced from these two quantities, assuming that the density of the sand and the calcite is ρ s = 2650 kg/m3 and ρ c = 2710 kg/m3, respectively.
-
Correlation lengths (l h): For each image, we can compute the following two-point correlation function for the air phase: S 2(r) = <I(x) I(x + r) > where r is a vector, I(x) is the characteristic function of the air phase (I(x) = 1 if x lies in the air phase and 0 otherwise) and the angular brackets denote the volume average. In general, S 2(r = 0) = ϕ where ϕ is the porosity; S 2(r) decreases with increasing r and tends towards an asymptote defined by S 2(r = l h) = ϕ2, where the norm of l h is defined as the correlation length. This correlation length can be computed for any direction of the vector r within the 3D space. These correlation lengths are often used to characterize the typical size of the heterogeneities within the microstructure and to quantify its anisotropy [5, 26, 31].
-
Total specific surface area (SSA) and specific area of calcite (SSA c): Several numerical methods have been proposed in the literature to compute the specific surface area from 3D binary images (the stereological approach, the marching cubes approach, and the voxel projection method [14]). In this work, the stereological approach is used. This method is based on the averaging of the number of interface points per unit length computed in the three directions of the 3D image [14]. This method has been used to compute:
-
The total specific surface area (SSA) is defined as SSA = (S g + S c)/V, where S g and S c are the surface area of the grain and the calcite in contact with the voids (of the air or fluid), respectively, and V = L 3 is the volume under consideration (Fig. 6).
Fig. 6 
Total specific surface area: SSA = (S g + S c)/V; specific surface of calcite: SSAc = S c/V
-
The specific surface of calcite (SSAc) is defined as SSAc = S c/V. This specific surface area of calcite characterizes the surface of calcite in contact with voids. This area will play an important role in the durability of the biocementation process.
-

In order to evaluate the influence of the biocementation process on the microstructural properties, the porosity, the correlation lengths and the total specific surface area (SSA) were also computed on the same 3D images without calcite, i.e. by replacing the calcite voxels by pore voxels within the 3D images.
Figure 7a presents the typical evolution of the two-point correlation function S 2(x) along x for one image of the sub-sample “2 MB” with and without calcite. This figure shows that the correlation length l h is the order of 75 μm without calcite. This correlation length characterizes the size of the “heterogeneity” within the sample along x. This correlation length slightly increases with the biocementation process, due to the deposition of the calcite over sand grains. This correlation length has been computed for various angles within the three main planes (x, y), (y, z) and (x, z). The obtained results (red marks in Fig. 7b, c) were then fitted by an ellipsoid in order to determine the three principal correlation lengths with and without calcite. In the present case, l h_max/l h_min is close to 1 (1.2 without calcite and 1.46 with calcite). This result, as well as Fig. 7b, c, shows that the microstructure of the sand sample before and after treatment is almost isotropic. Similar results have been obtained on all the observed sub-samples whatever the volume fraction of calcite.

a Two-point correlation function S 2(x) for the air phase computed on a 2D image of the sub-sample “2 MB”. Correlation lengths computed on the total 3D volume of the sub-sample “2 MB” within the three main planes (x, y), (y, z) and (x, z) b without calcite, c with calcite. The green surface was adjusted on the numerical values (red mark)
Figure 8 presents the microstructural properties (volume fraction of calcite, porosity, SSA and SSAc) computed on the sub-sample “2 MB” using both the REV and statistical approaches. The numerical results obtained using the “REV approach” (Fig. 8a, c, e, g) show that all the computed properties tend towards a constant value when the volume size is larger than (1 × 1 × 1 mm3), i.e. larger than around (10 × 10 × 10) l 3h (1000 heterogeneities). Figure 8b, d, f, h presents the evolution of the computed properties with respect to the number of sub-volumes. In this figure, “M” the relative error, defined as (MSA − MRA)/MRA, where the subscripts SA and RA refer to the value computed following the statistical approach and REV approach, respectively, is also reported for each microstructural property. The value MRA is the computed value on a volume of (1 × 1 × 1 mm3). We can observe that in general, this relative error between the two approaches is smaller than 5% when the number of sub-volumes is greater than 16. Similar results have been obtained on all the sub-samples.

Microstructural properties computed on the sub-sample “2 MB” by using the REV approach (a, c, e, g) and the statistical approach (b, d, f, h)
2.4.3 Physical properties
The permeability tensor (K) and the effective diffusion tensor (D) of the biocemented samples have been computed by solving on 3D images specific boundary value problems arising from the periodic homogenization process [2, 4]. The knowledge of these two effective physical properties is important in order to describe the transfer through the soil during and after the process, or to study the stability of the reinforcement. These two tensors have been computed on binarized 3D images by using the GeoDict software (see [3, 6] for more details) and following the statistical approach only, which is more efficient (short computation time, less memory resources are needed). For a better accuracy, even if 16 sub-volumes could have been sufficient (according to Sect. 2.4.2), the computations have been performed on a maximum of 27 sub-volumes.
Figure 8a and b shows the components of the permeability tensor and the dimensionless effective diffusion tensor (D/D m, where D m is the molecular diffusion coefficient) of the sub-sample 2 MB mentioned previously. The sample appears to be isotropic (Fig. 9c, d) because:

Evolution of the physical properties computed on the 3D images of the sub-sample “2 MB” versus the number of sub-volumes under consideration: a permeability components, b dimensionless effective diffusion components, c mean permeability, d mean dimensionless effective diffusion
-
The off-diagonal terms are negligible compared to the three diagonal ones
-
The three diagonal components of the permeability and diffusion tensor are almost identical, and consequently, these two properties can be considered as isotropic.
This result is consistent with the isotropy of the microstructure observed using the correlation lengths. The values of the properties under consideration stabilize after a small number of sub-volumes greater than 10 sub-volumes. According to these results, in the following the effective value of each property (permeability, effective diffusion) is taken as the mean of the three diagonal components computed on 27 sub-volumes. The same comments apply for the properties computed on images where the calcite has been replaced by voids (labelled “without calcite” in Fig. 8c, d) and are valid for all the sub-samples under consideration in this work.
3 Results and discussion
In what follows, all the results computed on the 3D images correspond to the value obtained by using the statistical approach considering 27 sub-volumes of 4003 voxels.
3.1 Microstructural and physical properties from 3D X-ray microtomography
3.1.1 Initial porosity and mass fraction of calcite
-
Porosity The initial porosity of the sand columns has been measured during the preparation of the columns; the corresponding values are presented in Table 2 for each sand column. The experimental values of the initial porosity measured on the entire column can be compared with the ones computed on 3D images of the sub-samples extracted from the same column (Fig. 10a). Figure 10a shows a good agreement between both the experimental and numerical values. The observed differences can be mainly explained by the difference of scales of the considered samples: the total porosity of columns corresponds to a volume of 2 × 105 mm3, whereas for 3D images, the volume of the sub-samples is of about 2 mm3, which represents a local measurement of the porosity.
Fig. 10 
Experimental versus the numerical results computed on 3D images: a initial porosity and b mass fraction of calcite. The vertical error bar represents the minimum and the maximum of four measurements
-
Mass fraction of calcite: The measurements of the mass fraction of calcite show a non-uniform distribution of the amount of the deposited calcite along the sand columns (Table 2), which can be due to several parameters: injection velocity, bacteria and ingredients concentration. In general, this distribution is characterized by a maximum of calcification in the middle of the columns as listed in Table 2, and in Fig. 4, which presents 2D images obtained by X-ray microtomography from the same column (2) at different positions (bottom, middle and top). Figure 10b presents a comparison between the mass fractions of calcite deduced from the 3D images with the ones measured using Bernard calcimeter. This figure shows a good agreement between both experimental numerical values. Once again, the observed differences can be mainly explained by the difference in volume size of the samples used for 3D imaging (2 mm3) and in Bernard calcimeter (500 mm3). Despite these differences, this comparison validates the image treatment proposed in Sect. 2.4.1 and more precisely the proposed methodology for the separation between the two overlapped phases, which is based on the assumption of a Gaussian distribution of the grey level for the sand phase

3.1.2 Correlation lengths
The mean correlation length, defined as the mean of the major axis of the ellipsoid fitted on numerical values (see Sect. 2.4.2), has been computed on the 3D images of all the sub-samples under consideration. In the absence of calcite, we found that this mean correlation length associated with the grain sand and pores is about 85 ± 8 μm. Figure 11 shows the evolution of the ratio between mean correlation lengths before and after the MICP treatment with respect to the computed volume fraction of calcite (f c). As already observed in Fig. 7, this ratio increases almost linearly with increasing the volume fraction of calcite and indicates, in first approximation, that the mean thickness of the calcite layer which covers the “heterogeneities” is the order 6–7 microns in average when f c = 15%. This thickness represents typically one layer of calcite crystals, as shown in Fig. 3.

Evolution of the ratio of the mean correlation lengths with and without calcite versus the volume fraction of calcite
3.1.3 Total specific surface area (SSA) and specific area of calcite (SSAc)
-
Total specific surface area (SSA): The evolution of the total specific surface (SSA) area is not significant with the increase in the quantity of the deposited calcite. Figure 12 shows the evolution of the ratio of the SSA with and without calcite versus the volume fraction of calcite. This figure shows that this ratio, which ranges between 0.8 and 1.15, slightly increases when f c < 10% approximately and then decreases. The slight increase can be interpreted as the development of a rough layer created by the precipitation of calcite on the grain surface, without modification of the number of contacts between grains. For f c > 10%, the rough surface created by the deposition of calcite on the grain surfaces is balanced by the disappearance of surfaces induced by the creation of new contacts between grains, leading to a decrease in the SSA.
Fig. 12 
Evolution of the ratio of the SSA with and without calcite versus the volume fraction of calcite computed on 3D images. Comparison with analytical estimate (SMC) and numerical values (BCC, FCC)
-
Specific area of calcite (SSA c ): Figure 13 presents the evolution of the ratio between the specific surface area of calcite (SSAc) and the total specific surface area (SSA) of the cemented sand versus the volume fraction of calcite. According to the definition of SSAc and SSA (see Sect. 2.4.2), this ratio is written: SSAc/SSA = (S c/S g)/(1 + (S c/S g)), where S c and S g are the surface area of the grain and the calcite in contact with the voids. This ratio, which characterizes the percentage of the initial surface of sand covered by the calcite, is equal to 0 when S c = 0 (no calcite), to 0.5 when S c = S g and 1 when S g = 0, i.e. sand grains are totally covered with calcite. The figure shows that when f c < 6% approximately, this ratio increases almost linearly with increasing the volume fraction of calcite and then seems to reach a constant value around 0.4–0.5, i.e. the calcite covers between 40 and 50% of the sand surface. As already mentioned, the injection procedure is repeated twice to get columns with a high mass fraction of calcite. The above results seem to show that during the second injection procedure, the bacteria are preferably attached on the calcite crystals already precipitated during the first injection procedure.
Fig. 13 
Evolution of the ratio SSAc/SSA versus the volume fraction of calcite computed on 3D images


3.1.4 Permeability and effective diffusion
-
Permeability: Figure 14 shows the evolution of the permeability ratio of the same sub-sample with and without calcite versus the volume fraction of calcite. A nonlinear decrease in permeability of the cemented sand was found with the increase in the cementation level (Fig. 14). This reduction, which is about 70% for a volume fraction of calcite of 14%, is mainly due to the reduction of the porosity of the porous media and the change in the microstructural properties (SSA, tortuosity) with the calcite deposition. Figure 14 shows also a good agreement between the permeability computed on the 3D images of sub-samples and the ones measured on triaxial samples. The slight differences observed can be mainly explained by the difference in volume size of the sample used for 3D imaging and for triaxial tests, i.e. the heterogeneity in cementation of the sand columns and potential clogging localized in the porous structure generated by the calcite precipitation within the pores.
Fig. 14 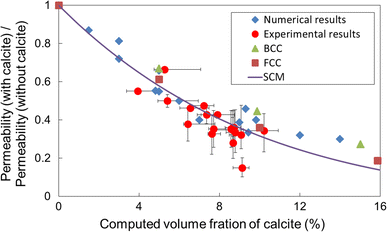
Evolution of the permeability ratio of the same sub-sample with and without calcite versus the volume fraction of calcite computed from 3D images. Comparison with experimental values, analytical estimate (SCM) and numerical values (BCC, FCC). The vertical and horizontal bars represent the minimum and the maximum values of three different measurements
-
Effective diffusion: The evolution of the effective diffusion ratio of the same sub-sample with and without calcite versus the volume fraction of calcite is presented in Fig. 15. This ratio decreases almost linearly when increasing the volume fraction of calcite, i.e. when decreasing the porosity. For a volume fraction of 14%, the effective diffusion is reduced by around 50%.
Fig. 15 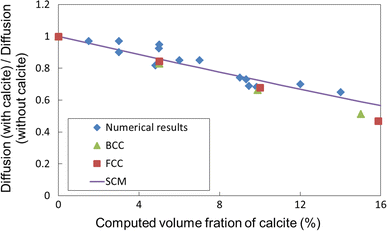
Evolution of the effective diffusion ratio of the same sub-sample with and without calcite versus the volume fraction of calcite computed from 3D images. Comparison with analytical estimate (SCM) and numerical values (BCC, FCC)


3.2 Comparison with analytical estimates and numerical values
3.2.1 Models
The prediction of the physical and the microstructural properties from basic morphological information on the porous media is available nowadays. The periodic homogenization method (HPM) represents one of the most important approaches, to go from the microscopic to the macroscopic description of the material [2, 4]. It requires a minimum of information on the porous structure, for instance in the case of a granular material, on the shape, size and arrangement of grains. The self-consistent method (SCM) represents an alternative approach, which does not require detailed information on the morphology of the microstructure and thus enables to obtain analytical estimates. In the following, we proposed to compare our numerical and experimental results obtained on biocemented soils (see Sect. 3.1) with numerical results and analytical estimates obtained for simple arrangements of coated spheres with calcite. More precisely, our results are compared:
-
with numerical values computed using the HPM method [4] on two periodic arrangements—body-centred cubic (BCC) and face-centred cubic (FCC)—of overlapping coated spheres of same radius. The representation of the calcite deposition in the sand sample is simulated by the growth of a uniform layer on the spheres in both BCC and FCC microstructures (Fig. 16a, b).
Fig. 16 
Periodic lattices of coated spheres with calcite: a body-centred cubic arrangement (BCC), b face-centred cubic arrangement (FCC), c bi-composite sphere constituted by a coated grain Ωs (sand (Ωg) + calcite) surrounded by a spherical shell Ωf full of fluid
-
with analytical estimates derived by the SCM method. In that case, the microstructure is seen as a random assemblage of non-overlapping coated spheres surrounded by a fluid shell (bi-composite spherical pattern) (Fig. 16c). The analytical estimates for the permeability and the effective diffusion can be easily deduced from the ones presented in Boutin and Geindreau [4]. The permeability estimate is written
$$ K = \frac{{R^{2} }}{3}\left[ { - 1 + \frac{{2 + 3\beta^{5} }}{{\beta \left( {3 + 2\beta^{5} } \right)}}} \right] $$(3)where K(f c) is the intrinsic permeability (m2), β = R s/R where R and R s are the radius of the bi-composite sphere and the solid phase, respectively. This factor can be expressed as a function of the current porosity (Φ) by \( \beta = \sqrt[3]{1 - \varPhi } \) with Φ = Φ0 − f c, where Φ0 and f c are the initial porosity and the volume fraction of calcite, respectively. The effective diffusion estimate reads:
$$ D = D_{\text{m}} \frac{2\varPhi }{3 - \varPhi } $$(4)where D m is the molecular diffusion coefficient.

3.2.2 Correlation lengths and total specific surface area (SSA)
In Fig. 11, for each microstructure, the ratio between the radius of the grain with and without the calcite layer with respect to the volume fraction of calcite is reported. This figure shows a good agreement between numerical values of the correlation lengths ratio computed on 3D images and this ratio whatever the volume fraction of calcite. This result confirms our previous comments about the thickness of the calcite layer, which covers the sand grain.
For each microstructure, the total specific surface area (SSA) can be analytically estimated. These analytical estimates are based on the calculation of surface area of the spheres for each structure taking into account the evolution of the contact surfaces as a function of the growth of the calcite layer. The initial porosity of all the microstructures is supposed to be about 37%, as the experimental one. The evolution of the SSA with respect to the volume fraction of calcite for the three microstructures under consideration is presented in Fig. 12. For f c < 10% approximately, this figure shows a good agreement between all the results from 3D images and simple arrangements of coated spheres. For f c > 10% approximately, the SSA of the bi-composite spheres still increases with increasing the volume fraction of calcite, which is not consistent with numerical values computed on 3D images. By contrast, Fig. 12 shows that the SSA of both BCC and FCC arrangements of coated spheres decreases when the volume fraction is typically larger than 8 and 12%, respectively. Indeed, when this volume fraction is reached, the spheres start to overlap and new contacts appear, and consequently, the SSA decreases. All these results confirm that the particular evolution of the SSA with respect to the volume fraction of calcite is strongly linked to the creation of new contacts within the microstructure.
Finally, let us remark that these simple microstructures suppose that SSAc/SSA = 1 for the whole range of considered porosities, which is not consistent with our numerical results presented in Fig. 13.
3.2.3 Permeability and effective diffusion
The evolution of the permeability and the effective diffusion with respect to the volume fraction of calcite for the three microstructures under consideration is presented in Figs. 14 and 15, respectively. These figures show a good agreement between all the results for the whole range of volume fraction of calcite under consideration. As expected, the volume fraction of calcite is, at the first order, the most important microstructural parameter responsible for the permeability (or effective diffusion) decay measured experimentally.
4 Conclusions
In the present paper, biocemented sand columns with different levels of calcification (0 < f c < 14%) have been achieved in order to quantify the influence of the precipitated calcite on microstructural (volume fraction of calcite, porosity, correlation lengths, total specific surface area, specific area of calcite) and physical properties (permeability, effective diffusion). All these properties were computed on 3D images at high resolution of sub-samples using synchrotron X-ray tomography and compared with experimental data, when it was possible. All the comparisons have shown a good agreement between numerical and experimental data, despite the differences in volume size of the used samples (for 3D imaging, Bernard calcimeter, permeability). This good correlation between these data also proves the validity of the proposed method to treat the 3D images and to separate the three different phases (sand, calcite and pore). All these numerical and experimental results show that:
-
the biocementation process creates a thin layer of calcite over the sand grains. In average, the thickness of this layer is the order of 6–7 microns, i.e. the order of one layer of calcite crystals;
-
at low volume fraction of calcite (typically f c < 10%), the total specific surface area (SSA) slightly increases when increasing the volume fraction, due to the formation of rough surfaces with the precipitation of the calcite on the grain surface. By contrast, for volume fraction of calcite larger than 10%, our results show that the SSA slightly decreases, due to the creation of new contacts between grains.
-
the specific surface area of the calcite (SSAc) increases when increasing the volume fraction of calcite and does not exceed 45% of the total surface of the sand grain when f c > 10%. This asymptotic value seems to show that the calcite precipitates in preferential locations (contact between grains, etc.).
-
the permeability and the effective diffusion, before and after treatment, are isotropic and decrease with an increase in the volume fraction of calcite. For f c = 14%, these decreases in the permeability and the effective diffusion are about 70 and 40%, respectively.
Finally, all these numerical results from 3D images and experimental data have been compared with numerical values or analytical estimates computed on idealized microstructures constituted of periodic overlapping (BCC and FCC) and random non-overlapping (SCM) arrangements of coated spheres. These comparisons show that these simple microstructures are sufficient to capture and to predict the main evolution of the microstructural and physical properties of biocemented sands for the whole range of volume fraction of calcite investigated.
References
Al Qabany A, Soga K, Santamarina C (2012) Factors affecting efficiency of microbially induced calcite precipitation. J Geotech Geoenviron Eng 138(18):992–1001
Auriault J, Boutin C, Geindreau C (2010) Homogenization of coupled phenomena in heterogenous media homogenization of coupled phenomena in heterogenous media. Wiley, Hoboken, p 473
Becker J, Wiegmann A (2014) GeoDict user guide (DiffuDict). Math 2 Market
Boutin C, Geindreau C (2010) Periodic homogenization and consistent estimates of transport parameters through sphere and polyhedron packings in the whole porosity range. Phys Rev E 82(13):1–18
Calonne N, Flin F, Geindreau C, Lesaffre B, Rolland du Roscoat S (2014) Study of a temperature gradient metamorphism of snow from 3-D images: time evolution of microstructures, physical properties and their associated anisotropy. Cryosphere 8(16):2255–2274
Cheng L, Wiegmann A (2014) GeoDict user guide (FlowDict). Math 2 Market
Chu J, Invanov V, Naeimi M, Stabnikov V, Liu HL (2014) Optimization of calcium-based bioclogging and biocementation of sand. Acta Geotech 9:277–285
DeJong J, Fritzges M, Nüsslein K (2006) Microbially induced cementation to control sand response to undrained shear. J Geotech Geoenviron Eng 131(112):1381–1392
DeJong J, Mortensen B, Martinez B, Nelson D (2010) Bio-mediated soil improvement. Ecol Eng 36(12):197–210
Dejong J, Soga K, Banwart S, Whalley W, Ginn T, Nelson D, Mortensen B, Martinez B, Barkouki T (2011) Soil engineering in vivo: harnessing natural biogeochemical systems for engineering solutions. J R Soc Interface 54(18):1–15
DeJong J, Proto C, Kuo M, Gomez M (2014) Bacteria, bio-films, and invertebrates… the next generation of geotechnical engineers? In: Garlanger JE, Iskander M, Hussein MH (eds) Geo-congress 2014. Atlanta, Georgia, USA, vol 1. ASCE, pp 3959–3968
Feng K, Montoya B (2016) Influence of confinement and cementation level on the behavior of microbial induced calcite precipitated Sands under monotonic drained loading. J Geotech Geoenviron Eng 142(11):04015057
Filet A, Gadret J, Loygue M, Borel S (2012) Biocalcis and its applications for the consolidation of sands. In: Lawrence FJ, Donald AB, Michael JB (eds) Grouting and deep mixing 2012. New Orleans, Louisiana, USA, vol 1. ASCE, pp 1767–1780
Flin F, Lesaffre B, Dufour A, Gillibert L, Hasan A, Rolland du Roscoat S, Cabanes S, Pugliese P (2011) On the computations of specific surface area and specific grain contact area from snow 3D images. In: Furukawa Y, Sazaki G, Uchida T, Watanabe N (eds) Physics and chemistry of ice 2010, vol 1. Hokkaido University Press, Sapporo, pp 321–328
Girinsky O (2009) Pre-industrialization of a consolidation process of soil by in situ biocalcification (in french: Pré-industiralisation d’un procedé de consolidation de sol par biocalcification in situ). Ph.D. thesis Université d’Angers UFR sciences
Jiang N, Soga K, Dawoud O (2014) Experimental study of mitigation of soil internal erosion by microbially induced calcite precipitation. In: Garlanger JE, Iskander M, Hussein MH (eds) Geo-congress 2014. Atlanta, Georgia, USA, vol 1. ASCE, pp 1586–1595
Kanit T, Forest S, Galliet I, Mounoury V, Jeulin D (2003) Determination of the size of the representative volume element for random composites: statistical and numerical approach. Int J Solids Struct 40(113–14):3647–3679
Martinez B, DeJong J (2009) Bio-mediated soil improvement: load transfer mechanisms at the micro and macro-scales. In: Han J, Zheng G, Schaefer VR, Huang M (eds) Advances in ground improvement: proceedings U.S.-China workshop on ground improvement technologies 2009, Orlando, Florida, United States, vol 1. ASCE, pp 242–251
Martinez B, Dejong J, Ginn T, Montoya B, Barkouki T, Hunt C, Tanyu B, Major D (2013) Experimental optimization of microbial-induced carbonate precipitation for soil improvement. J Geotech Geoenviron Eng 139(14):587–598
Montoya B (2012) Bio-mediated soil improvement and the effect of cementation on the behavior, improvement, and performance of sand. Ph.D. thesis, vol 1. University of California, Davis
Montoya B, DeJong J, Boulanger R (2013) Dynamic response of liquefiable sand improved by microbial-induced calcite precipitation. Géotechnique 63(14):302–312
Morales L, Ramero EJC, Garzon E, Gimenez A (2015) Feasibility of a soft biological improvement of natural soils used in compacted linear earth construction. Acta Geotech 10:157–171
Otsu N (1979) A threshold selection method from gray-level histograms. Trans Syst Man Cybern 9:62–66
N. P94-048 (1996) Soils: reconnaissance and testing—Determination of carbonate content—Method of calcimeter (in French: sols: reconnaissance et essais—Détermination de la teneur en carbonate—Méthode du calcimètre). AFNOR
Paganin D, Mayo SC, Gureyev TE, Miller PR, Wilkins SW (2002) Simultaneous phase and amplitude extraction from a single defocused image of a homogeneous object. J Microsc 206(11):33–40
Rolland du Roscoat S, Decain M, Thibault X, Geindreau C, Bloch J (2007) Estimation of microstructural properties from synchrotron X-ray microtomography and determination of the REV in paper materials. Acta Mater 55:2841–2850
Schluter S, Sheppard A, Brown K, Wildenschild D (2014) Image processing of multi-phase images obtained via X-ray microtomography: a review. Water Resour Res 50(14):3615–3639
Soon N (2013) Improvements in engineering properties of tropical residual soil by microbial-induced calcite precipitation. Master thesis Universiti Tunku Abdul Rahman
Tagliaferri F, Waller J, Andò E, Hall S, Viggiani G, Bésuelle P, DeJong J (2011) Observing strain localisation processes in bio-cemented sand using x-ray imaging. Granular Matter 13(13):247–250
Terzis D, Laloui L (2016) Fabric characteristics and mechanical response of bio-improved sand to various treatment conditions. Géotech Lett 6(11):50–57
Torquato S (2002) Random heterogeneous materials: microstructure and macroscopic properties, vol 1. Springer, New York
Van Paassen L, Ghose R, Linden T, Van Der Star W, Van Loosdrecht M (2010) Quantifying biomediated ground improvement by ureolysis: large-scale biogrout experiment. J Geotech Geoenviron Eng 136(112):1721–1728
Whiffin V, Van Paassen L, Harkes M (2007) Microbial carbonate precipitation as a soil improvement technique. Geomicrobiol J 24(15):417–423
Acknowledgments
This research is part of the BOREAL project founded under FUI 16 programme and receives financial support from BPI, Métropole de Lyon and CD73. The authors acknowledge the technical support provided by Axelera, Indura, and all the BOREAL project partners for this research, and in particular the CNR company for funding the first author’s PhD thesis. The authors would like to thank D. Depriester for his help concerning the evaluation of the correlation lengths. 3SR lab is part of the LabEx Tec 21 (Investissements d’Avenir–Grant Agreement ANR11 269 LABX0030).
Author information
Authors and Affiliations
Corresponding author
Rights and permissions
About this article

Cite this article
Dadda, A., Geindreau, C., Emeriault, F. et al. Characterization of microstructural and physical properties changes in biocemented sand using 3D X-ray microtomography. Acta Geotech. 12, 955–970 (2017). https://doi.org/10.1007/s11440-017-0578-5
Received:
Accepted:
Published:
Issue Date:
DOI: https://doi.org/10.1007/s11440-017-0578-5