
Abstract
One valuable goal of instructional technologies in K-12 education is to prepare students for future learning. Two classroom studies examined whether Teachable Agents (TA) achieves this goal. TA is an instructional technology that draws on the social metaphor of teaching a computer agent to help students learn. Students teach their agent by creating concept maps. Artificial intelligence enables TA to use the concept maps to answer questions, thereby providing interactivity, a model of thinking, and feedback. Elementary schoolchildren learning science with TA exhibited “added-value” learning that did not adversely affect the “basic-value” they gained from their regular curriculum, despite trade-offs in instructional time. Moreover, TA prepared students to learn new science content from their regular lessons, even when they were no longer using the software.
Adding value with technology
If asked, many parents and educators would agree that incorporating technology into the curriculum is a good idea for schools. However, given the costs, there are concerns that computer technologies may fail to bring “added-value” to student learning, or worse, they may displace curricula that once provided “basic-value” (Clarke and Dede 2009). A second concern is that technologies may over-scaffold student learning, such that students do not learn to perform basic procedures on their own. Consider, for instance, the debates over whether students should be allowed to use hand-held calculators in school (Ellington 2003), and whether word-processing programs and spell-checkers have degraded writing skills (Galletta et al. 2005).
One way to differentiate whether students have benefited from versus become dependent on a technology is to examine whether they are better prepared to continue learning once the technology disappears. For example, Bransford and Schwartz (1999) proposed an approach to assessment called “preparation for future learning” (PFL). A PFL assessment examines how well students learn given subsequent instruction or informational resources. In the context of evaluating whether a learning technology has been a useful scaffold, a PFL assessment would examine students’ abilities to learn once the technology is removed. In the positive case, students who once used the technology would be more prepared to learn than students who had never used it. In the negative case, students who used the technology would not learn as well once it was removed.
In the current research, we describe a technology called Teachable Agents (TA) that was developed, in part, to add value to paper-and-pencil concept mapping by providing learners with automated feedback. We also explain the design rationale behind the TA. We then present a pair of added-value studies that included PFL assessments to see what new learning benefits TA might add. The first study compared TA with a more traditional concept mapping program. TA led to superior learning of causal relations, and it better prepared students to learn from a subsequent reading. The second study compared student learning from a well-established, kit-based science curriculum with and without the addition of TA. The teachers were free to implement TA as they chose. TA added value to instruction by improving student learning of causal relations without reducing the basic value provided by the science kits. TA also prepared students to learn more deeply from a subsequent month of instruction on a completely new topic when the students were no longer using the technology. We conclude by considering the source of this effect, and the possibilities of using PFL assessments for other technologies including software games.
Teachable Agents
Two paths to added-value
Concept maps are graphical representations of a person’s topical understanding. The maps consist of labeled nodes and links that represent a web of propositions (Novak 2002; Novak and Gowin 1984). Concept maps have proven to be a useful paper-and-pencil technology for improving knowledge retention and integration (for reviews, see Hilbert and Renkl 2008; Horton et al. 1993; Nesbit and Adesope 2006; O’Donnell et al. 2002). How might technology add value to concept mapping?
One approach is the development of productivity tools that capitalize on the computer’s capacities for editing, organizing, storing, sharing, and printing. Inspiration® is an example of a concept mapping program used widely in schools (www.inspiration.com). It contains a simple interface for structured map-making and a suite of productivity tools, including automated untangling of concept maps and the ability to incorporate images and hyperlinks for nodes.
A second approach is to further recruit the computer’s potential for generating interactive feedback for learners. We have taken this latter approach in creating Teachable Agents (TA). Students learn by teaching a computer character. The students create the concept map that is the character’s “brain,” and they receive feedback based on how well their computerized pupil can answer questions.
Interactivity with Teachable Agents
Figure 1a shows the main TA teaching interface. Students teach their agent by adding nodes and links using the “Teach” buttons. To add a concept, students click on “Teach Concept,” which produces a textbox in which they enter the name of the node. To create a link, students click on “Teach Link” and draw a line connecting two nodes. Next, the palette in Fig. 1b appears, and students use the palette to name the link. They must also specify the type of link, which can be “causal,” “type-of,” or “descriptive.” If students choose a “causal” link, they must further specify whether an increase to the first node causes an increase or decrease to the second node (e.g., landfills increase methane). In the following studies, these causal links are of particular importance, because they were the main source of feedback.

The primary Teachable Agents interface. a A student has named her agent “Dee,” customized Dee’s look, and taught her about global warming. Dee has answered the question, “If ‘methane’ increases, what happens to ‘heat radiation?’” both graphically and in text. b The “Teach Link” window in which the student has taught Dee the causal proposition: ‘insulation’ decreases ‘heat radiation.’ c The “Ask” window by which the student can query Dee to test her understanding
To provide feedback and enhance the teaching metaphor, TA comes with a qualitative reasoning engine (see Forbus 1984; Jackson et al. 1998). The engine uses path traversal algorithms that enable the agent to reason through causal chains in the concept map (Biswas et al. 2005). For example, Fig. 1c shows the palette by which students can ask their agent a question. In this example, the student has asked the agent, “If ‘methane’ increases, what happens to ‘heat radiation’?” Figure 1a shows how the agent highlights successive nodes and links in the concept map to illuminate the chain of inference it uses to answer the question. In this case, the agent has reasoned that an increase in methane decreases heat radiation. It did so by following the path that methane is a type of greenhouse gas; greenhouse gas is a type of insulation; and an increase in insulation decreases heat radiation. The agent has also described this chain of inference in the lower text panel of Fig. 1a. In this manner, students can trace their agent’s thinking, both as a model of causal reasoning, but also as a way to see if the agent has learned what they think they taught it.
A second source of interactive feedback compares agent answers against a hidden expert map entered by the teacher. Students can submit their agent for testing by clicking on the “Quiz” button (Fig. 1a, lower left corner). Questions in the quiz can be seeded by the teacher or generated automatically. The agent’s answers are compared to the answers produced by an expert map and students get feedback on how their agent did. The TA’s lower panel displays the list of quiz questions and indicates which ones the agent answered correctly. For incorrect answers, the system does not provide the student the correct answers, but instead gives more elaborated feedback and hints, for example, “A link or more is missing from your map. The Resources is a good place for more information.”
The automated scoring of the concept map creates additional possibilities for feedback. Figure 2a shows the All-Possible-Questions matrix which tests the agent on every possible question for a given map. The color-coded grid structure provides students quick, comprehensive feedback on how their agent is doing: green for correct answers and red for incorrect. Importantly, the yellow cells indicate where an agent gave the right answer but for the wrong reason. That is, the system detects that the agent has missing or incorrect links, but still happens to give a correct answer for a particular question. Figure 2b shows the Front-Of-Class software designed to provide formative feedback for class discussion. The teacher can use this software with a projector and screen to show multiple agent maps at the front of the room. The teacher can simultaneously ask all the agents the same question. This display also uses the red, green, and yellow highlighting to indicate how each agent did on the question, which helps the teacher identify problem areas. The teacher can also “zoom in” on an agent to animate its reasoning for additional class discussion. Compared to the clickers used in many college classrooms, the Front-of-the-Class software provides a new model for class level formative feedback and discussion (Burnstein and Lederman 2001; Judson and Sawada 2002).

TA-affiliated feedback technologies. a All-Possible-Questions matrix: automated scoring indicates TA accuracy for all possible questions [Green = correct; Red = incorrect; Yellow = correct, but reasoning path is wrong]. b Front-of-Class display: teachers can project and quiz multiple agents simultaneously to provide a visual anchor for classroom discussion. c Game Show: students can chat and have their agents compete in an online game show for homework. d Lobby: student portal to mapping, agent customization, chat, and Game Show. (Color figure online)
Figure 2c shows another application of interactive feedback. It is a screenshot of an Internet homework system called the Game Show. Students can log on from home or school to teach their agents, chat with other students on-line, and have their agents participate in an on-line game with other students’ agents. During the game, a host asks agents to answer questions on the material. Students have a brief moment after each question to decide how much to “wager” on their agent, before it gives an answer. The wagering feature was designed as a prompt for students to reflect on how their agent would answer questions, thus reflecting on their own teaching and learning. Further details about these features may be found in Schwartz et al. (2009) and the software is available by contacting the authors.
The teaching metaphor
Before describing the two added-value studies, we explain the rationale for the metaphor of teaching an agent. TA belongs to a class of instructional technologies called pedagogical agents, where students interact with a graphical character. Unlike other pedagogical agents, which primarily play the role of coach or peer (see Baylor 2007), TA takes the role of pupil. Why did we include the fiction of teaching a character, given that the interactive feedback does not require it?
One reason is that the teaching metaphor allows students to use the familiar teach-test-remediate schema for self-organizing their interactions and interpreting feedback. In a typical “teaching session,” students first read resources or complete other relevant learning activities. They then teach their agent a few nodes and links based on what they have learned. They ask their agent questions and have it take a quiz. If the agent does well, they add more nodes and links. If the agent does poorly, they use available resources to check their own understanding and then make changes to the map.
Of course, there is also the potential for a less effective learning scenario. Students may use trial and error until the agent gives a correct answer to a quiz question. The potential for trial and error is one reason to examine preparation for future learning. It is possible that students overuse the interactivity and feedback to stumble into correct concept maps without actually learning anything useful.
A second reason for the teaching metaphor is to capitalize on the growing research base that generally shows positive results from learning-by-teaching (Annis 1983; Biswas et al. 2005; Renkl 1995; Roscoe and Chi 2008). For example, people learn better when they prepare to teach someone who is about to take a test, compared to when they prepare to take the test themselves (Bargh and Schul 1980; Biswas et al. 2001). They try harder to organize their understanding for the task of teaching another person than they do for themselves (Martin and Schwartz 2009). In the context of technology, the teaching metaphor can enlist fruitful social attitudes during interaction, including a sense of responsibility for one’s pupil. For example, Chase et al. (2009) had students use identical TA software. In both conditions, students designed the graphical look of their character; they created the concept map; and they used the interactive feedback. The difference was that in one condition, students were told the character was an agent they were teaching, and in the other condition, students were told the character represented them. Students who thought they were teaching engaged in more learning relevant behaviors on behalf of their agent and demonstrated deeper learning at posttest.
A third reason for using the teaching metaphor involves metacognition (see Hacker et al. 2009). As the TA visibly reasons through its concept map, students can reflect on the structure of their agent’s reasoning. Students are applying metacognition, but in this case, the metacognition is about their agent’s thinking rather than their own. TA is specifically designed to highlight chains of qualitative causal reasoning, for example, that an increase in cars can cause an increase in flooding through the intermediary causes of atmospheric change and global warming. Ideally, metacognition about their agent’s causal reasoning improves students’ own abilities to think with and learn about causal chains. The current research examines the hypothesis that TA improves students’ abilities to learn causal relations in science, both when using the software and afterwards, once the TA is removed.
Study 1: The added-value of interactivity
Prior work has compared variations of the TA system (Biswas et al. 2005). In the studies described here, rather than trying to isolate variables within our own technology, we compared the TA system to other instructional approaches. In Study 1, two classes of 6th-grade students learned about global warming over the course of 3 weeks. They received matched curriculum and lessons. The difference was whether they organized what they learned using TA or the concept mapping program, Inspiration.
One research goal was to examine what type of learning TA produced. We do not intend to claim that TA is better than Inspiration, which has its own strengths as a productivity tool. Rather, we wanted to investigate the hypothesis that TA would help children learn to think through chains of causal reasoning. To find out, we assessed students at regular intervals during the global warming unit on how well they reasoned about causal relations.
A second goal was to gather initial evidence on whether TA prepared students for learning new content once the technology was removed. After completing the treatments, the two groups of students were given an opportunity to learn a related topic, but without support from the technologies. This PFL assessment did not involve the far transfer of learning completely new content, which is examined in Study 2. Instead, students had to integrate new content that was relevant to their previous lessons.
Methods
Participants
Two 6th-grade classes from a high SES school with the same science teacher participated. All students had broadband access at home, and students in both classes had previously used Inspiration. Logistical constraints required that the two classes be randomly assigned intact to either the TA condition (n = 28) or the Inspiration condition (n = 30). The principal reported that the school matched classes on ability, but we did not have access to measures of prior achievement. Instead, we administered a pre-test on the first day of the study, before any instruction was given.
Procedures
Students completed a three-unit course on the mechanisms, causes, and effects of global warming. The course supplemented a short section in the school’s 6th-grade science textbook. Instruction consisted of 11 lessons over a period of 3 weeks. For each unit, both classes completed learning activities that included readings, videos, hands-on experiments, and classroom discussion. To ensure consistent, matched instruction, the researchers taught both classes throughout. After each basic unit, students either worked with Inspiration or taught their agents in the TA system. In both conditions, students made causal links among pre-determined nodes to help them organize the content from the other instructional activities, and they received homework assignments to further edit their concept maps. Figure 3 shows the ideal final map partitioned to indicate the nodes introduced in each unit.

Global warming expert map Study 1. The cumulative map for the three units, a mechanisms, b causes, and c effects, contains 27 nodes, 31 links, and 3 feedback loops
Design
The main comparison was between the effects of Inspiration versus TA on causal reasoning. In the TA condition, various feedback features of the technology were introduced across the units. For Unit 1 (Mechanisms), students used the Quiz feature as they made their initial maps. For Unit 2 (Causes), students used the Quiz feature as they incorporated the new nodes for this unit into their global warming map, and the teacher used the Front-of-the-Class display to lead a discussion, after which students could revise their maps. For Unit 3 (Effects), the students updated their maps with the new nodes and played the Game Show in class and at home.
We tried to match each feature for the Inspiration condition. For example, when the quiz feature was enabled for the TA students, the Inspiration students had an identical paper-and-pencil version of the quiz for themselves. When the instructor led map-based discussions, she used the Front-of-Class display with TA students and used Powerpoint slides of student maps with Inspiration students. For the Game Show, the TA students wagered on their agents answering the questions, and the Inspiration students played a modified version of the Game Show in which they answered the questions themselves (using a pull-down menu to indicate increase, decrease, or no change), and they also wagered on their own answers.
In addition to the between-subjects factor of Inspiration versus TA, there were two within-subject factors, time of assessment and length of causal inference required to answer questions. Over time, the students were given four assessments, a pre-test with 24 short-answer, paper-and-pencil questions from across the curriculum, and three end-of-unit tests that included eight short-answer, paper-and-pencil questions. Each test included questions at three levels of complexity: short, medium, and long chains of causal inference. This created a design of two conditions (TA, Inspiration) × 4 tests (days 1, 5, 7, 11) × 3 levels of question complexity (short, medium, long). Length of causal inference was determined by how many causal steps were needed to explain the correct answer (e.g., number of links in the expert map). Short chains were between one to two causal steps, medium chains were three steps, and long chains were four steps or greater. (Instructional materials and tests are available upon request.) Example questions include:
-
Short Chain: What does insulation do?
-
Medium Chain: How would global warming affect the rate of plant and animal extinction?
-
Long Chain: Explain why the number of cars in America may influence the number of floods around the world.
In the final 40 min of the study, students also completed a PFL assessment. They saw a short video about things that individuals and communities have done to reduce global warming. Students then received a one-page text that described things they could do to help prevent global warming. They were given four starter nodes, and their assignment was to construct a paper-and-pencil concept map of the text passage. Concept maps are often used to assess student understanding (e.g., Ruiz-Primo and Shavelson 1996; Taricani and Clariana 2006). In this case, the question was whether there would be differences in how well students integrated this new content into their representation of the topic.
Results
Causal understanding
Students’ answers to the causal questions were scored on how well they explained the causal chain of inference: 0 points (incorrect or no answer), ½ point (partially correct answer), or 1 point (correct answer). Below are sample answers and scores for the question “Explain why the number of cars in America may influence the number of floods around the world”:
-
0 points: “It uses up gas.”
-
½ point: “Cars give off CO2 which makes it hot and creates floods.”
-
1 point: “The cars will burn fossil fuels which will produce carbon dioxide which will join the atmosphere which will heat the earth up which will melt the glaciers which will increase the sea level which will increase floods.”
Inter-rater reliability was determined by having two separate coders score 20% of the tests at random. Pearson correlations between the coders ranged from .90 to .92 across the tests. Cronbach’s alpha for reliability across tests was .79. The following analyses used each student’s mean score for the short, medium, and long chain questions for each assessment, yielding 12 data points per student (3 problem types by 4 assessment times).
Figure 4 shows the average score per question broken out by condition, time of test, and the length of inferential chain needed to answer the question. At pretest and after the first instructional unit, the two groups are similar. After the second unit, the TA students show an advantage for the medium-length inferences. By the final unit, the TA students show an advantage for short, medium, and long inferences. Our interpretation of this pattern is that the TA students were getting progressively better at reasoning about longer and longer chains of inference in the context of global warming. The following provides the relevant statistics.

Mean question scores for global warming assessments. Scores are broken out by test, length of causal inference, and treatment
To rule out pre-existing differences, we first submitted the pretest data to a repeated-measures analysis of variance crossing the between-subjects factor of condition by the within-subject factor of inference length. The conditions were not significantly different; F (1, 56) = 1.5, p > .2.
To test the effect of treatment, we conducted a 2 × 4 × 3 analysis of variance with the between-subjects factor of condition crossed by the within-subject factors of time (four time points) and inference length (short, medium, long). Only students present at all test points were included (TA n = 26, Inspiration n = 27).
All three factors showed main effects, which should be interpreted in light of significant interactions. There was a main effect for time, indicating that students improved; F (3, 49) = 76.4, p < .001. There was a main effect of inference length, indicating that the separation of questions into short, medium, and long chain inferences correctly reflected problem difficulty; F (2, 50) = 77.5, p < .001. And finally, there was a main effect for condition, indicating that the TA system led to superior performance; F (1, 51) = 4.2, p < .05.
The 2-way interactions clarify the TA effect. TA students improved more over time than the Inspiration students; F (3,49) = 3.1, p < .05. There was also a two-way interaction of condition by inference length, indicating the TA students did relatively better on longer causal chains; F (2, 50) = 4.2, p < .05. Finally, there was a time by inference length interaction indicating that students in both groups did progressively worse on short-chain inferences and progressively better on long-chain inferences; F (6, 46) = 12.9, p < .001. Our best explanation for the drop in short-chain performance is that we inadvertently made the short-chain questions more difficult in the later assessments. The three-way interaction, condition by time by inference length, was not significant; F (6, 46) = 1.0, p > .4.
The best estimate of effect size comes from the final unit test, because this occurred after the full course of the two treatments. A separate analysis of variance crossed treatment by question type for this final unit test. The effect size of the TA treatment over Inspiration is d = .52; F (1, 51) = 13.6, p < .001.
Preparation for future learning
During the last session, students constructed paper-and-pencil concept maps on their own, given a new, one-page text passage on the prevention of global warming. These PFL maps were coded for (a) total number of concepts included, (b) number of concepts from the passage, and (c) number of passage concepts integrated with valid causal paths. Two raters coded a subset (20%) of the maps, resulting in one coding disagreement. A primary rater then coded the remaining maps. Figure 5 shows a sample student map and the coding scheme.

Sample coding of a student map in the PFL assessment. Students were given a 1-page text on how to help prevent global warming and four starter concepts. Maps were coded for total concepts included, number of concepts from the passage, and number of passage concepts integrated with valid causal paths
Students in both conditions added roughly four concepts to the starter nodes provided. The TA students included an average of 3.2 concepts from the passage compared to 1.3 for Inspiration students; t (49) = 4.2, SE = .43, p < .001, d = .61. Additionally, the concepts added by the TA students were better integrated, with more correct causal paths. The TA condition showed twice as many appropriately linked nodes (2.5) compared to the Inspiration condition (1.2), t (49) = 3.2, SE = .43, p < .01, d = .45. Overall, the students’ paper-and-pencil concept maps indicated that the TA condition better prepared students to develop an integrated understanding of the reading passage, even when they were no longer using the interactive technology as support.
Discussion
Over 3 weeks, two classes of students worked with either TA or Inspiration. Students received identical information about global warming delivered in identical ways. The difference was how they used technology to organize and receive feedback about the ideas they learned. The Inspiration condition used a productivity-focused tool, and feedback was necessarily provided outside the tool. The TA condition used the social metaphor of teaching to organize computer interactions, and provided automated feedback to students through the lens of their agent’s understanding.
Early in the intervention, both treatments exhibited similar levels of understanding, and both groups did much better with inference questions involving shorter causal chains. Over the course of instruction, TA students demonstrated relative gains in their abilities to draw inferences through longer causal chains in the context of global warming. This makes sense because the TA’s organization and reification of knowledge portrays reasoning through causal chains.
The PFL assessment results suggest that students adopted their agent’s reasoning patterns and ways of organizing knowledge. On this assessment, students from both conditions received an identical learning task: integrate new content from a text passage without technological support. The TA students causally integrated more passage-relevant concepts in their paper-and-pencil concept maps. The greater number of integrated nodes in the TA condition indicates that TA students had connected the concepts into potential chains of inference.
Based on this study, the PFL effect could be the result of the TA students having a better grasp of global warming from the prior units of instruction, or it could be that the students had a better grasp of causal integration and used it to make sense of the new material. The next study examines this question more closely by seeing if TA prepared students to learn new content that was topically unrelated to what they had studied with their agents.
Study 2: Added-value to a standard curriculum
Study 1 was of relatively short duration and was taught under the strict edicts of the research design; additionally, researchers took the lead instructional roles and used specially-created content. The study demonstrated that TA is particularly useful for developing an integrated understanding of causal chains. Study 2 was designed to see how TA would fare in a more complex ecology of instruction, in which school teachers used TA to complement their regular curriculum. Six 5th-grade teachers integrated TA into their district-adopted science-kit curriculum as they saw fit, over a period of several months. We were interested in three questions. First, would TA produce added-value gains, as evidenced by improved student performance on researcher-designed measures of causal reasoning? Second, would there be a change in basic-value as measured by the curriculum’s own assessments? And, third, once the TA technology was withdrawn, would the students be more prepared to learn from their standard curriculum on a new and unrelated science topic?
The experiment used a cross-over design. Three teachers used TA for a science kit on biological systems, and then stopped using TA for the subsequent kit on earth science. The other three teachers worked without TA for the biology kit, but then did use TA for the subsequent earth science unit. Our prediction was that students who first used TA to learn about biology would learn to think in terms of causal chains. This causal thinking would benefit their subsequent learning of the non-overlapping content in the earth science unit, even though they were no longer using TA.
Methods
A small, local school district agreed to use the TA technology to complement their regular science curriculum in the 5th-grade. The district used the Full Option Science System (FOSS), developed by the Lawrence Hall of Science (www.lhsfoss.org). FOSS kits come complete with teacher guides, textbooks, videos, hands-on activities, worksheets, and assessments.
Participants
The study involved six teachers and 134 5th-grade students (104 with permission to analyze their data) who were assigned to one of two conditions, TA-1st or TA-2nd. To determine if there were pre-existing student differences in the two conditions, we used all available achievement data. A multivariate analysis compared students’ 4th-grade math and reading scores on the California STAR assessment (www.cde.ca.gov/ta/tg/sr/). STAR does not include a science test for this age, so our analysis also incorporated scores from the FOSS-developed pretest that comes with the first kit. There were no pre-existing differences between the two conditions; F (3, 86) = .056, p > .95; all univariate F’s < .25.
Design
The district-wide schedule required that teachers use the Living Systems kit (LS) in the winter and the Water Planet kit (WP) in the spring. In the winter, the three classrooms in TA-1st condition integrated TA with the LS kit. The three classrooms in the TA-2nd condition used the LS kit as they normally would. In the spring, the TA-2nd condition used TA for the WP kit, while the TA-1st condition covered WP without the technology, completing a cross-over design in the use of TA.
State testing plus end-of-year school events yielded different durations for the two kits. The teachers had approximately 10 weeks for LS and 5 weeks for WP. For the LS kit, the teachers covered three sub-units: Human Body, Vascular Plants, and Photosynthesis & Cellular Respiration. For the WP kit, the teachers covered the unrelated and extensive Water Vapor unit. These differences had implications for the amount of data we could collect for each unit, as described next.
The FOSS kits come with summative assessments for each sub-unit, which served as the measure of “basic-value” to determine whether TA displaced or augmented the intended goals of the original curriculum. The tests contain multiple-choice, fill-in, and short-answer questions (FOSS tests may be requested at lhsfoss.org/components/general/k8sys.html). We sorted the FOSS items into four categories based on their use of “prompt” words: Why questions asked about causal inferences; How questions probed internal mechanisms; What questions tested factual recall; and Data questions asked students to interpret charts or tables. Examples from the Living Systems kit include:
-
Why: “Why is it important to filter waste materials from the blood?”
-
How: “Describe how water in the ground travels to the leaves at the top of a tree.”
-
What: “Which side of the heart pumps oxygen-rich blood to the body?”
-
Data: “How do the data show that plants produce their own food?” [A table showed starting and ending masses of plants grown under different experimental conditions.]
At the end of each sub-unit, we also appended four “added-value,” short-answer questions to the FOSS assessments. These added-value questions tapped the types of causal reasoning modeled by TA. For example, one question asked,
-
“You go on vacation and forget to ask someone to water your house plant. What happens to the plant’s level of starch storage while you are gone? Explain your reasoning.”
The teachers did not see these added-value questions beforehand, so they could not teach to them. As a fuller example, "Appendix 1" shows the four questions for the sub-unit on the Human Body.
Procedures
All the teachers were trained on TA in a one-day, in-service workshop. When the teachers used TA with their students, they were free to implement the tools within the TA system differently. Teachers used TA at different points in their lesson plans and some preferred one feature over another. For example, one teacher preferred to use TA as a summative exercise for each sub-unit and encouraged extensive use of the Quiz feature. Another teacher preferred shorter, more interspersed TA sessions throughout each sub-unit and allowed more Game Show play for her students. Throughout the study, each teacher received as much technical and curricular support as she wanted for her TA lessons. Overall, TA-1st students averaged eight total mapping sessions (337 min of TA-instructional time), TA-2nd students approximately five (275 min).
Unlike the previous study, in which students worked on a single, cumulative map for their agents, separate concept maps were designed to complement the different sub-units in the FOSS curriculum. Four expert maps were created for the LS kit and two maps for the WP kit (see Appendix Fig. 8).
Because TA was built for use over the Internet, we were able to collect usage data whenever and wherever students used the system. We conducted exploratory stepwise regressions to determine whether increased usage of TA was correlated with better added-value learning outcomes.
Results
All learning assessment items were scored on a scale of 0–1. Answers received 0 points (incorrect or no answer), ½ point (partially correct answer), or 1 point (correct answer). Inter-rater reliability, using a random subset of at least 20% of the answers for each item, exhibited Pearson correlations of greater than .92 for all tests. The reliability across the added-value tests (Cronbach’s alpha = .81) matched the reliability of the FOSS basic-value items (Cronbach’s alpha = .76).
Because teachers chose to complete the LS sub-units in different orders, and because the WP implementation used fewer sub-unit tests than LS, the following analyses use students’ average question performance for each kit, rather than breaking out performance by sub-unit.
Added-value and preparation for future learning
Figure 6 shows the average added-value question score broken out by condition and science kit. A repeated-measures ANOVA compared average within-subject performance on the LS and WP added-value questions crossed by the between-subjects factor of condition. The two-way interaction evident in Fig. 6 was significant; F (1,96) = 4.7, p < .05. The interaction indicates that students improved once they used the TA software. It also indicates that the TA-1st students maintained their level of performance from the LS kit to the WP kit, even though they were no longer using the technology.

Average scores on added-value questions. Scores are broken out by kit and condition
Breaking out the effect, we first consider results for the LS kit, which is when the TA-1st condition used TA, and the TA-2nd condition did not. A separate ANOVA compared the effects of TA-1st versus TA-2nd conditions on the students’ added-value scores. The TA-1st condition did better; F (1,101) = 5.2, p < .05, d = .23. Moreover, the mean scores for each of the three TA-1st classes were higher than the means for each of the three TA-2nd classes. TA provided consistent added-value for the 5th-graders, despite natural variability in the ways teachers used the software and taught their classes.
We next examine the results from the WP kit, for which the TA-2nd condition started using the technology and the TA-1st condition stopped. The TA-2nd condition improved on the added-value questions once they used the software. The effect size for the TA-2nd gain from LS to WP questions was d = .68. (The effect size is larger for this comparison, because it is within-subjects rather than between.)
Basic-value
One concern was that TA might detract from the basic-value of the FOSS kits. To examine this issue, we analyzed the students’ performance on FOSS’s own summative tests. The analysis is confined to the LS kit, because several of the teachers chose not give the FOSS tests for the WP kit.
Figure 7 shows that the TA-1st students did better specifically on Why questions, with no condition differences for the other three question types. A 2 × 4 repeated-measures ANOVA, crossed the two conditions with the four question types. The performance differences on the Why questions drove a significant two-way interaction of condition by question type; F (3, 99) = 6.6, p < .001. Taking the Why questions separately, the treatment effect was d = .40. Thus, TA did not reduce students’ learning of basic FOSS material, and TA did improve it for the Why questions. The TA benefit on the Why questions fits the general pattern across both studies, because these questions asked students about cause-and-effect relationships. These results also show that the learning gain of TA-1st is not simply due to better students, time on task, or other unidentified variables. If these variables had been responsible for the learning gains, then there should have been superior performances across all the items, and not just the cause-effect questions.

Average scores on basic-value questions. Scores are for LS kit only and broken out by item type and condition
TA system-use and learning
The preceding analyses compared experimental treatments to determine TA effectiveness. A complementary approach is to look for effects within the TA treatments. If the technology is responsible for improved learning, then we should expect to see “dosing effects”––students who more frequently use productive elements of the software should learn more. The following analyses were post hoc explorations, because we were unsure which aspects of the TA system would be especially useful for learning if used more frequently.
We conducted two multiple regressions to predict students’ added-value scores using metrics of how often students used features of the system (mapping sessions, map edits, asking the agent a question, submitting an agent to a quiz, Game Show sessions, chat messages, reading on-line resources on the topics). One regression predicted TA-1st student performance on the LS kit, because this was when these students used TA. The second regression predicted TA-2nd performance on the WP kit, because this was when these students used TA. For each regression, we followed a two-step approach. In the first step, we forced the STAR scores into the regression equation. This statistically controlled for the possibility that correlations between greater system use and greater learning performance were due to prior achievement rather than a direct relation between amount of system use and learning. The second step to building the model used a stepwise regression to determine which system-use metrics, if any, predicted added-value performance.
For TA-1st students, the stepwise regression found that the number of map edits predicted performance on the added-value questions; F-Change (1, 40) = 4.4, p < .05, change in r 2 = .06; final model, F (3, 40) = 10.9, p < .001, R 2 = .45. For TA-2nd students, the number of quizzes entered the equation; F-Change (1, 40) = 7.2, p = .01, change in r 2 = .12; final model, F (3, 40) = 6.4, p < .01, R 2 = .33. While the number of edits predicted learning for TA-1st students, and the number of quizzes predicted learning for TA-2nd, it is useful to note that quizzing and editing are highly correlated (r = .70) and block entry of one another into the stepwise regressions. Results from both conditions suggest that greater TA use led to greater learning.
Discussion
Teachable Agents was integrated into the variability of regular classrooms over several months, where teachers chose how to use the software as an added-value to their normal instruction. Students who used TA first exhibited a deeper causal understanding of the material, as measured by the added-value tests and the Why questions in FOSS’s own basic-value assessments. The TA activities did not displace basic learning from the FOSS kit. Moreover, the degree to which students used the map editing or feedback features correlated with learning, even after controlling for prior achievement.
After the cross-over, the TA-2nd students caught up on the added-value measures once they were using TA. The TA-2nd data provide a within-subject comparison that indicates that students did better, relative to themselves, when they used TA. This result complements the between-subjects finding for the first science kit that using TA provided added-value compared to not using TA. It also complements the findings in Study 1.
The TA-1st students did not use TA for the WP kit, but their causal learning maintained at a relatively high level. Our preferred interpretation is that the students had learned to think in terms of integrating causal chains during the LS kit, and were able to continue learning in terms of causal chains during the non-overlapping WP content, even without the on-going support of their agents. They had been prepared for future learning by using the TA technology.
There are, however, alternative interpretations of the PFL findings. One alternative is that the conditions did equally well on the WP assessment because it was an easier test. By this account, the TA-2nd condition had not learned causal paths using TA, but because the WP test was easier, it looks like they improved compared to the LS test. And, although the TA-1st condition appeared to hold steady, they actually regressed, because they should have done better on the easier test.
While always possible and not to be discounted, this interpretation loses force when considering the results as a whole. One leg of this alternative interpretation is that the WP test was easier. However, the reliabilities across the LS and WP tests were high, and the within-subject gains of the TA-2nd students (across the two kits) closely resemble the between-subjects gain of the TA-1st students over the TA-2nd students (on the first kit before the cross-over). The second leg of this alternative is that the TA-2nd students did not learn causal integration for the shorter WP unit. However, both Study 1 and the results from the LS kit indicate that students improve causal integration when using TA. Therefore, it seems unlikely that the TA-2nd students would not learn, given that they spent over four and a half hours using the software across multiple sessions. More directly, when we regressed system use on learning, we found that TA-2nd students who used the system more effectively also learned more, in much the same pattern as for the TA-1st students. Thus, students in the TA-2nd condition did learn.
A second alternative interpretation is that the TA-1st students did well on the WP unit because the teachers had learned to emphasize causal integration when using TA, and this continued even after they stopped using the technology. This is a desirable outcome, because preparing teachers for future teaching would be a good accomplishment of any technology. However, our observations do not support this alternative. Field notes indicated that TA-1st teachers did not use concept mapping for the WP unit and did not use causal reasoning more in their teaching.
General discussion
There are many valid concerns for the adoption of new learning technologies: What will it cost in terms of school budgets and teachers’ start-up times? Will it displace “basic-value” learning from existing curriculum? Will it provide any “added-value” that is measurably beneficial to students? Will technology over-scaffold student learning, leaving students unable to perform once the technology is taken away? Our studies show one way to address these learning concerns is by measuring both added-value and basic-value learning when students are using the technology, and by examining subsequent learning when the technology has been removed.
Teachable Agents (TA) is an instructional technology that capitalizes on the social metaphor of teaching to engage students in learning. The TA system adds interactivity and feedback to concept mapping. Two classroom studies using TA with upper-elementary schoolchildren showed that students exhibit a better understanding of content-specific causal reasoning and longer chains of inference. The second study, which integrated TA into the standard science curriculum, showed that this added-value learning did not adversely affect basic-value learning, despite instructional time “lost” to TA. Indeed, TA appeared to support additional basic-value as measured by the curriculum’s own Why assessments.
Both studies also provided evidence that these learning benefits can persist when the children are learning new content without the support of the technology. In particular, Study 2 showed students transferred their understanding of causal reasoning from the domain of biology to help learn in the unrelated domain of earth science. However, it is important to acknowledge that the evidence, while strong, is not definitive. Both studies had to randomly assign intact classes to treatment rather than randomly assign students. Also, Study 2 would have been logically stronger if it had been possible to include a baseline condition that never received TA at all. We did control for these weaknesses statistically, for example by using pretest and standardized achievement measures. In addition, we identified that the learning effects are specific to causal integration and not other content included in the curricula. But, as always, experimental conclusions are tentative pending replication.
In the meantime, our explanation for the cause of the transfer effects is that TA provided an explicit model of causal thinking, which helped students develop their own causal reasoning (Collins et al. 1991). TA did not teach children how to learn in general, for example, by taking notes or explicitly self-explaining. Instead, TA provided them with the powerful and integrative idea of causal chains in science. We know that students already have causal schemas (Gopnik and Schulz 2007), and as Nisbett et al. (1983) found in the context of statistical reasoning, instruction that maps into pre-existing ways of reasoning has a better chance of transfer. The lessons on causal chaining transferred because they amplified a natural and useful way of thinking about science content. Moreover, the interactivity allowed students to reflect on their agent’s thinking and accuracy, and by proxy, they applied metacognition to their own understanding to help develop a grasp of causal chains (Schwartz et al. 2009). Research has shown that tutors gain a deeper understanding through interactions with their tutee, when they answer deep questions and respond to misconceptions (Chi et al. 2001; Palincsar and Brown 1984; Uretsi 2000. Roscoe and Chi (2008) for example, found that tutee questions were responsible for about two-thirds of tutors’ own reflective knowledge-building activity. The TA feedback elements (e.g., quizzes) plus the mistakes made by their TA pupils were explicit guides for students to focus on questions of causal reasoning.
The transfer measured in these studies is unusual, because students had an opportunity to learn as part of the assessment (Bransford and Schwartz 1999). In Study 1, they learned from a related passage, and in Study 2, they learned from a month of instruction on an unrelated topic. The leading assumption was that one way to test the added-value of the TA technology was to see if it prepared students for future learning such that they could transfer their technology-mediated experiences to help them learn in the future without the technology.
Such preparation for future learning assessments may be useful for addressing other questions involving learning from technology. For example, one outstanding question involves the value of videogames and other interactive media frequently found outside of school (e.g., Barron et al. 2009; Gee 2003; Kuhl et al. 2003; Ito 2009; Stevens et al. 2008). The content of these informal learning experiences rarely map cleanly into curricular standards. Therefore, it seems unlikely that experiences with these media would yield direct gains on standardized or curriculum-aligned assessments. Nevertheless, some of these highly interactive experiences may provide students with important competencies, dispositions, or prior knowledge that can prepare them to learn. One way to find out which informal technologies are valuable for learning, and which are not, is to use assessments that include opportunities to learn as part of that assessment. Such an approach was used to demonstrate that TA prepares students to learn once the technology-mediated experience is over; and it may work with other interactive technologies that can provide unique experiences not normally provided as basic-value in standard instruction.
References
Annis, L. (1983). The processes and effects of peer tutoring. Human Learning, 2, 39–47.
Bargh, J. A., & Schul, Y. (1980). On the cognitive benefits of teaching. Journal of Educational Psychology, 72, 593–604.
Barron, B., Martin, C. K., Takeuchi, L., & Fithian, R. (2009). Parents as learning partners in the development of technological fluency. International Journal of Learning and Media, 1(2), 55–77.
Baylor, A. L. (2007). Pedagogical agents as a social interface. Educational Technology, 47(1), 11–14.
Biswas, G., Schwartz, D. L., Bransford, J. D., & The Teachable Agents Group at Vanderbilt. (2001). Technology support for complex problem solving: From SAD environments to AI. In K. Forbus & P. Feltovich (Eds.), Smart machines in education (pp. 71–98). Menlo Park, CA: AAAI/MIT Press.
Biswas, G., Leelawong, K., Schwartz, D. L., Vye, N., & TAG-V. (2005). Learning by teaching: A new agent paradigm for educational software. Applied Artificial Intelligence, 19, 363–392.
Bransford, J. D., & Schwartz, D. L. (1999). Rethinking transfer: A simple proposal with multiple implications. In A. Iran-Nejad & P. D. Pearson (Eds.), Review of research in education (Vol. 24, pp. 61–101). Washington, DC: American Educational Research Association.
Burnstein, R. A., & Lederman, L. M. (2001). Using wireless keypads in lecture classes. The Physics Teacher, 39, 8–11.
Chase, C. C., Chin, D. B., Oppezzo, M. A., & Schwartz, D. L. (2009). Teachable agents and the protégé effect: Increasing the effort towards learning. Journal of Science Education and Technology, 18(4), 334–352.
Chi, M., Siler, S., Jeong, H., Yamauchi, T., & Hausmann, R. G. (2001). Learning from human tutoring. Cognitive Science, 25, 471–533.
Clarke, J., & Dede, C. (2009). Robust designs for scalability. In L. Moller, J. B. Huett, & D. M. Harvey (Eds.), Learning and instructional technologies for the 21st century: Visions of the future (pp. 27–48). New York: Springer.
Collins, A., Brown, J. S., & Holum, A. (1991). Cognitive apprenticeship: Making thinking visible. American Educator, 15(3), 6–11. 38-46.
Ellington, A. J. (2003). A meta-analysis of the effects of calculators on students’ achievement and attitude levels in precollege mathematics classes. Journal for Research in Mathematics Education, 34(5), 433–463.
Forbus, K. (1984). Qualitative process theory. Artificial Intelligence, 24(1–3), 85–168.
Galletta, D. F., Durcikova, A., Everard, A., & Jones, B. (2005). Does spell-checking software need a warning label? Communications of the ACM, 48(7), 82–85.
Gee, J. P. (2003). What video games have to teach us about learning and literacy. New York: Palgrave/Macmillan.
Gopnik, A., & Schulz, L. (Eds.). (2007). Causal learning: Psychology, philosophy, computation. New York: Oxford University Press.
Hacker, D. J., Dunlosky, J., & Graesser, A. C. (Eds.). (2009). Handbook of metacognition in education. New York: Routledge, Taylor & Francis.
Hilbert, T. S., & Renkl, A. (2008). Concept mapping as a follow-up strategy to learning from texts: What characterizes good and poor mappers? Instructional Science, 36, 53–73.
Horton, P. B., McConney, A. A., Gallo, M., Woods, A. L., Senn, G. J., & Hamelin, D. (1993). An investigation of the effectiveness of concept mapping as an instructional tool. Science Education, 77(1), 95–111.
Ito, M. (2009). Hanging out, messing around, geeking out: Kids living and learning with new media. Cambridge, MA: MIT Press.
Jackson, S. L., Krajcik, J., & Elliot, S. (1998). The design of guided learner-adaptable scaffolding in interactive learning environments. In The proceedings of CHI (pp. 187–194). NY: ACM Publishers.
Judson, E., & Sawada, D. (2002). Learning from past and present: Electronic response systems in college lecture halls. Journal of Computers in Mathematics and Science Teaching, 21(2), 167–181.
Kuhl, P. K., Tsao, F. M., & Liu, H. M. (2003). Foreign-language experience in infancy: Effects of short-term exposure and social interaction on phonetic learning. Proceedings of the National Academy of Science, 100, 9096–9101.
Martin, L., & Schwartz, D. L. (2009). Prospective adaptation in the use of representational tools. Cognition and Instruction, 27(04), 1–31.
Nesbit, J. C., & Adesope, O. O. (2006). Learning with concept and knowledge maps: A meta-analysis. Review of Educational Research, 76(3), 413–448.
Nisbett, R. E., Krantz, D., Jepson, C., & Kunda, Z. (1983). The use of statistical heuristics in everyday inductive reasoning. Psychological Review, 90, 339–363.
Novak, J. D. (2002). Meaningful learning: The essential factor for conceptual change in limited or inappropriate propositional hierarchies leading to empowerment of learners. Science Education, 86, 548–571.
Novak, J. D., & Gowin, D. B. (1984). Learning how to learn. New York: Cambridge University Press.
O’Donnell, A. M., Dansereau, D. F., & Hall, R. H. (2002). Knowledge maps as scaffolds for cognitive processing. Educational Psychology Review, 14(1), 71–86.
Palincsar, A., & Brown, A. (1984). Reciprocal teaching of comprehension-fostering and comprehension monitoring activities. Cognition and Instruction, 1(2), 117–175.
Renkl, A. (1995). Learning for later teaching: An exploration of mediational links between teaching expectancy and learning results. Learning and Instruction, 5, 21–36.
Roscoe, R. D., & Chi, M. (2008). Tutor learning: The role of explaining and responding to questions. Instructional Science, 36, 321–350.
Ruiz-Primo, M. A., & Shavelson, R. J. (1996). Problems and issues in the use of concept maps in science assessment. Journal of Research in Science Teaching, 33, 569–600.
Schwartz, D. L., Chase, C, Chin, D. B., Oppezzo, M., Kwong, H., Okita, S., et al. (2009). Interactive metacognition: Monitoring and regulating a teachable agent. In D. J. Hacker, J. Dunlosky, & A. C. Graesser (Eds.), Handbook of metacognition in education (pp. 340–358). New York: Routledge, Taylor & Francis.
Stevens, R., Satwicz, T., & McCarthy, L. (2008). In-game, in-room, in-world: Reconnecting video game play to the rest of kids’ lives. In K. Salen (Ed.), The ecology of games: Connecting youth, games, and learning (pp. 41–66). Cambridge, MA: MIT Press.
Taricani, E. M., & Clariana, R. B. (2006). A technique for automatically scoring open-ended concept maps. Educational Technology Research & Design, 54(1), 65–82.
Uretsi, J. A. R. (2000). Should I teach my computer peer? Some issues in teaching a learning companion. In G. Gautheir, C. Frasson, & K. VanLehn (Eds.), Intelligent tutoring systems (pp. 103–112). Berlin: Springer-Verlag.
Acknowledgements
This material is based upon work supported by the Institute of Education Sciences within the U.S. Department of Education under Award No. R305H060089, and the National Science Foundation under Grant Nos. 0634044 and 0904324. Any opinions, findings, and conclusions or recommendations expressed in this material are those of the authors and do not necessarily reflect the views of the granting agencies.
Author information
Authors and Affiliations
Corresponding author
Appendices
Appendix 1
Sample of added-value questions for Study 2: Living Systems Kit, Human Body Sub-unit
-
1.
Crocodiles swallow their food in large chunks. Sometimes they need to make extra stomach acid to digest the large chunks. The body uses carbon dioxide from the blood to make acid. Crocodile hearts are the same as human hearts except that they have an extra blood vessel to help make acid. Here is a diagram of the crocodile heart.
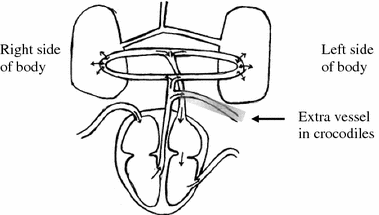

Using what you know about the human heart and lungs, why is this vessel located here and not somewhere else? Explain your reasoning.
-
2.
After you donate blood, you should eat a snack and rest. Using what you know about blood, why do you need the snack and the rest?
-
3.
When cells do less work, what happens to the amount of carbon dioxide in the body?
-
4.
How does an increase in heart beating help increase the amount of oxygen in your body? Explain your reasoning.
Appendix 2
Samples of expert maps used in Study 2

a Expert map for Living Systems Kit, Human Body Sub-unit. b Expert map for Water Planet Kit, Water Vapor I Sub-unit
Rights and permissions
About this article
Cite this article
Chin, D.B., Dohmen, I.M., Cheng, B.H. et al. Preparing students for future learning with Teachable Agents. Education Tech Research Dev 58, 649–669 (2010). https://doi.org/10.1007/s11423-010-9154-5
Published:
Issue Date:
DOI: https://doi.org/10.1007/s11423-010-9154-5